- Essentials
- Getting Started
- Agent
- API
- APM Tracing
- Containers
- Dashboards
- Database Monitoring
- Datadog
- Datadog Site
- DevSecOps
- Incident Management
- Integrations
- Internal Developer Portal
- Logs
- Monitors
- OpenTelemetry
- Profiler
- Session Replay
- Security
- Serverless for AWS Lambda
- Software Delivery
- Synthetic Monitoring and Testing
- Tags
- Workflow Automation
- Learning Center
- Support
- Glossary
- Standard Attributes
- Guides
- Agent
- Integrations
- Developers
- Authorization
- DogStatsD
- Custom Checks
- Integrations
- Create an Agent-based Integration
- Create an API Integration
- Create a Log Pipeline
- Integration Assets Reference
- Build a Marketplace Offering
- Create a Tile
- Create an Integration Dashboard
- Create a Monitor Template
- Create a Cloud SIEM Detection Rule
- OAuth for Integrations
- Install Agent Integration Developer Tool
- Service Checks
- IDE Plugins
- Community
- Guides
- OpenTelemetry
- Administrator's Guide
- API
- Partners
- Datadog Mobile App
- DDSQL Reference
- CoScreen
- CoTerm
- Cloudcraft (Standalone)
- In The App
- Dashboards
- Notebooks
- DDSQL Editor
- Reference Tables
- Sheets
- Monitors and Alerting
- Metrics
- Watchdog
- Bits AI
- Internal Developer Portal
- Error Tracking
- Change Tracking
- Service Management
- Actions & Remediations
- Infrastructure
- Cloudcraft
- Resource Catalog
- Universal Service Monitoring
- Hosts
- Containers
- Processes
- Serverless
- Network Monitoring
- Cloud Cost
- Application Performance
- APM
- APM Terms and Concepts
- Application Instrumentation
- APM Metrics Collection
- Trace Pipeline Configuration
- Correlate Traces with Other Telemetry
- Trace Explorer
- Recommendations
- Code Origins for Spans
- Service Observability
- Endpoint Observability
- Dynamic Instrumentation
- Live Debugger
- Error Tracking
- Data Security
- Guides
- Troubleshooting
- Continuous Profiler
- Database Monitoring
- Agent Integration Overhead
- Setup Architectures
- Setting Up Postgres
- Setting Up MySQL
- Setting Up SQL Server
- Setting Up Oracle
- Setting Up Amazon DocumentDB
- Setting Up MongoDB
- Connecting DBM and Traces
- Data Collected
- Exploring Database Hosts
- Exploring Query Metrics
- Exploring Query Samples
- Exploring Database Schemas
- Exploring Recommendations
- Troubleshooting
- Guides
- Data Streams Monitoring
- Data Jobs Monitoring
- Data Observability
- Digital Experience
- Real User Monitoring
- Synthetic Testing and Monitoring
- Continuous Testing
- Product Analytics
- Software Delivery
- CI Visibility
- CD Visibility
- Deployment Gates
- Test Optimization
- Quality Gates
- DORA Metrics
- Security
- Security Overview
- Cloud SIEM
- Code Security
- Cloud Security
- App and API Protection
- Workload Protection
- Sensitive Data Scanner
- AI Observability
- Log Management
- Observability Pipelines
- Log Management
- Administration
Getting Started with App and API Protection
This product is not supported for your selected Datadog site. ().
Overview
Datadog App and API Protection (AAP) helps secure your web applications and APIs in production.
- With threat detection, Datadog provides real-time protection against attacks and attackers targeting code-level vulnerabilities.
- With Code Security, Datadog detects code and library vulnerabilities in your repositories and your running services, providing end-to-end visibility from development to production.
This guide walks you through best practices for getting your team up and running with AAP.
Identify services that have security risk
Identify services vulnerable or exposed to attacks that would benefit from AAP. On the Software Catalog > Security page, view and select the services you wish to enable.
These security insights are detected from data reported by APM. The insights help prioritize your security efforts. AAP identifies, prioritizes, and helps remediate all security risks on your services.
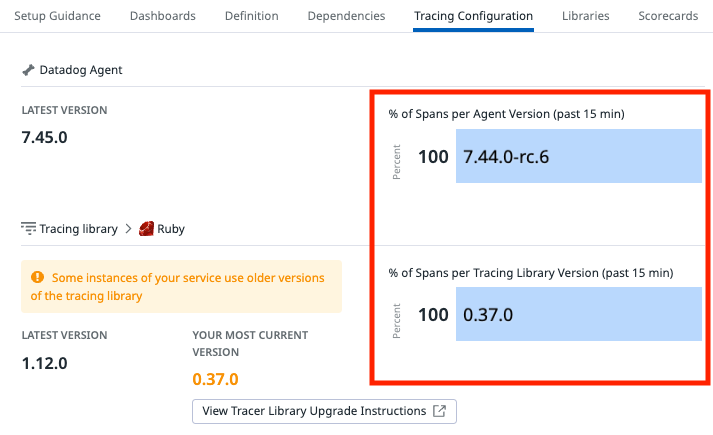
Note: If no vulnerabilities or suspicious requests are reported, ensure your services are using a recent Datadog tracing library version. From the Security Software Catalog, open any service’s side panel and look at its Tracing Configuration.
Enable AAP
Enable AAP with in-app instructions
- To enable App and API Protection in-app, navigate to App and API Protection > Setup.
- To enable Code Security in-app, navigate to Code Security > Setup.
Enable AAP with Remote Configuration
Prerequisites:
- Datadog Agent versions 7.42.0 or higher installed on your hosts or containers.
- Datadog Tracer versions are compatible with Remote Configuration.
Setup Remote Configuration (if not enabled already)
Follow the steps to enable Remote Configuration in your Datadog UI. This includes:
- Activate Remote Config capability for your organization.
- Add Remote Configuration capability to an existing API key, or create a new one.
- Update your Datadog Agent configuration to use the API key with Remote Configuration capability.
See Setting up Remote Configuration for more information.
Test AAP
Once enabled, AAP immediately identifies application vulnerabilities and detects attacks and attackers targeting your services.
- Validate vulnerabilities: Navigate to the Vulnerabilities tab, triage and remediate your vulnerabilities.
- Validate attacks: Send attack patterns to trigger a test detection rule. From your terminal, run the following script:
  for ((i=1;i<=250;i++)); do
  # Target existing service's routes
  curl https://your-application-url/<EXISTING ROUTE> -A
  'dd-test-scanner-log';
  # Target non existing service's routes
  curl https://your-application-url/<NON-EXISTING ROUTE> -A
  'dd-test-scanner-log';
done- Go to Security Signals Explorer to see the signal that is generated after a few seconds.
Disable AAP
For information on disabling AAP or its related capabilities, see the following:
Reports and notifications
Datadog does not send security notifications through webhooks due to HIPAA restrictions. Security alerts won't be sent to the webhook for HIPAA-enabled accounts. If you have a HIPAA-enabled account, you cannot use
@webhook... in the Notify the following recipients setting within Datadog security notifications. If you want these alerts sent, please contact support.- Set up notification rules to receive alerts using Slack, Jira, email, and more.
- Subscribe to the weekly threat digest reports to begin investigation and remediation of the most important security threats discovered in the last seven days.
Further reading
Additional helpful documentation, links, and articles:


