Getting Started with Monitors
Overview
With Datadog alerting, you have the ability to create monitors that actively check metrics, integration availability, network endpoints, and more. Use monitors to draw attention to the systems that require observation, inspection, and intervention.
This page is an introduction to monitors and outlines instructions for setting up a metric monitor. A metric monitor provides alerts and notifications if a specific metric is above or below a certain threshold. For example, a metric monitor can alert you when disk space is low.
This guide covers:
- Monitor creation and configuration
- Setting up monitor alerts
- Customizing notification messages
- Monitor permissions
Prerequisites
Before getting started, you need a Datadog account linked to a host with the Datadog Agent installed. To learn more about the Agent, see the Getting started with the Agent guide, or navigate to Integrations > Agent to view installation instructions.
To verify that the Datadog Agent is running, check that your Infrastructure List in Datadog is populated.
Create a monitor
To create a monitor, navigate to Monitors > New Monitor > Metric.
The main components of monitor configuration are:
- Detection method: How are you measuring what will be alerted on? Are you concerned about a metric value crossing a threshold, a change in a value crossing a threshold, an anomalous value, or something else?
- Define the metric: What value are you monitoring to alert? The disk space in your system? The number of errors encountered for logins?
- Alert conditions: When does an engineer need to be woken up?
- Notification: What information needs to be in the alert?
Choose the detection method
When you create a metric monitor, Threshold Alert is automatically selected as the detection method. A threshold alert compares metric values against user-defined thresholds. The goal for this monitor is to alert on a static threshold, so no change is necessary.
Define the metric
To get an alert on low disk space, use the system.disk.in_use metric from the Disk integration and average the metric over host and device:
Set alert conditions
According to the Disk integration documentation, system.disk.in_use is the amount of disk space in use as a fraction of the total. So, when this metric is reporting a value of 0.7, the device is 70% full.
To alert on low disk space, the monitor should trigger when the metric is above the threshold. The threshold values are based on your preference. For this metric, values between 0 and 1 are appropriate:
Set the following thresholds:
Alert threshold: > 0.9
Warning threshold: > 0.8
For this example, leave the other settings in this section on the defaults. For more details, see the Metric Monitors documentation.
Notification
When this monitor is triggered to alert, a notification message is sent. In this message, you can include conditional values, instructions for resolution, or a summary of what the alert is. At minimum, a notification must have a title and message.
Title
The title must be unique for each monitor. Since this is a multi alert monitor, names are available for each group element (host and device) with message template variables:
Disk space is low on {{device.name}} / {{host.name}}
Message
Use the message to tell your team how to resolve the issue, for example:
Steps to free up disk space:
1. Remove unused packages
2. Clear APT cache
3. Uninstall unnecessary applications
4. Remove duplicate files
To add conditional messages based on alert vs. warning thresholds, see the available Notification Variables you can include in your message.
Notify your services and your team members
Send notifications to your team through Email, Slack, PagerDuty, and more. You can search for team members and connected accounts with the dropdown box. When an @notification is added to this box, the notification is automatically added to the message box:
Removing the @notification from either section removes it from both sections.
Leave the other sections as-is. For more information on what each configuration option does, see the Monitor configuration documentation.
Permissions
Use this option to restrict the editing of your monitor to its creator and to specific roles in your org. For more information about roles, see Role Based Access Control.
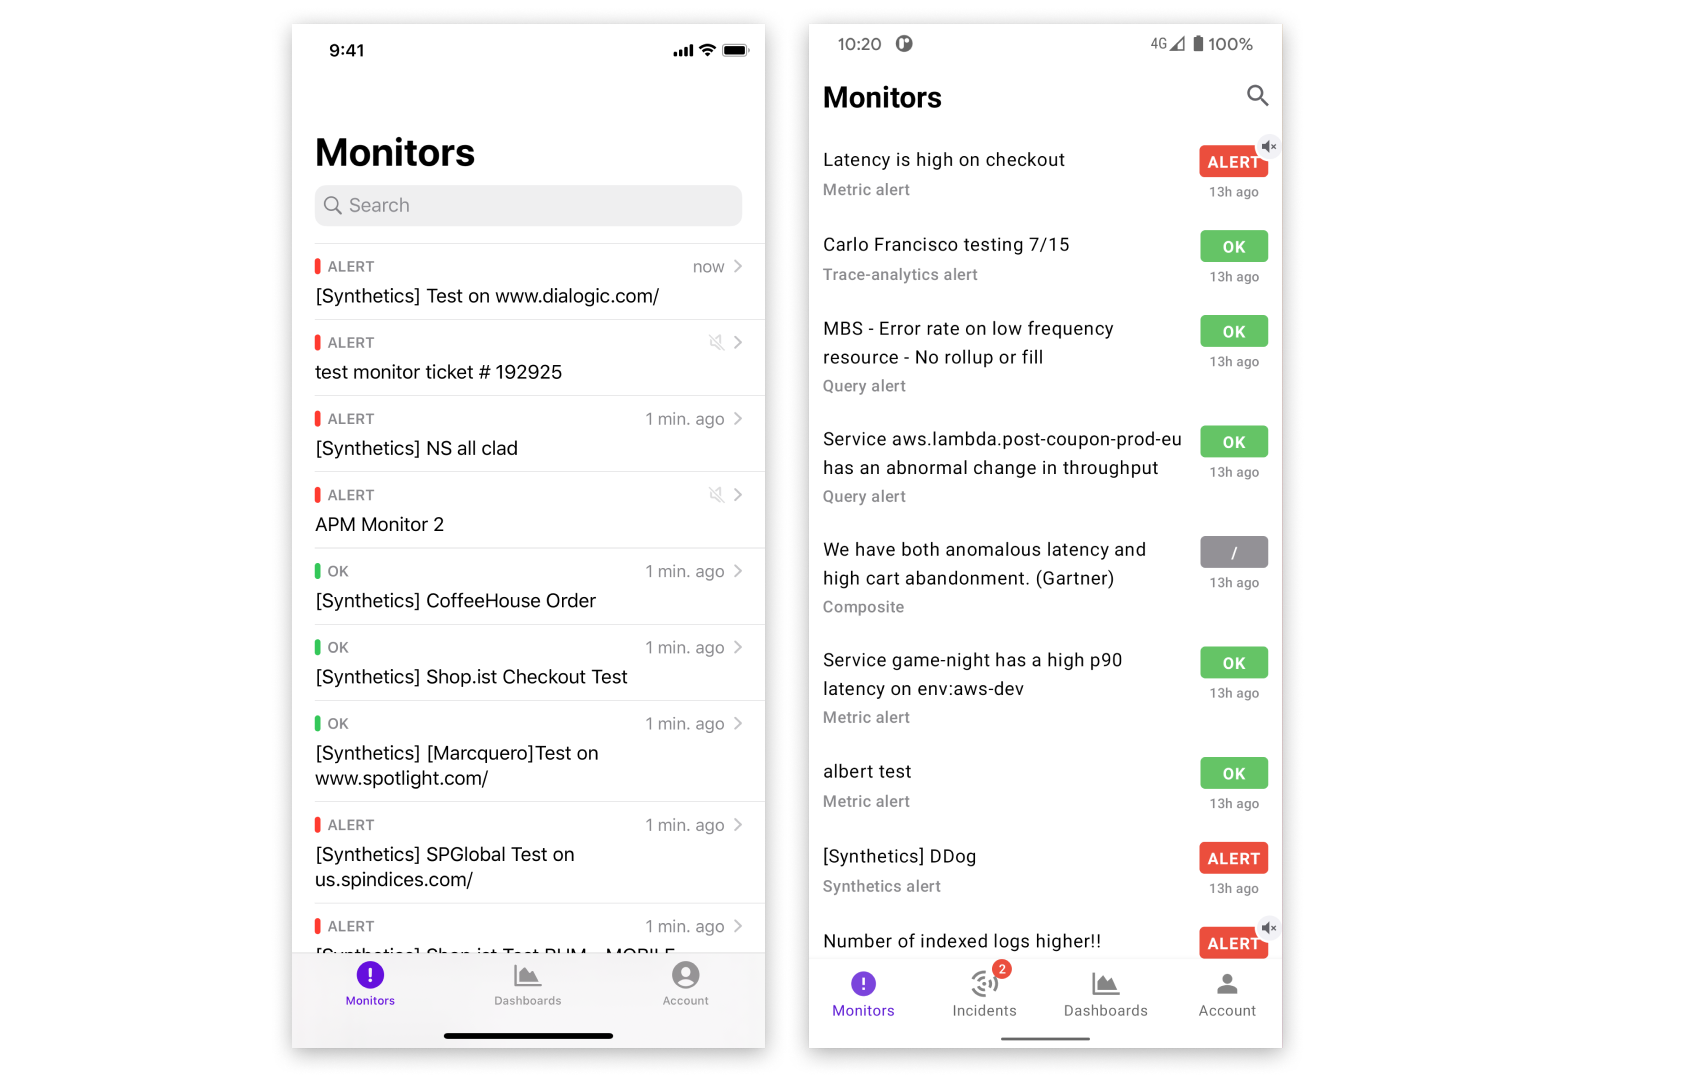
View Monitors and Triage Alerts on Mobile
You can view Monitor Saved Views from your mobile home screen or view and mute monitors by downloading the Datadog Mobile App, available on the Apple App Store and Google Play Store. This helps with triaging when you are away from your laptop or desktop.
Further Reading
Additional helpful documentation, links, and articles: