- Principales informations
- Getting Started
- Agent
- API
- Tracing
- Conteneurs
- Dashboards
- Database Monitoring
- Datadog
- Site Datadog
- DevSecOps
- Incident Management
- Intégrations
- Internal Developer Portal
- Logs
- Monitors
- OpenTelemetry
- Profileur
- Session Replay
- Security
- Serverless for AWS Lambda
- Software Delivery
- Surveillance Synthetic
- Tags
- Workflow Automation
- Learning Center
- Support
- Glossary
- Standard Attributes
- Guides
- Agent
- Intégrations
- Développeurs
- OpenTelemetry
- Administrator's Guide
- API
- Partners
- Application mobile
- DDSQL Reference
- CoScreen
- CoTerm
- Remote Configuration
- Cloudcraft
- In The App
- Dashboards
- Notebooks
- DDSQL Editor
- Reference Tables
- Sheets
- Alertes
- Watchdog
- Métriques
- Bits AI
- Internal Developer Portal
- Error Tracking
- Change Tracking
- Service Management
- Actions & Remediations
- Infrastructure
- Cloudcraft
- Resource Catalog
- Universal Service Monitoring
- Hosts
- Conteneurs
- Processes
- Sans serveur
- Surveillance réseau
- Cloud Cost
- Application Performance
- APM
- Termes et concepts de l'APM
- Sending Traces to Datadog
- APM Metrics Collection
- Trace Pipeline Configuration
- Connect Traces with Other Telemetry
- Trace Explorer
- Recommendations
- Code Origin for Spans
- Observabilité des services
- Endpoint Observability
- Dynamic Instrumentation
- Live Debugger
- Suivi des erreurs
- Sécurité des données
- Guides
- Dépannage
- Profileur en continu
- Database Monitoring
- Agent Integration Overhead
- Setup Architectures
- Configuration de Postgres
- Configuration de MySQL
- Configuration de SQL Server
- Setting Up Oracle
- Setting Up Amazon DocumentDB
- Setting Up MongoDB
- Connecting DBM and Traces
- Données collectées
- Exploring Database Hosts
- Explorer les métriques de requête
- Explorer des échantillons de requêtes
- Exploring Database Schemas
- Exploring Recommendations
- Dépannage
- Guides
- Data Streams Monitoring
- Data Jobs Monitoring
- Data Observability
- Digital Experience
- RUM et Session Replay
- Surveillance Synthetic
- Continuous Testing
- Product Analytics
- Software Delivery
- CI Visibility
- CD Visibility
- Deployment Gates
- Test Visibility
- Code Coverage
- Quality Gates
- DORA Metrics
- Feature Flags
- Securité
- Security Overview
- Cloud SIEM
- Code Security
- Cloud Security Management
- Application Security Management
- Workload Protection
- Sensitive Data Scanner
- AI Observability
- Log Management
- Pipelines d'observabilité
- Log Management
- CloudPrem
- Administration
Test Coverage
Cette page n'est pas encore disponible en français, sa traduction est en cours.
Si vous avez des questions ou des retours sur notre projet de traduction actuel, n'hésitez pas à nous contacter.
Si vous avez des questions ou des retours sur notre projet de traduction actuel, n'hésitez pas à nous contacter.
Overview
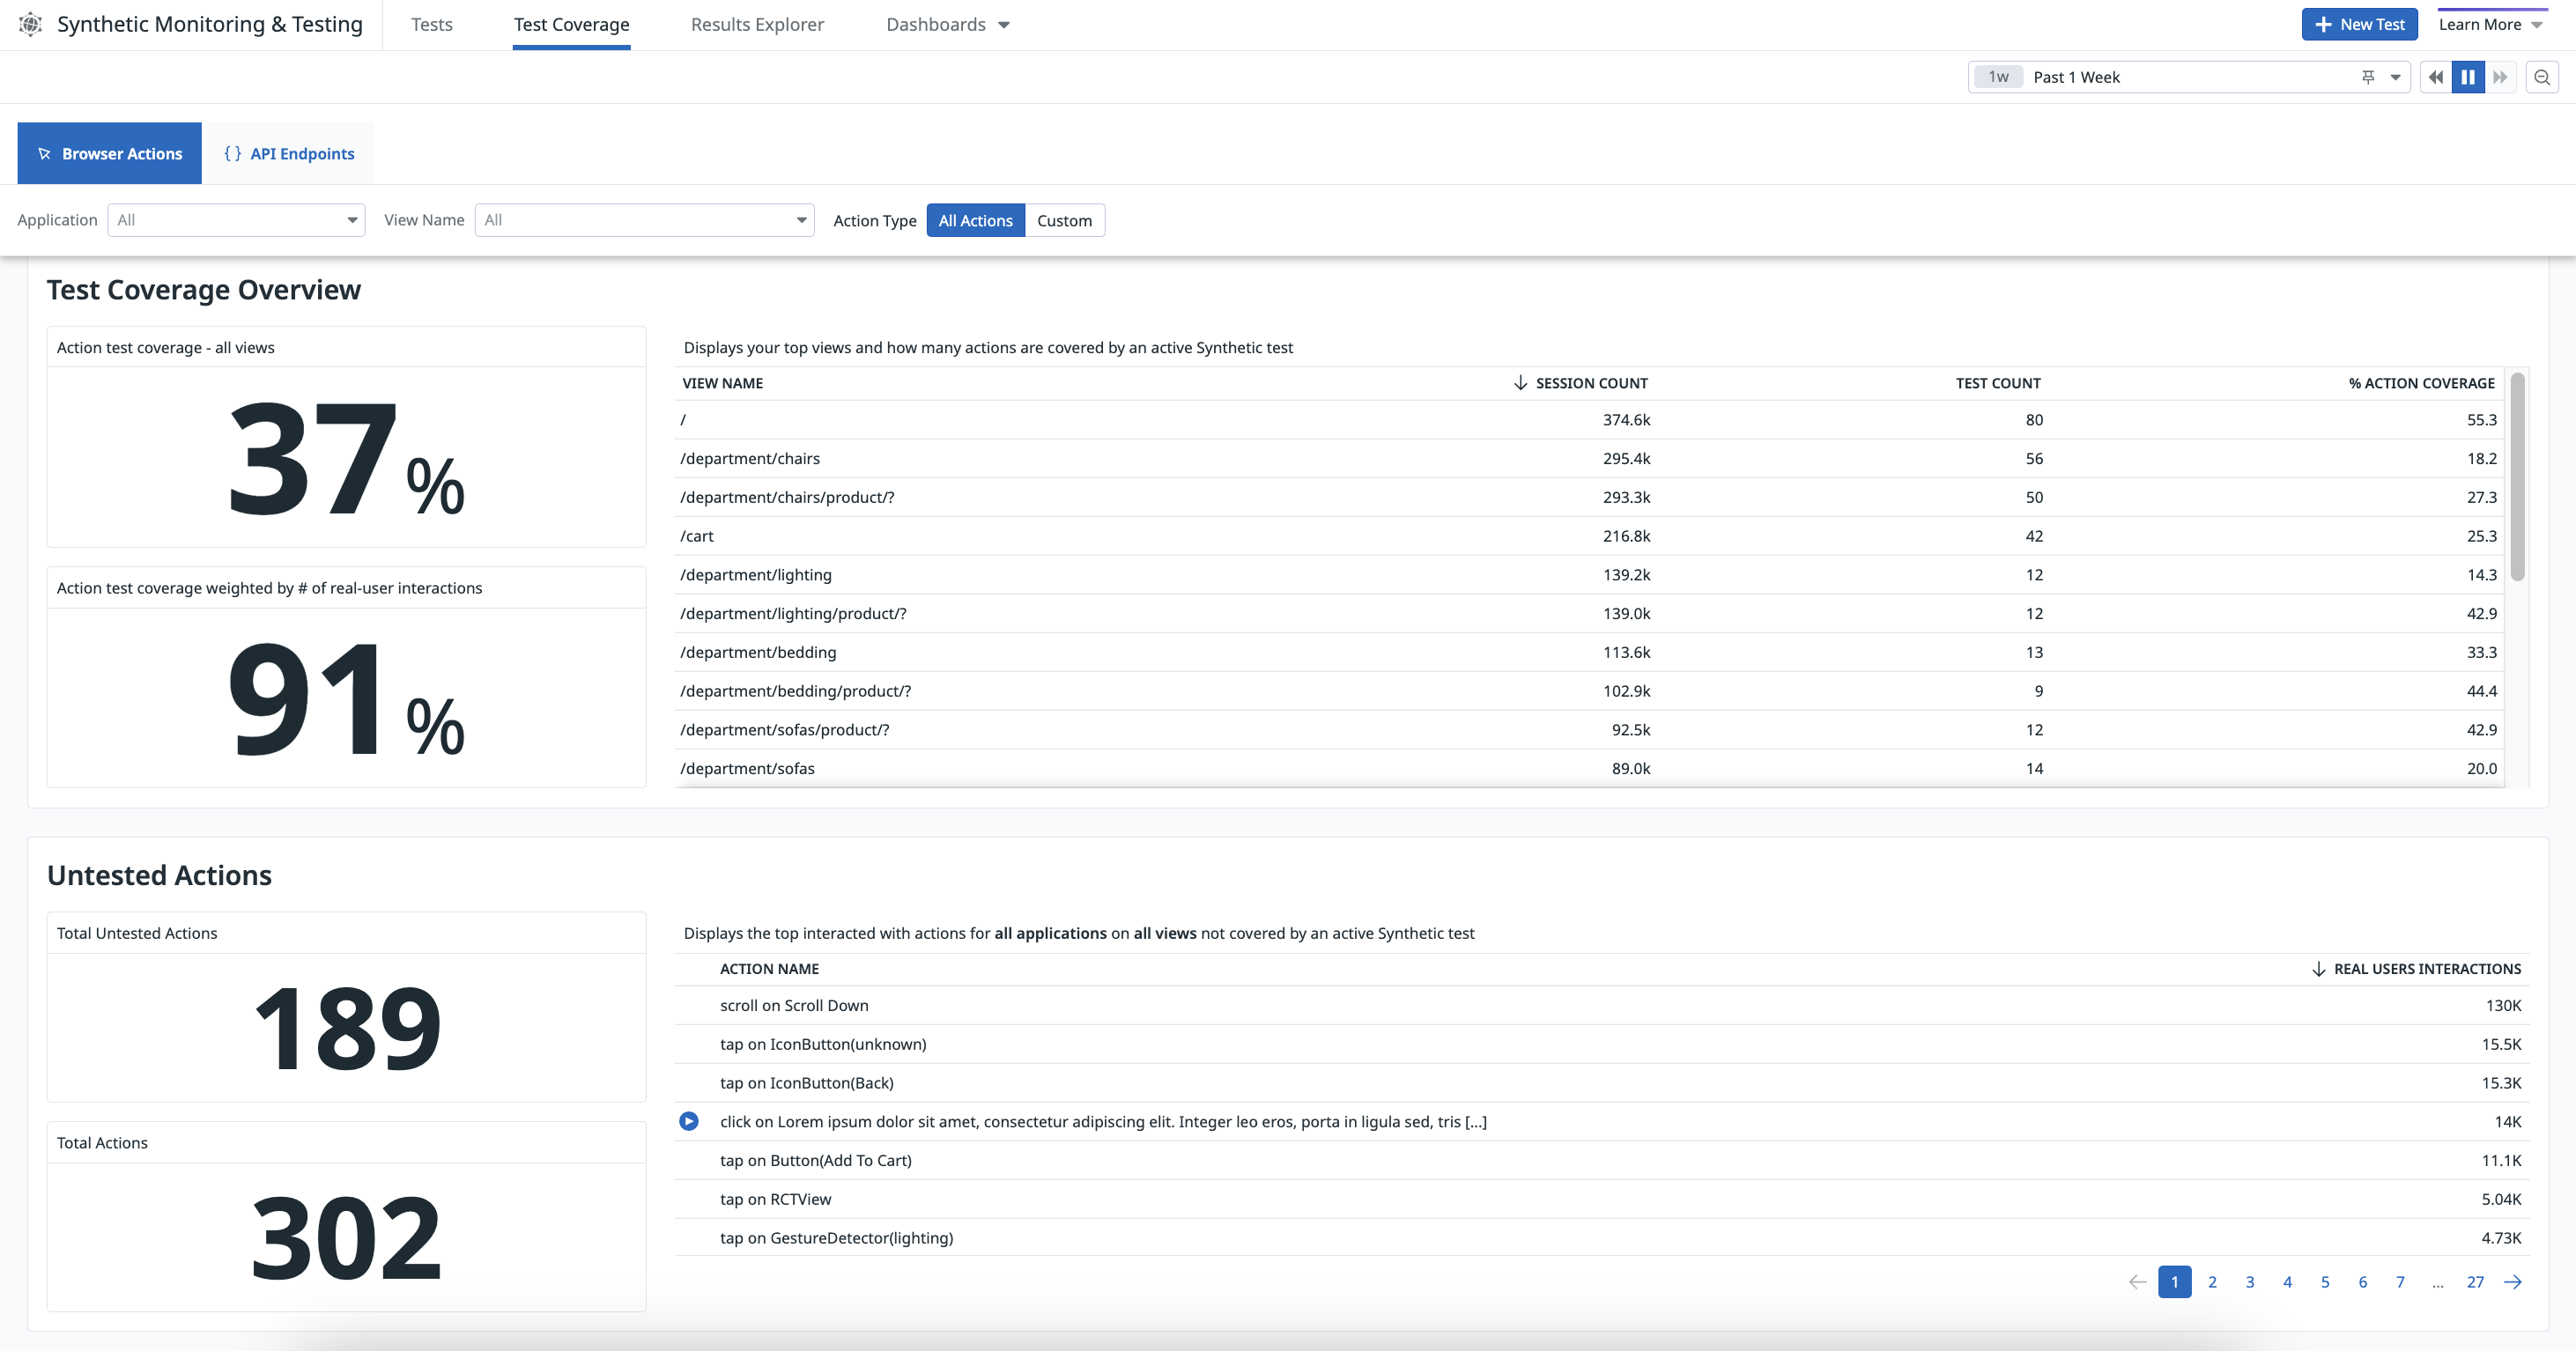
Explore your testing suite’s Synthetic test coverage of RUM browser actions on the Test Coverage page, which you can find under Digital Experience > Synthetic Monitoring & Testing.
The Test Coverage page provides actionable insight into the overall testing coverage of your RUM applications. It uses data collected from the Browser RUM SDK and results from Synthetic browser tests.
The Test Coverage page presents the following information:
- The top visited web pages
- The percentage of tested RUM actions
- The number of tested and total actions
- The number of browser tests covering actions
- The number of real user interactions
Investigate test coverage for an application or view
Build a more comprehensive, accurate testing suite by identifying untested actions and linking them with real user interactions on the Test Coverage page.
To identify areas in your application or views where you should create browser tests:
- Select a RUM application from the Application dropdown menu or a view from the View Name dropdown menu.
- Click Custom to filter the data on custom actions, which are unique and offer more accurate coverage results compared to generated actions. If you want to include generated actions in the test coverage analysis, select All Actions.
- Identify gaps in your test coverage by examining the information presented in the following sections:
- Test Coverage Overview
- Displays the percentage of actions being tested, the percentage of actions being tested weighted by the number of real user interactions, and a list of top views with their counts of user sessions and browser tests, and the percentage of actions being tested.
- Untested Actions
- Displays the number of untested user actions, the number of total actions collected, and a list of top actions that real users most interact with but are not being tested.
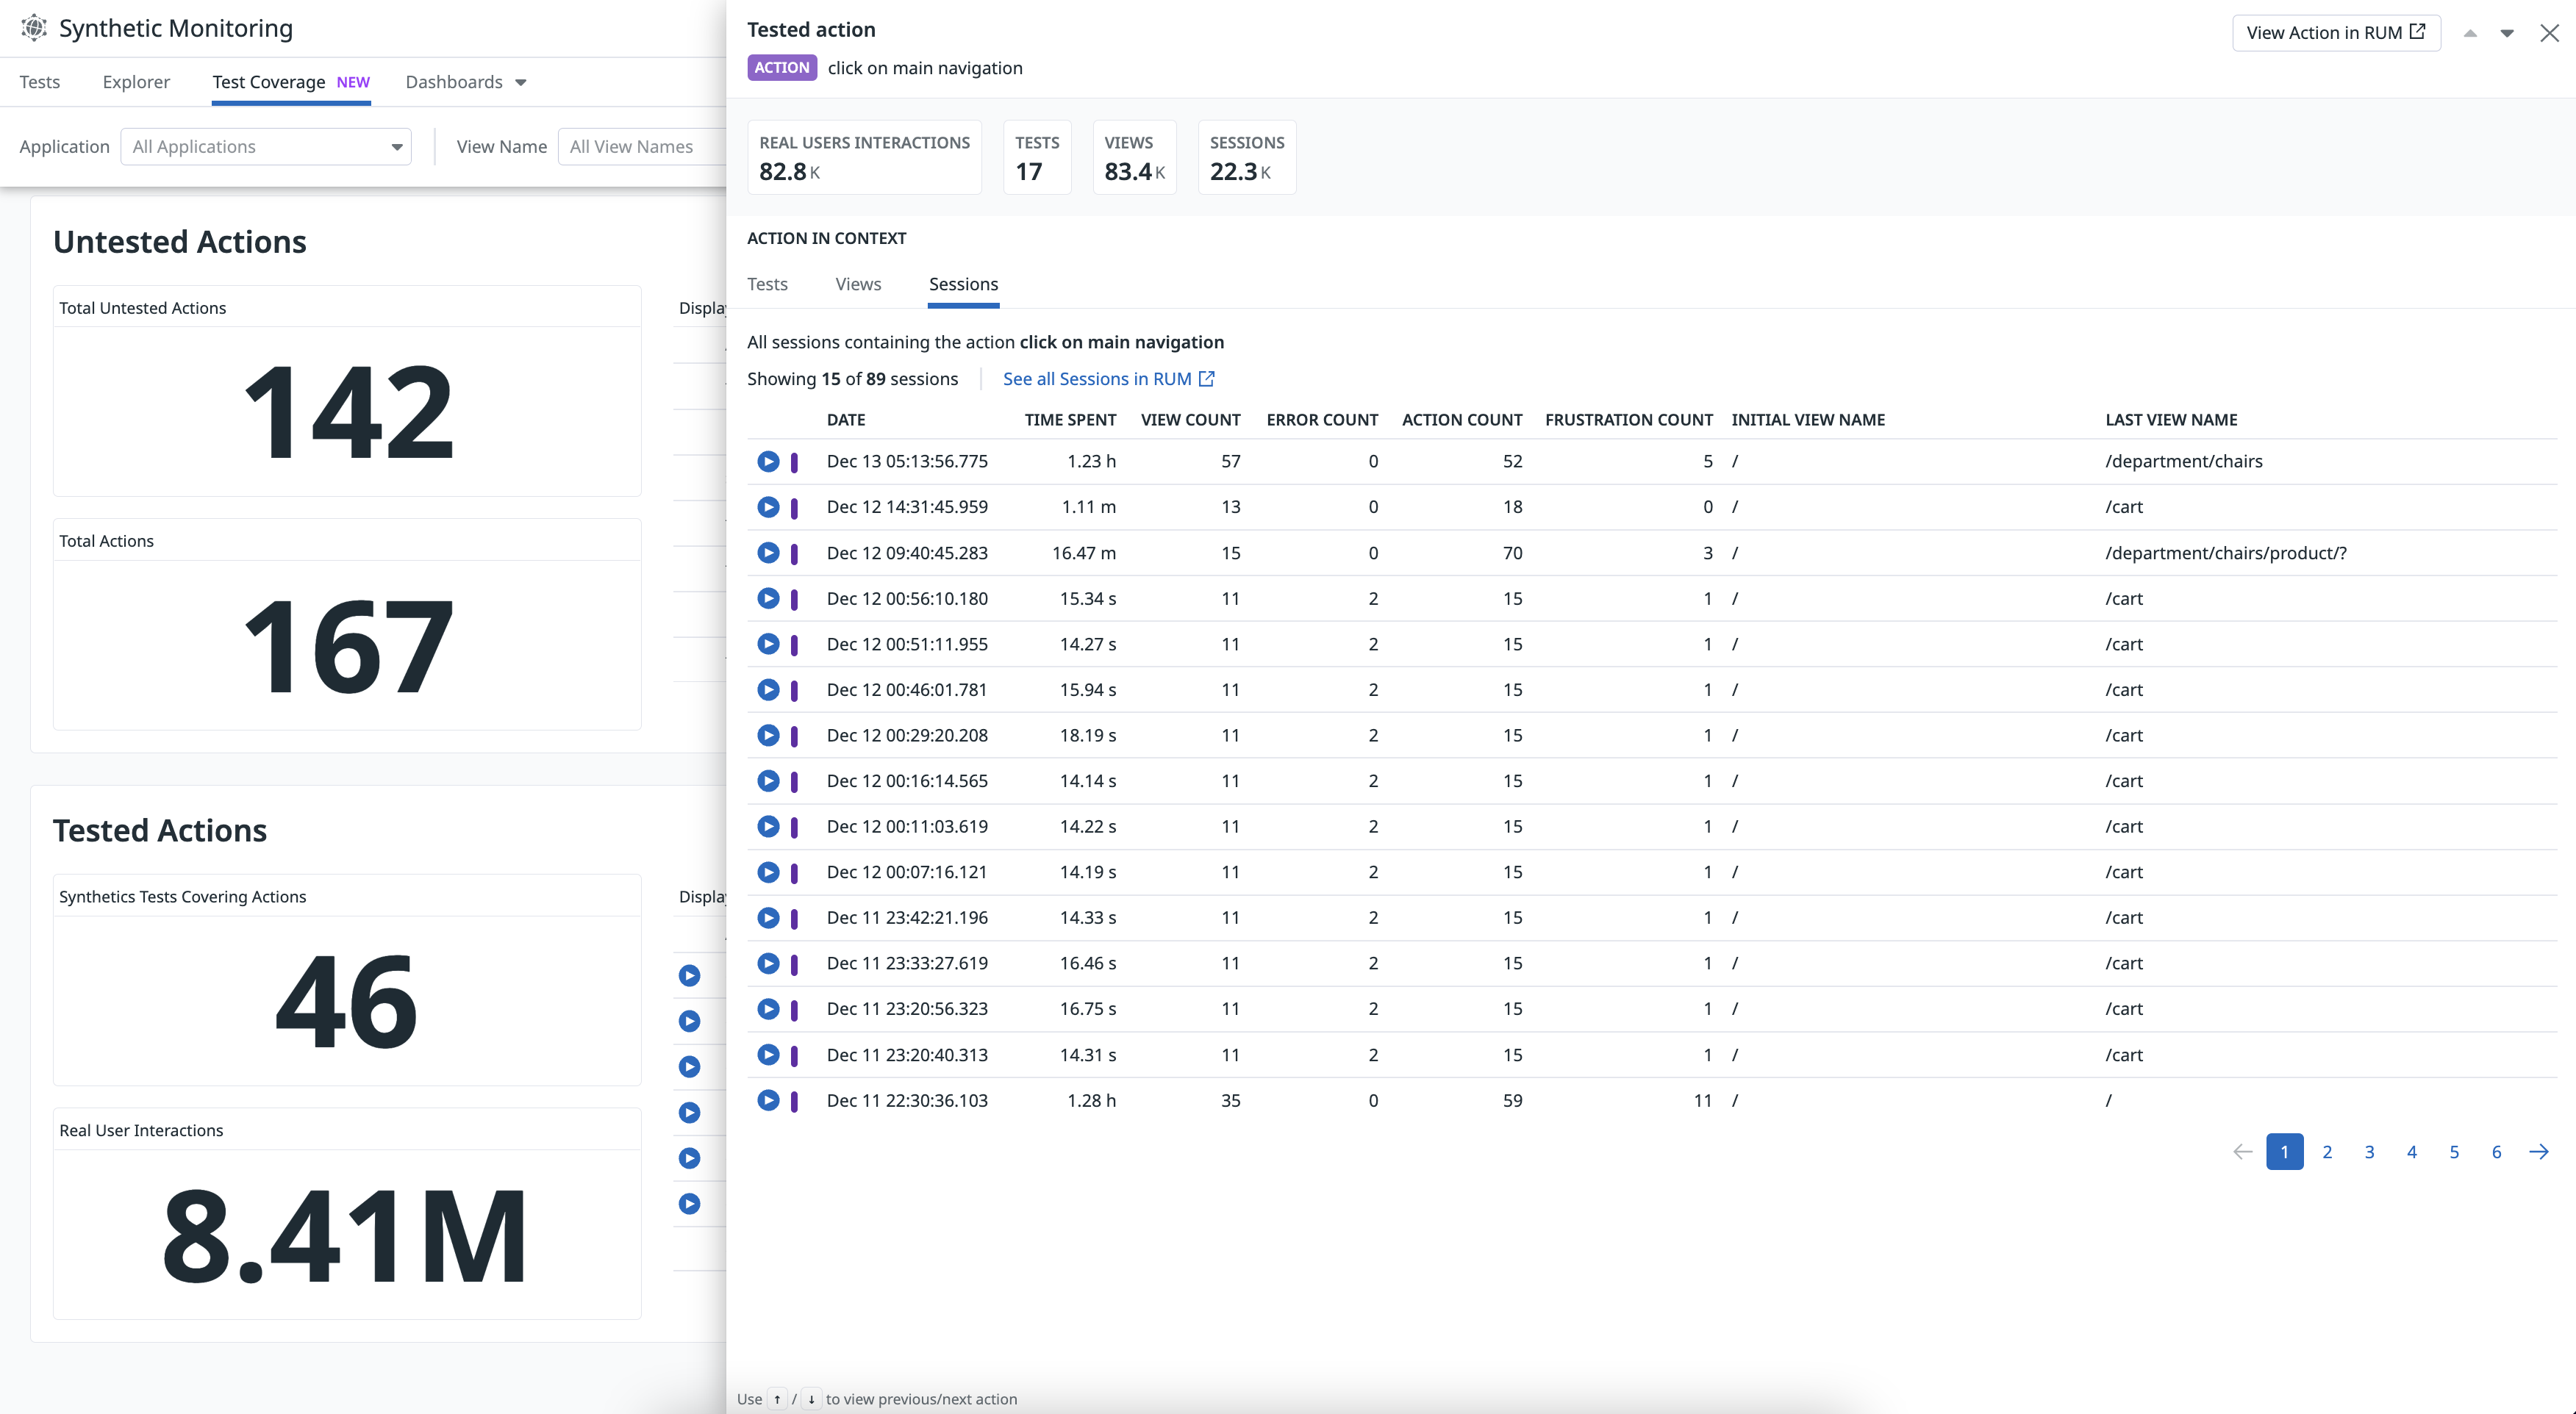
- Tested Actions
- Displays the number of browser tests covering user actions, the number of real user interactions, and a list of top actions that real users most interact with and are being tested.
The Test Coverage page populates actions that are extensively used, and hides actions that are less commonly used in your application. For more information about the data displayed, see Synthetic Monitoring Metrics.
View replays and add tests
Use the information on the Test Coverage page to answer the following questions:
- What actions are not being tested in your application?
- What views are the most popular to your users?
- What actions need more browser tests?
- What percentage of browser tests are covering user actions?
View session replays
Click on the Play icon next to an action in the Untested Actions table to examine a recording of real user interaction in Session Replay.
Examine actions
Click on an action to access the number of tests, views, sessions, and a subset of these tests, views, and sessions that include the selected action.
Add the most popular sections of your application to a new or existing browser test so that you are alerted when key user journeys in your application are negatively impacted by a code change.
To create a test, click + New Test on the top right of the Test Coverage page. You can run tests directly in your CI/CD pipelines to ensure no regressions occur before releasing code in production.
Further Reading
Documentation, liens et articles supplémentaires utiles:


