- Principales informations
- Getting Started
- Datadog
- Site Datadog
- DevSecOps
- Serverless for AWS Lambda
- Agent
- Intégrations
- Conteneurs
- Dashboards
- Monitors
- Logs
- Tracing
- Profileur
- Tags
- API
- Service Catalog
- Session Replay
- Continuous Testing
- Surveillance Synthetic
- Incident Management
- Database Monitoring
- Cloud Security Management
- Cloud SIEM
- Application Security Management
- Workflow Automation
- CI Visibility
- Test Visibility
- Intelligent Test Runner
- Code Analysis
- Learning Center
- Support
- Glossary
- Standard Attributes
- Guides
- Agent
- Intégrations
- OpenTelemetry
- Développeurs
- Authorization
- DogStatsD
- Checks custom
- Intégrations
- Create an Agent-based Integration
- Create an API Integration
- Create a Log Pipeline
- Integration Assets Reference
- Build a Marketplace Offering
- Create a Tile
- Create an Integration Dashboard
- Create a Recommended Monitor
- Create a Cloud SIEM Detection Rule
- OAuth for Integrations
- Install Agent Integration Developer Tool
- Checks de service
- IDE Plugins
- Communauté
- Guides
- Administrator's Guide
- API
- Application mobile
- CoScreen
- Cloudcraft
- In The App
- Dashboards
- Notebooks
- DDSQL Editor
- Alertes
- Infrastructure
- Métriques
- Watchdog
- Bits AI
- Service Catalog
- API Catalog
- Error Tracking
- Service Management
- Infrastructure
- Universal Service Monitoring
- Conteneurs
- Sans serveur
- Surveillance réseau
- Cloud Cost
- Application Performance
- APM
- Profileur en continu
- Database Monitoring
- Agent Integration Overhead
- Setup Architectures
- Configuration de Postgres
- Configuration de MySQL
- Configuration de SQL Server
- Setting Up Oracle
- Setting Up MongoDB
- Connecting DBM and Traces
- Données collectées
- Exploring Database Hosts
- Explorer les métriques de requête
- Explorer des échantillons de requêtes
- Dépannage
- Guides
- Data Streams Monitoring
- Data Jobs Monitoring
- Digital Experience
- RUM et Session Replay
- Product Analytics
- Surveillance Synthetic
- Continuous Testing
- Software Delivery
- CI Visibility
- CD Visibility
- Test Visibility
- Exécuteur de tests intelligent
- Code Analysis
- Quality Gates
- DORA Metrics
- Securité
- Security Overview
- Cloud SIEM
- Cloud Security Management
- Application Security Management
- AI Observability
- Log Management
- Pipelines d'observabilité
- Log Management
- Administration
Exploring Endpoints
Cette page n'est pas encore disponible en français, sa traduction est en cours.
Si vous avez des questions ou des retours sur notre projet de traduction actuel, n'hésitez pas à nous contacter.
Si vous avez des questions ou des retours sur notre projet de traduction actuel, n'hésitez pas à nous contacter.
Overview
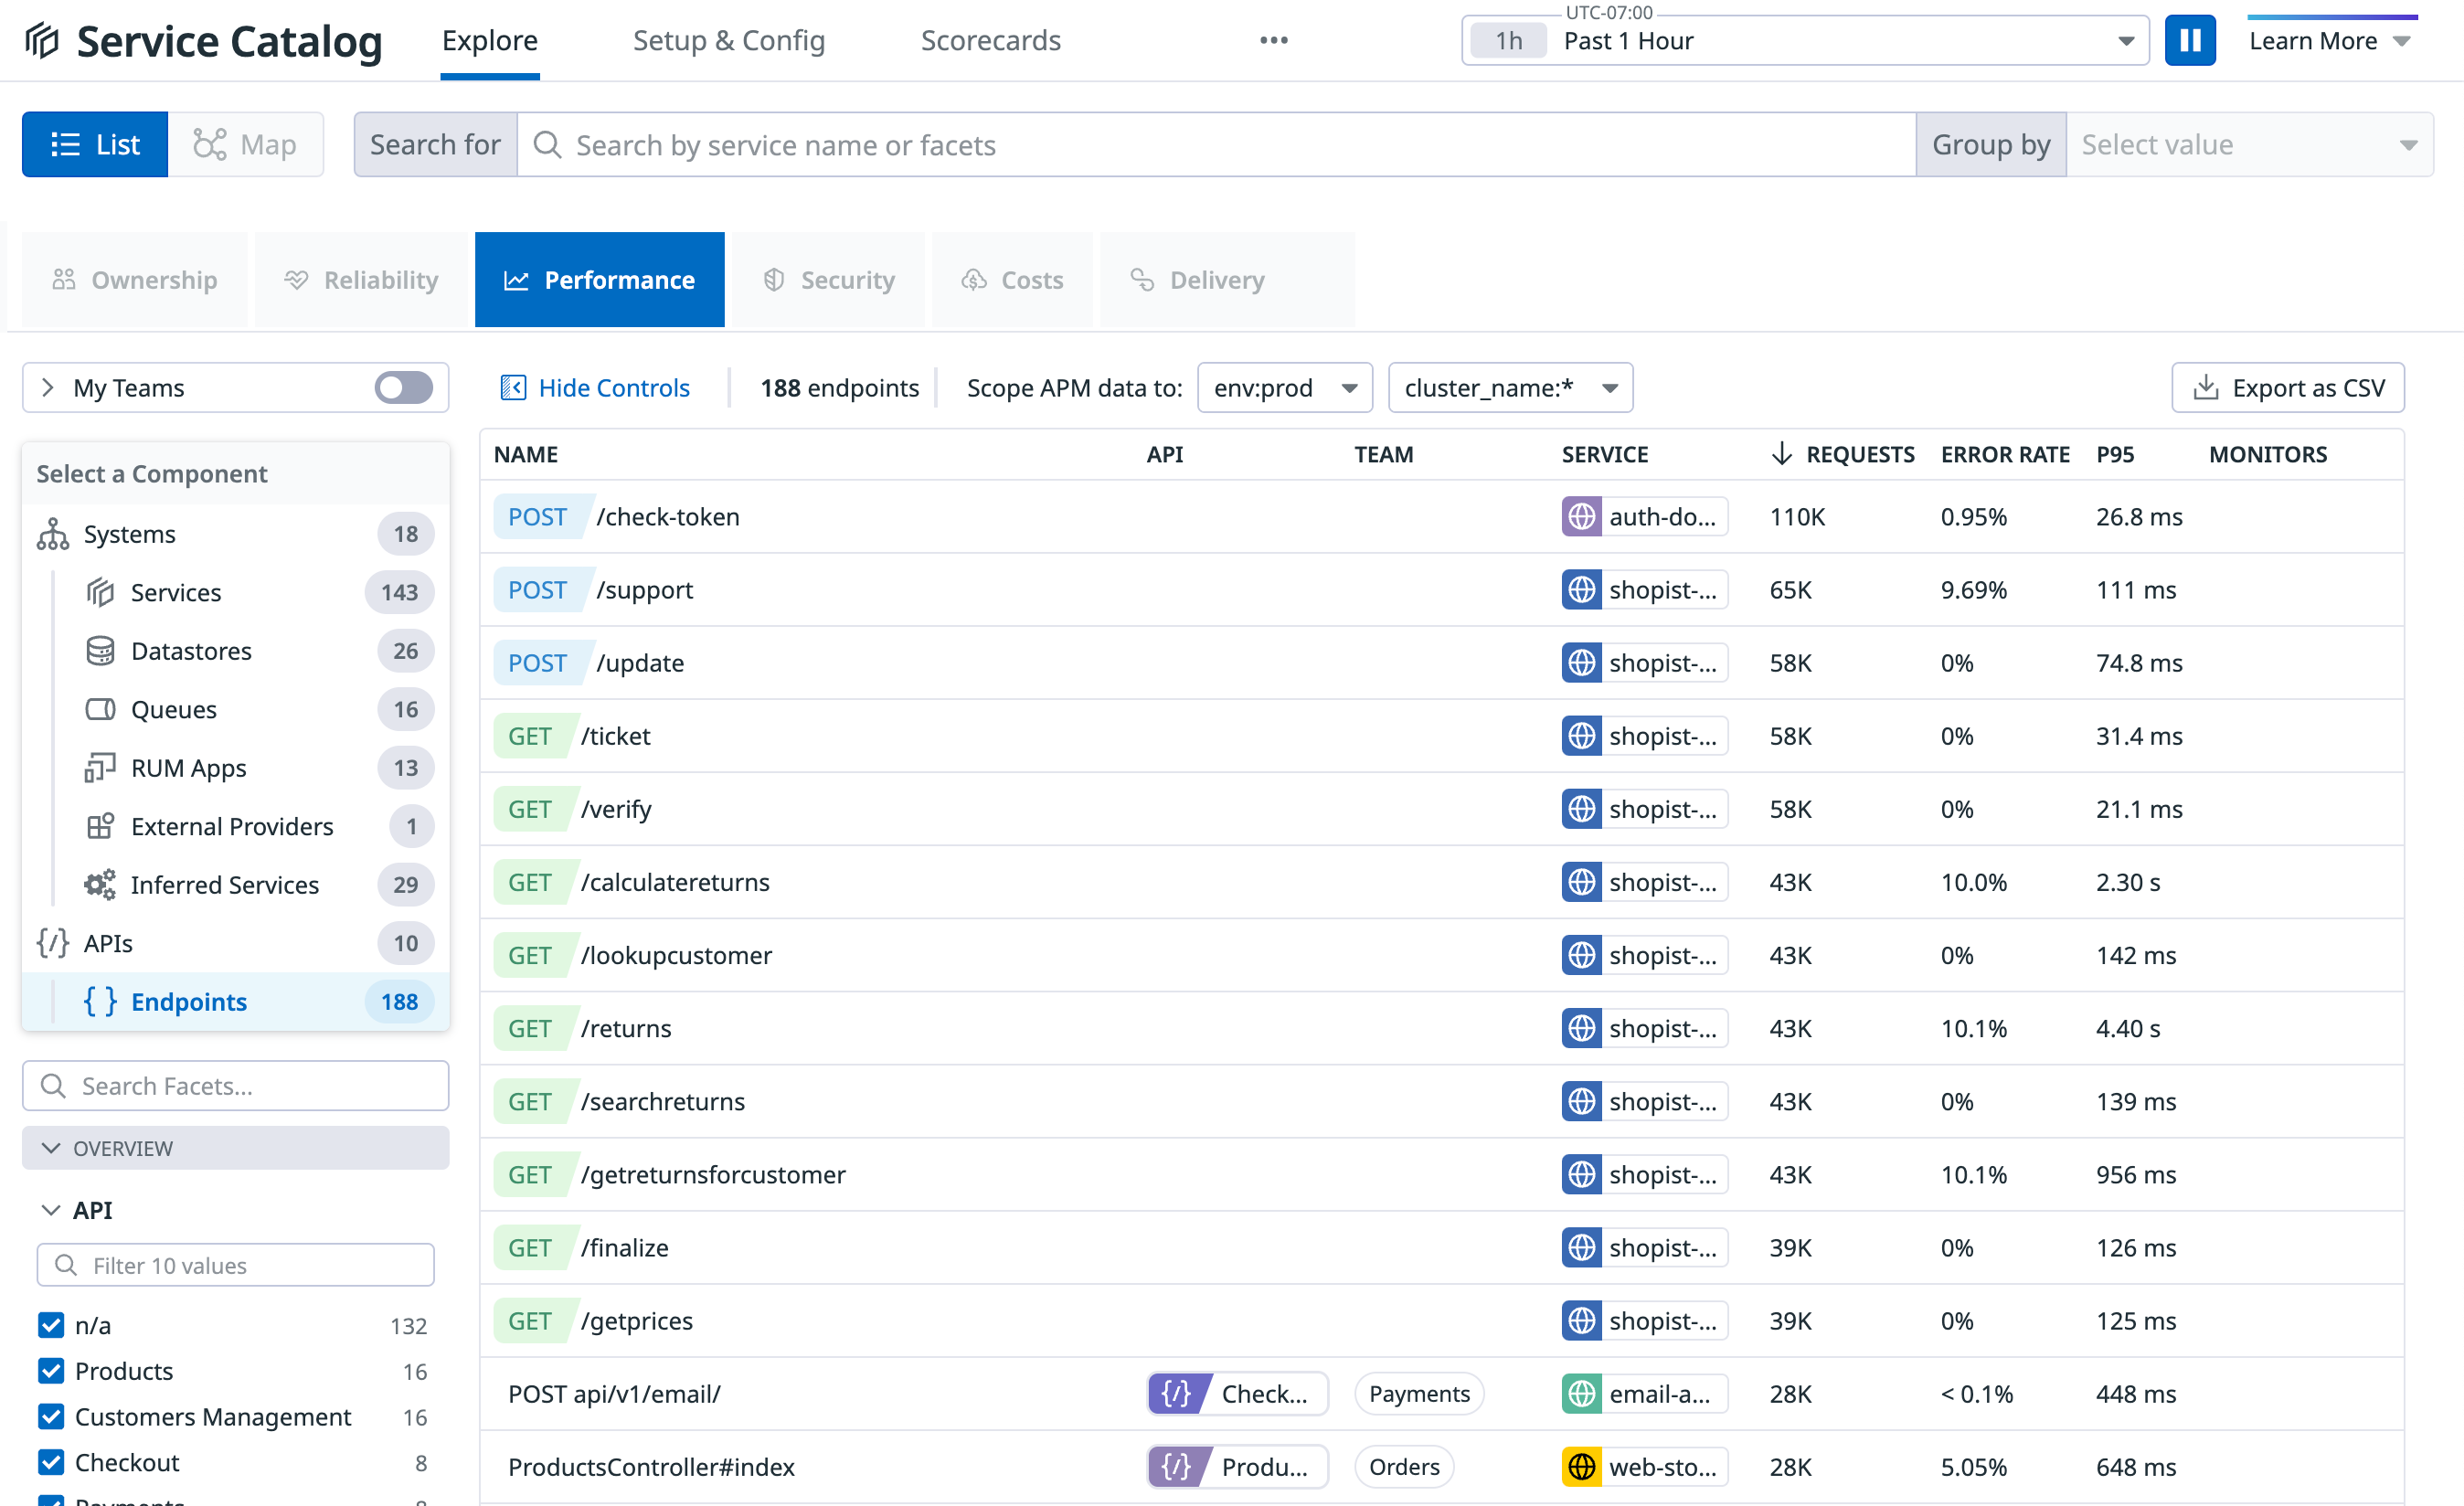
The Endpoints list provides visibility into all HTTP endpoints across your Datadog organization’s environments. Each endpoint displays its HTTP method (for example, GET), URL path (for example, /payment/{shop_id}/purchase), and associated service name (for example, Payments).
The Endpoints list only supports HTTP endpoints.
Exploring endpoint performance
The Endpoints list shows performance data scoped to your selected environment and time frame:
- Column sorting: Click column headers to sort by metrics. For example, click P95 to see endpoints with the top 95th percentile for latency.
- Ownership tracking: View team ownership in the TEAM column. This information is inherited from the associated service definition in the Service Catalog. The service owner owns all of the endpoints connected to the service.
- Filtering and searching: Search by service, path, or any primary tag, or filter using facets like Service and Team.
- Scoping: Specify the environment, additional primary tags (for example,
cluster_name), and time frame.
Viewing endpoint details
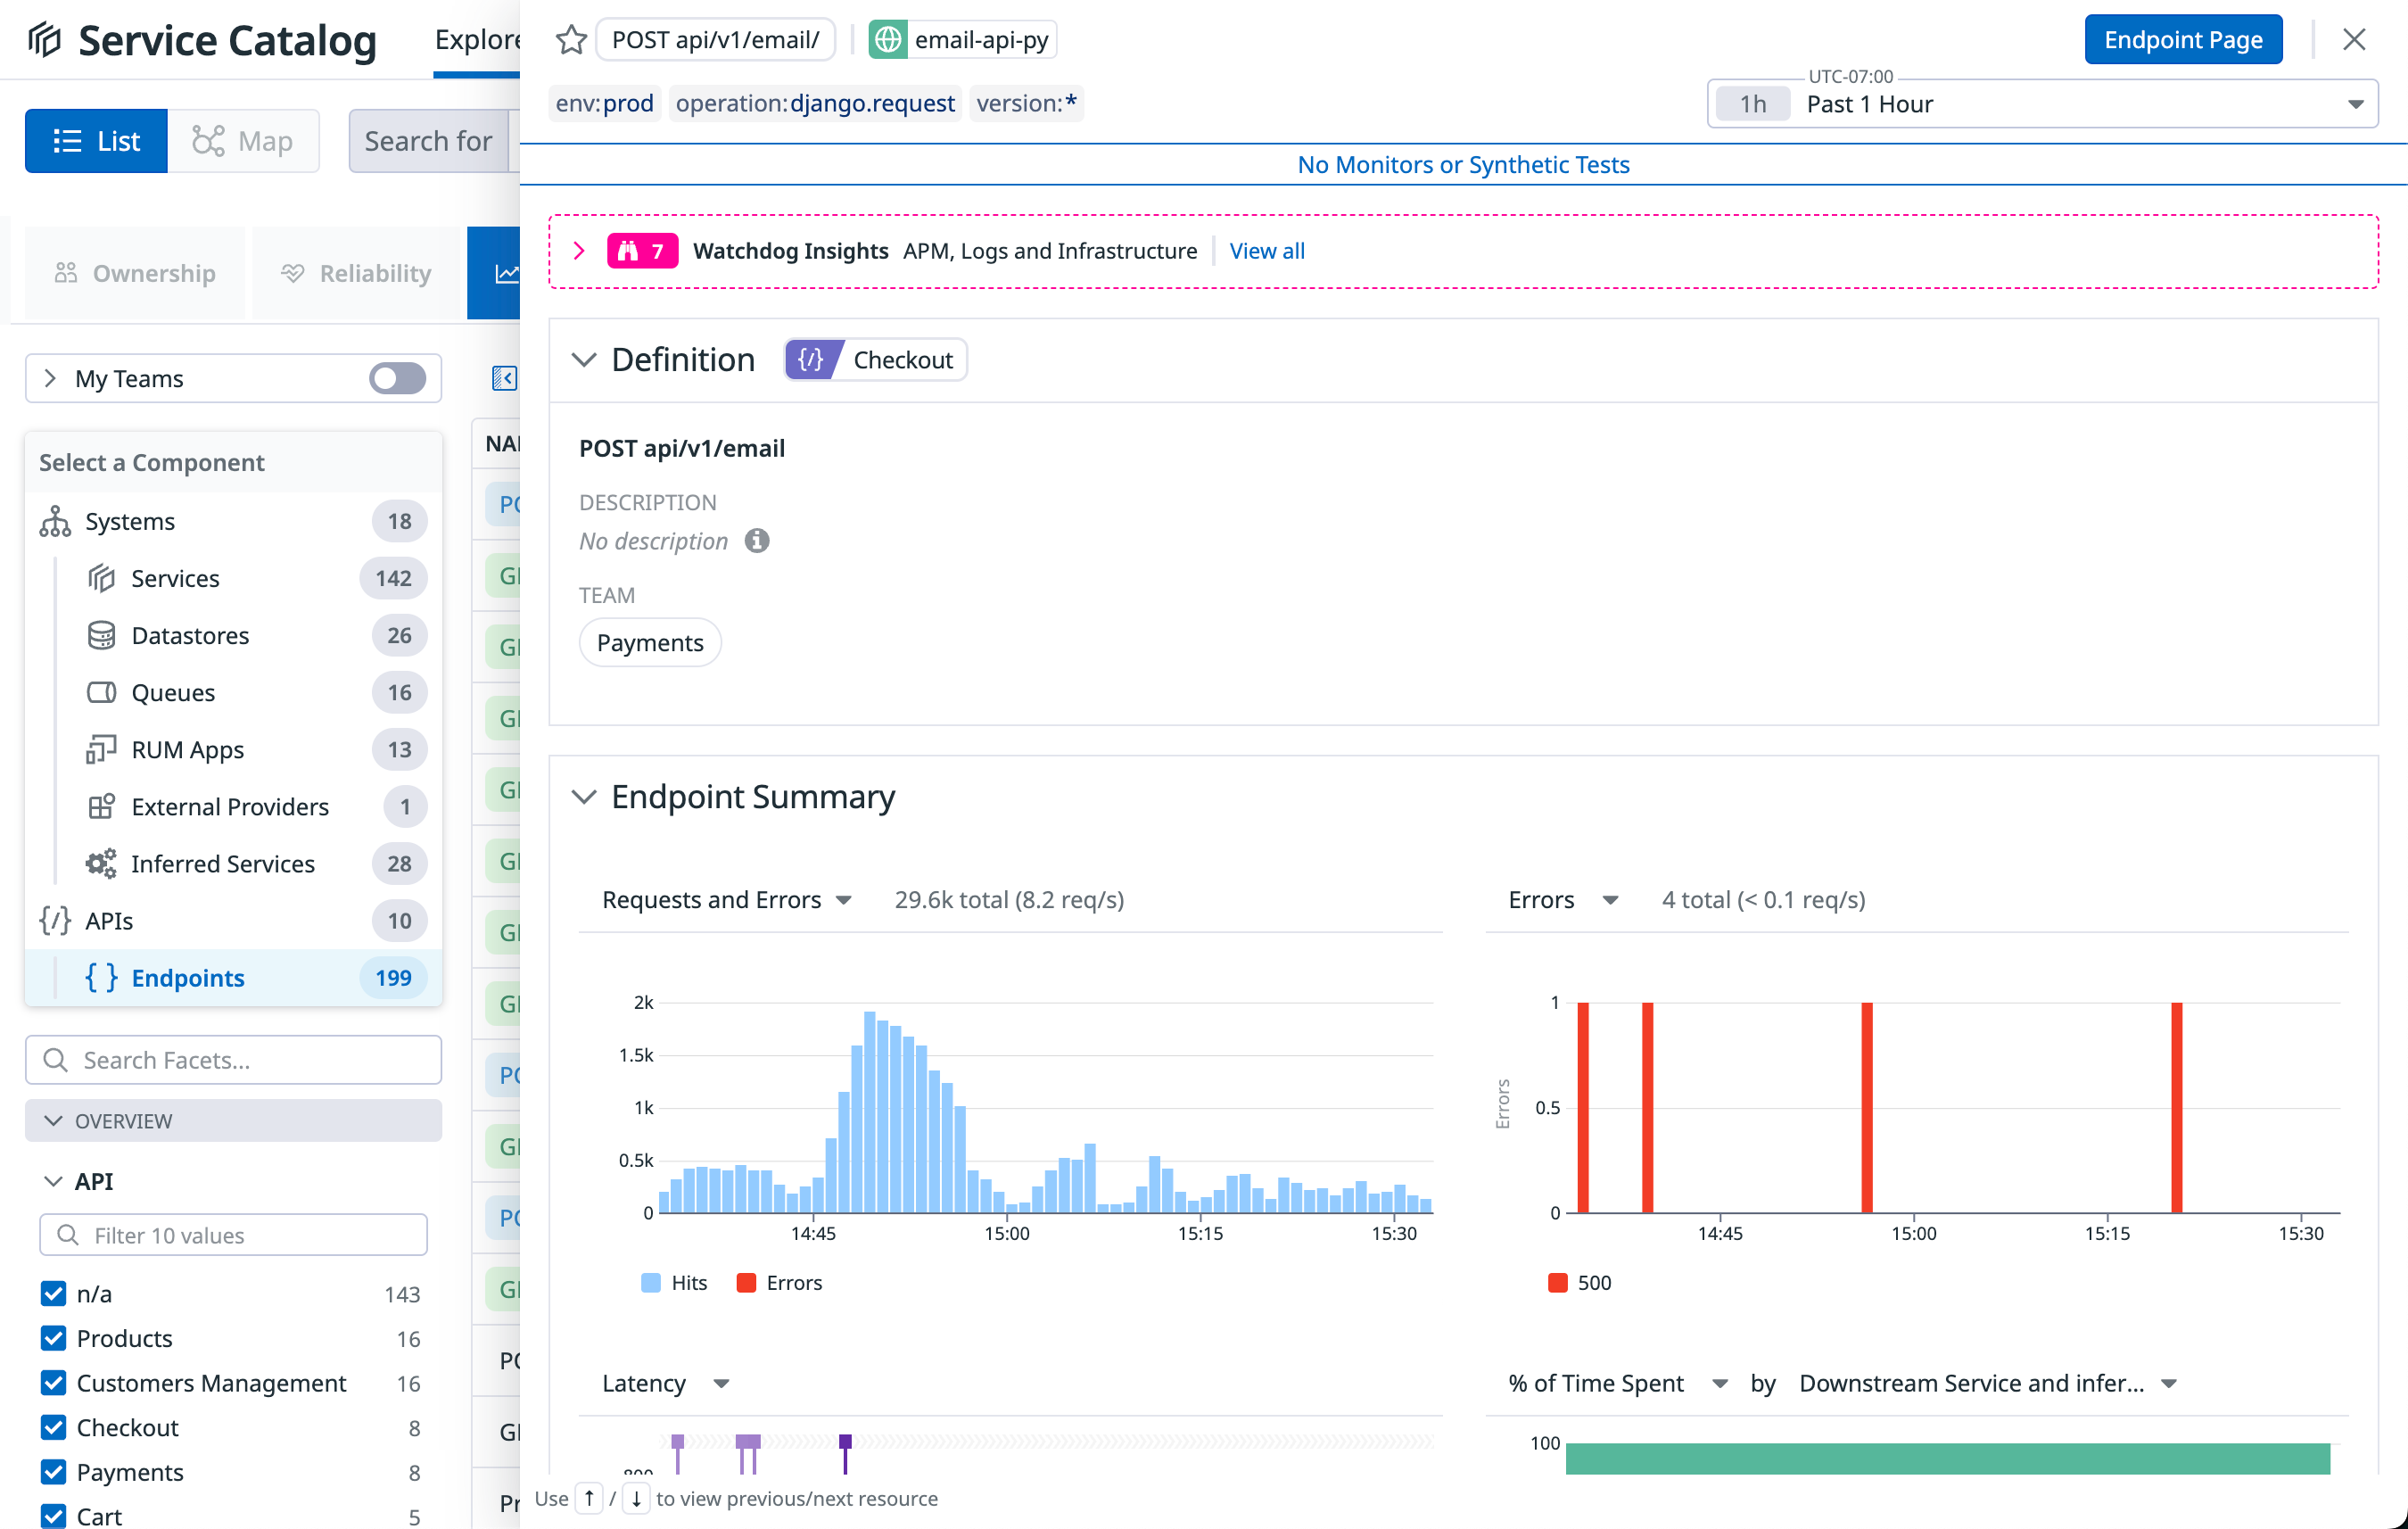
Use the endpoint details page to detect underperforming APIs and identify opportunities for optimization.
To access the endpoint details page:
- Use the filtering, sorting, and searching options in the Endpoints list to find endpoints of interest.
- Click an endpoint to view its details page.
The endpoint details page shows you metadata, performance metrics, errors, dependencies, and correlated telemetry from other areas of Datadog.
Further reading
Documentation, liens et articles supplémentaires utiles:


