Instrument AWS Lambda applications
Cette page n'est pas encore disponible en français, sa traduction est en cours.
Si vous avez des questions ou des retours sur notre projet de traduction actuel,
n'hésitez pas à nous contacter.
Overview
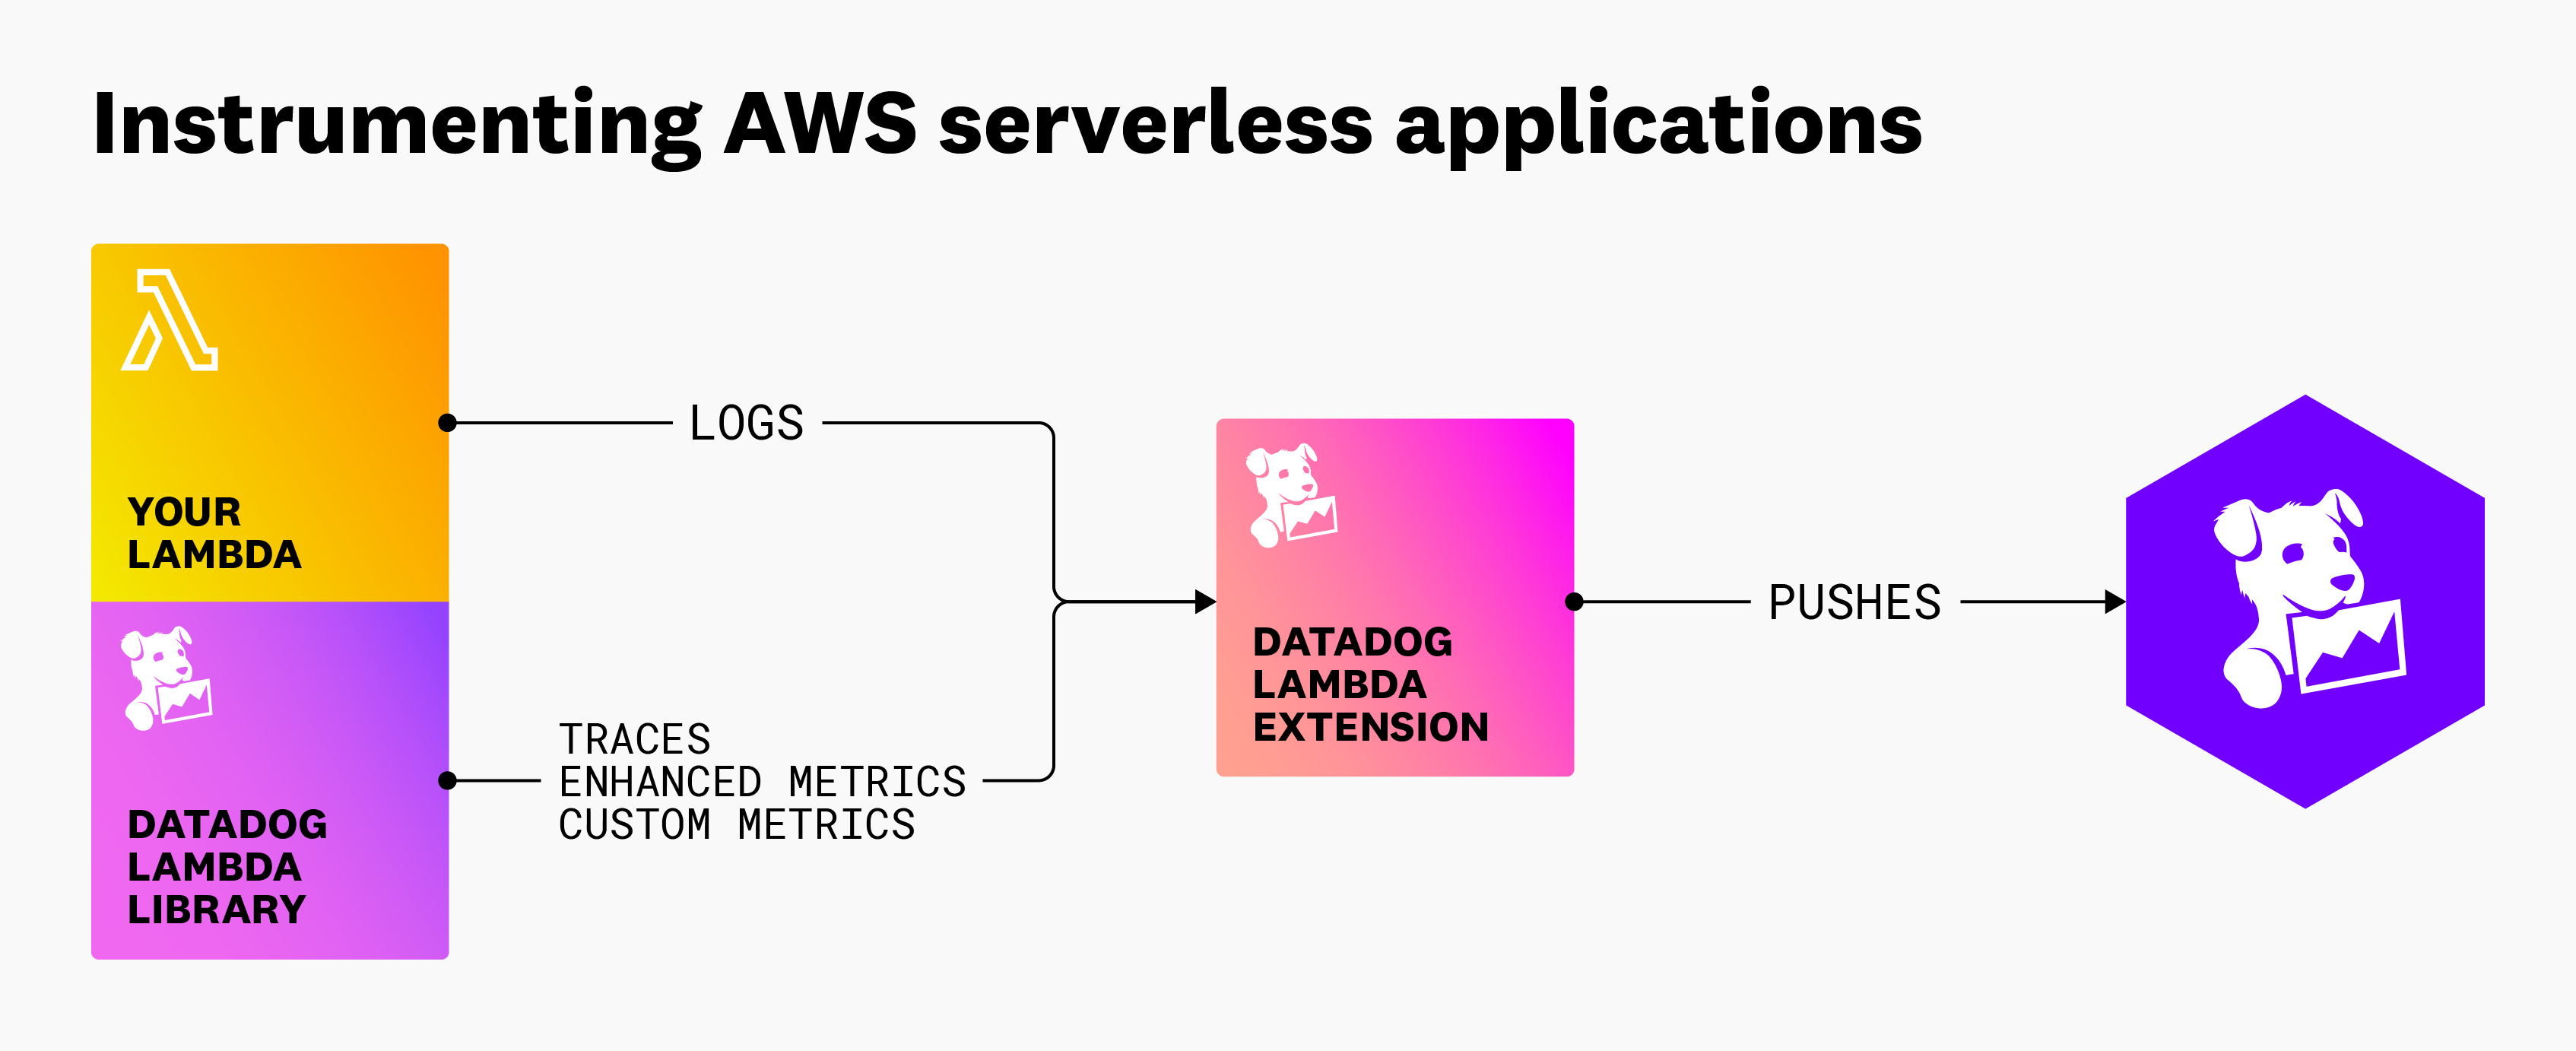
Instrument your AWS Lambda applications with a Datadog Lambda Extension to collect traces, enhanced metrics, and custom metrics. The Datadog Lambda Extension is analogous to using the Datadog Agent and Datadog tracing libraries for host-based infrastructure and applications.
Quick start
Agentically add the Datadog to your Lambda Functions.
Agentic onboarding for Datadog Serverless is in Preview. Use your favorite AI coding tool such as Cursor or Claude to bulk-add Datadog monitoring to your Lambda functions.
Request AccessTo get started, sign up for a Datadog account if you don’t already have one. Then, follow the in-app installation flow in Fleet Automation for AWS Lambda to instrument your Lambda functions. This quick-start configuration enables your functions to send real-time metrics, logs, and traces to Datadog.
A sample application is available on GitHub with instructions on how to deploy with multiple runtimes and infrastructure-as-code tools.
The quick start process configures your Lambda functions on the fly. To instrument Lambda functions permanently, see the detailed instructions in the next section.
Instrumentation instructions
Advanced configurations
After you’re done with instrumentation and you’ve set up telemetry collection, you can use Configure Serverless Monitoring for AWS Lambda to:
- connect your metrics, traces, and logs using tags
- collect telemetry from AWS resources such as API Gateway, AppSync, and Step Functions
- capture the request and response payloads for individual Lambda invocations
- link errors of your Lambda functions to your source code
- filter or scrub sensitive information from logs or traces
Further Reading
Documentation, liens et articles supplémentaires utiles: