- Principales informations
- Getting Started
- Agent
- API
- Tracing
- Conteneurs
- Dashboards
- Database Monitoring
- Datadog
- Site Datadog
- DevSecOps
- Incident Management
- Intégrations
- Internal Developer Portal
- Logs
- Monitors
- OpenTelemetry
- Profileur
- Session Replay
- Security
- Serverless for AWS Lambda
- Software Delivery
- Surveillance Synthetic
- Tags
- Workflow Automation
- Learning Center
- Support
- Glossary
- Standard Attributes
- Guides
- Agent
- Intégrations
- Développeurs
- OpenTelemetry
- Administrator's Guide
- API
- Partners
- Application mobile
- DDSQL Reference
- CoScreen
- CoTerm
- Remote Configuration
- Cloudcraft
- In The App
- Dashboards
- Notebooks
- DDSQL Editor
- Reference Tables
- Sheets
- Alertes
- Watchdog
- Métriques
- Bits AI
- Internal Developer Portal
- Error Tracking
- Change Tracking
- Service Management
- Actions & Remediations
- Infrastructure
- Cloudcraft
- Resource Catalog
- Universal Service Monitoring
- Hosts
- Conteneurs
- Processes
- Sans serveur
- Surveillance réseau
- Cloud Cost
- Application Performance
- APM
- Termes et concepts de l'APM
- Sending Traces to Datadog
- APM Metrics Collection
- Trace Pipeline Configuration
- Connect Traces with Other Telemetry
- Trace Explorer
- Recommendations
- Code Origin for Spans
- Observabilité des services
- Endpoint Observability
- Dynamic Instrumentation
- Live Debugger
- Suivi des erreurs
- Sécurité des données
- Guides
- Dépannage
- Profileur en continu
- Database Monitoring
- Agent Integration Overhead
- Setup Architectures
- Configuration de Postgres
- Configuration de MySQL
- Configuration de SQL Server
- Setting Up Oracle
- Setting Up Amazon DocumentDB
- Setting Up MongoDB
- Connecting DBM and Traces
- Données collectées
- Exploring Database Hosts
- Explorer les métriques de requête
- Explorer des échantillons de requêtes
- Exploring Database Schemas
- Exploring Recommendations
- Dépannage
- Guides
- Data Streams Monitoring
- Data Jobs Monitoring
- Data Observability
- Digital Experience
- RUM et Session Replay
- Surveillance Synthetic
- Continuous Testing
- Product Analytics
- Software Delivery
- CI Visibility
- CD Visibility
- Deployment Gates
- Test Visibility
- Code Coverage
- Quality Gates
- DORA Metrics
- Feature Flags
- Securité
- Security Overview
- Cloud SIEM
- Code Security
- Cloud Security Management
- Application Security Management
- Workload Protection
- Sensitive Data Scanner
- AI Observability
- Log Management
- Pipelines d'observabilité
- Log Management
- CloudPrem
- Administration
Enabling the Full-Host Profiler
Cette page n'est pas encore disponible en français, sa traduction est en cours.
Si vous avez des questions ou des retours sur notre projet de traduction actuel, n'hésitez pas à nous contacter.
Si vous avez des questions ou des retours sur notre projet de traduction actuel, n'hésitez pas à nous contacter.
The Full-Host Profiler is an eBPF-based profiling solution built on OpenTelemetry that sends profiling data to Datadog using the Datadog Agent. It supports symbolication for compiled languages and is optimized for containerized environments such as Docker and Kubernetes.
Use cases
The Full-Host Profiler is particularly valuable for:
- Profiling open source software components that aren’t instrumented with Datadog’s tracing libraries.
- Analyzing performance across multi-language processes and runtimes.
Requirements
- Supported operating systems
- Linux (5.4+ for amd64, 5.5+ for arm64)
- Supported architecture
amd64orarm64processors- Serverless
full-hostis not supported on serverless platforms, such as AWS Lambda.- Debugging information
- Symbols should be available locally or can be uploaded in CI with
datadog-ci
Installation
Always set DD_SERVICE for each service you want to profile and identify separately. This ensures accurate attribution and more actionable profiling data. To learn more, see Service naming.
The Full-Host Profiler is distributed as a standalone executable.
Container environments
For hosts running containerized workloads, Datadog recommends running the profiler inside a container:
- Kubernetes: Follow the running in Kubernetes instructions.
- Docker: Follow the running in Docker instructions.
- Container image: Available from the container registry.
Non-container environments
For hosts without container runtimes, follow the instructions for running directly on the host.
Service naming
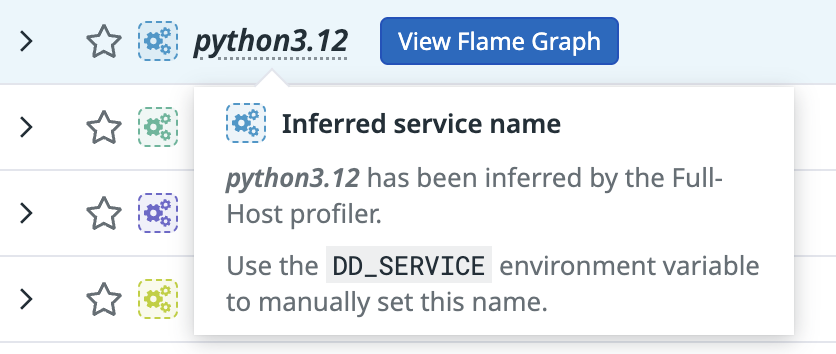
When using full-host profiling, Datadog profiles all processes on the host. Each process’s service name is derived from its DD_SERVICE environment variable.
If DD_SERVICE is set, the profiler uses the value of DD_SERVICE as the service name. This is the recommended and most reliable approach.
If DD_SERVICE is not set, Datadog infers a service name from the binary name. For interpreted languages, this is the name of the interpreter. For example, for a service written in Java, the full-host profiler sets the service name to service:java.
If multiple services are running under the same interpreter (for example, two separate Java applications on the same host), and neither sets DD_SERVICE, Datadog groups them together under the same service name. Datadog cannot distinguish between them unless you provide a unique service name.
Debug symbols
For compiled languages (such as Rust, C, C++, Go, etc.), the profiler uploads local symbols to Datadog for symbolication, ensuring that function names are available in profiles. For Rust, C, and C++, symbols need to be available locally (unstripped binaries).
For binaries stripped of debug symbols, it’s possible to upload symbols manually or in the CI:
- Install the datadog-ci command line tool.
- Provide a Datadog API key through the
DD_API_KEYenvironment variable. - Set the
DD_SITEenvironment variable to your Datadog site. - Install the
binutilspackage, which provides theobjcopyCLI tool. - Run:
DD_BETA_COMMANDS_ENABLED=1 datadog-ci elf-symbols upload ~/your/build/symbols/
What’s next?
After installing the Full-Host Profiler, see the Getting Started with Profiler to learn how to use Continuous Profiler to identify and fix performance problems.
Further reading
Documentation, liens et articles supplémentaires utiles:

