- Principales informations
- Getting Started
- Agent
- API
- Tracing
- Conteneurs
- Dashboards
- Database Monitoring
- Datadog
- Site Datadog
- DevSecOps
- Incident Management
- Intégrations
- Internal Developer Portal
- Logs
- Monitors
- OpenTelemetry
- Profileur
- Session Replay
- Security
- Serverless for AWS Lambda
- Software Delivery
- Surveillance Synthetic
- Tags
- Workflow Automation
- Learning Center
- Support
- Glossary
- Standard Attributes
- Guides
- Agent
- Intégrations
- Développeurs
- OpenTelemetry
- Administrator's Guide
- API
- Partners
- Application mobile
- DDSQL Reference
- CoScreen
- CoTerm
- Remote Configuration
- Cloudcraft
- In The App
- Dashboards
- Notebooks
- DDSQL Editor
- Reference Tables
- Sheets
- Alertes
- Watchdog
- Métriques
- Bits AI
- Internal Developer Portal
- Error Tracking
- Change Tracking
- Service Management
- Actions & Remediations
- Infrastructure
- Cloudcraft
- Resource Catalog
- Universal Service Monitoring
- Hosts
- Conteneurs
- Processes
- Sans serveur
- Surveillance réseau
- Cloud Cost
- Application Performance
- APM
- Termes et concepts de l'APM
- Sending Traces to Datadog
- APM Metrics Collection
- Trace Pipeline Configuration
- Connect Traces with Other Telemetry
- Trace Explorer
- Recommendations
- Code Origin for Spans
- Observabilité des services
- Endpoint Observability
- Dynamic Instrumentation
- Live Debugger
- Suivi des erreurs
- Sécurité des données
- Guides
- Dépannage
- Profileur en continu
- Database Monitoring
- Agent Integration Overhead
- Setup Architectures
- Configuration de Postgres
- Configuration de MySQL
- Configuration de SQL Server
- Setting Up Oracle
- Setting Up Amazon DocumentDB
- Setting Up MongoDB
- Connecting DBM and Traces
- Données collectées
- Exploring Database Hosts
- Explorer les métriques de requête
- Explorer des échantillons de requêtes
- Exploring Database Schemas
- Exploring Recommendations
- Dépannage
- Guides
- Data Streams Monitoring
- Data Jobs Monitoring
- Data Observability
- Digital Experience
- RUM et Session Replay
- Surveillance Synthetic
- Continuous Testing
- Product Analytics
- Software Delivery
- CI Visibility
- CD Visibility
- Deployment Gates
- Test Visibility
- Code Coverage
- Quality Gates
- DORA Metrics
- Feature Flags
- Securité
- Security Overview
- Cloud SIEM
- Code Security
- Cloud Security Management
- Application Security Management
- Workload Protection
- Sensitive Data Scanner
- AI Observability
- Log Management
- Pipelines d'observabilité
- Log Management
- CloudPrem
- Administration
Processors
Ce produit n'est pas pris en charge par le site Datadog que vous avez sélectionné. ().
Cette page n'est pas encore disponible en français, sa traduction est en cours.
Si vous avez des questions ou des retours sur notre projet de traduction actuel, n'hésitez pas à nous contacter.
Si vous avez des questions ou des retours sur notre projet de traduction actuel, n'hésitez pas à nous contacter.
Overview
The processors outlined in this documentation are specific to on-premises logging environments. To parse, structure, and enrich cloud-based logs, see the Log Management documentation.
Use Observability Pipelines’ processors to parse, structure, and enrich your logs and metrics (PREVIEW indicates an early access version of a major product or feature that you can opt into before its official release.Glossary). When you create a pipeline in the UI, pre-selected processors are added to your processor group based on the selected template. You can add additional processors and delete any existing ones based on your processing needs.
Processor groups are executed from top to bottom. The order of the processors is important because events are checked by each processor, but only events that match the processor’s filters are processed. To modify the order of the processors, use the drag handle on the top left corner of the processor you want to move.
Note: For a pipeline canvas, there is a limit of 25 processors groups and a total of 150 processors.
Select a processor in the left navigation menu to see more information about it.
Processors
These are the available processors:
- Add Environment Variables Processor
- Add Hostname Processor
- Custom Processor
- Deduplicate Processor
- Edit Fields Processor
- Enrichment Table Processor
- Filter Processor
- Generate Metrics Processor
- Grok Parser Processor
- Parse JSON Processor
- Parse XML Processor
- Quota Processor
- Reduce Processor
- Remap to OCSF Processor
- Sample Processor
- Sensitive Data Scanner Processor
- Split Array
- Tags
- Throttle
Processor groups
Configuring a pipeline with processor groups is only available for Worker versions 2.7 and later.
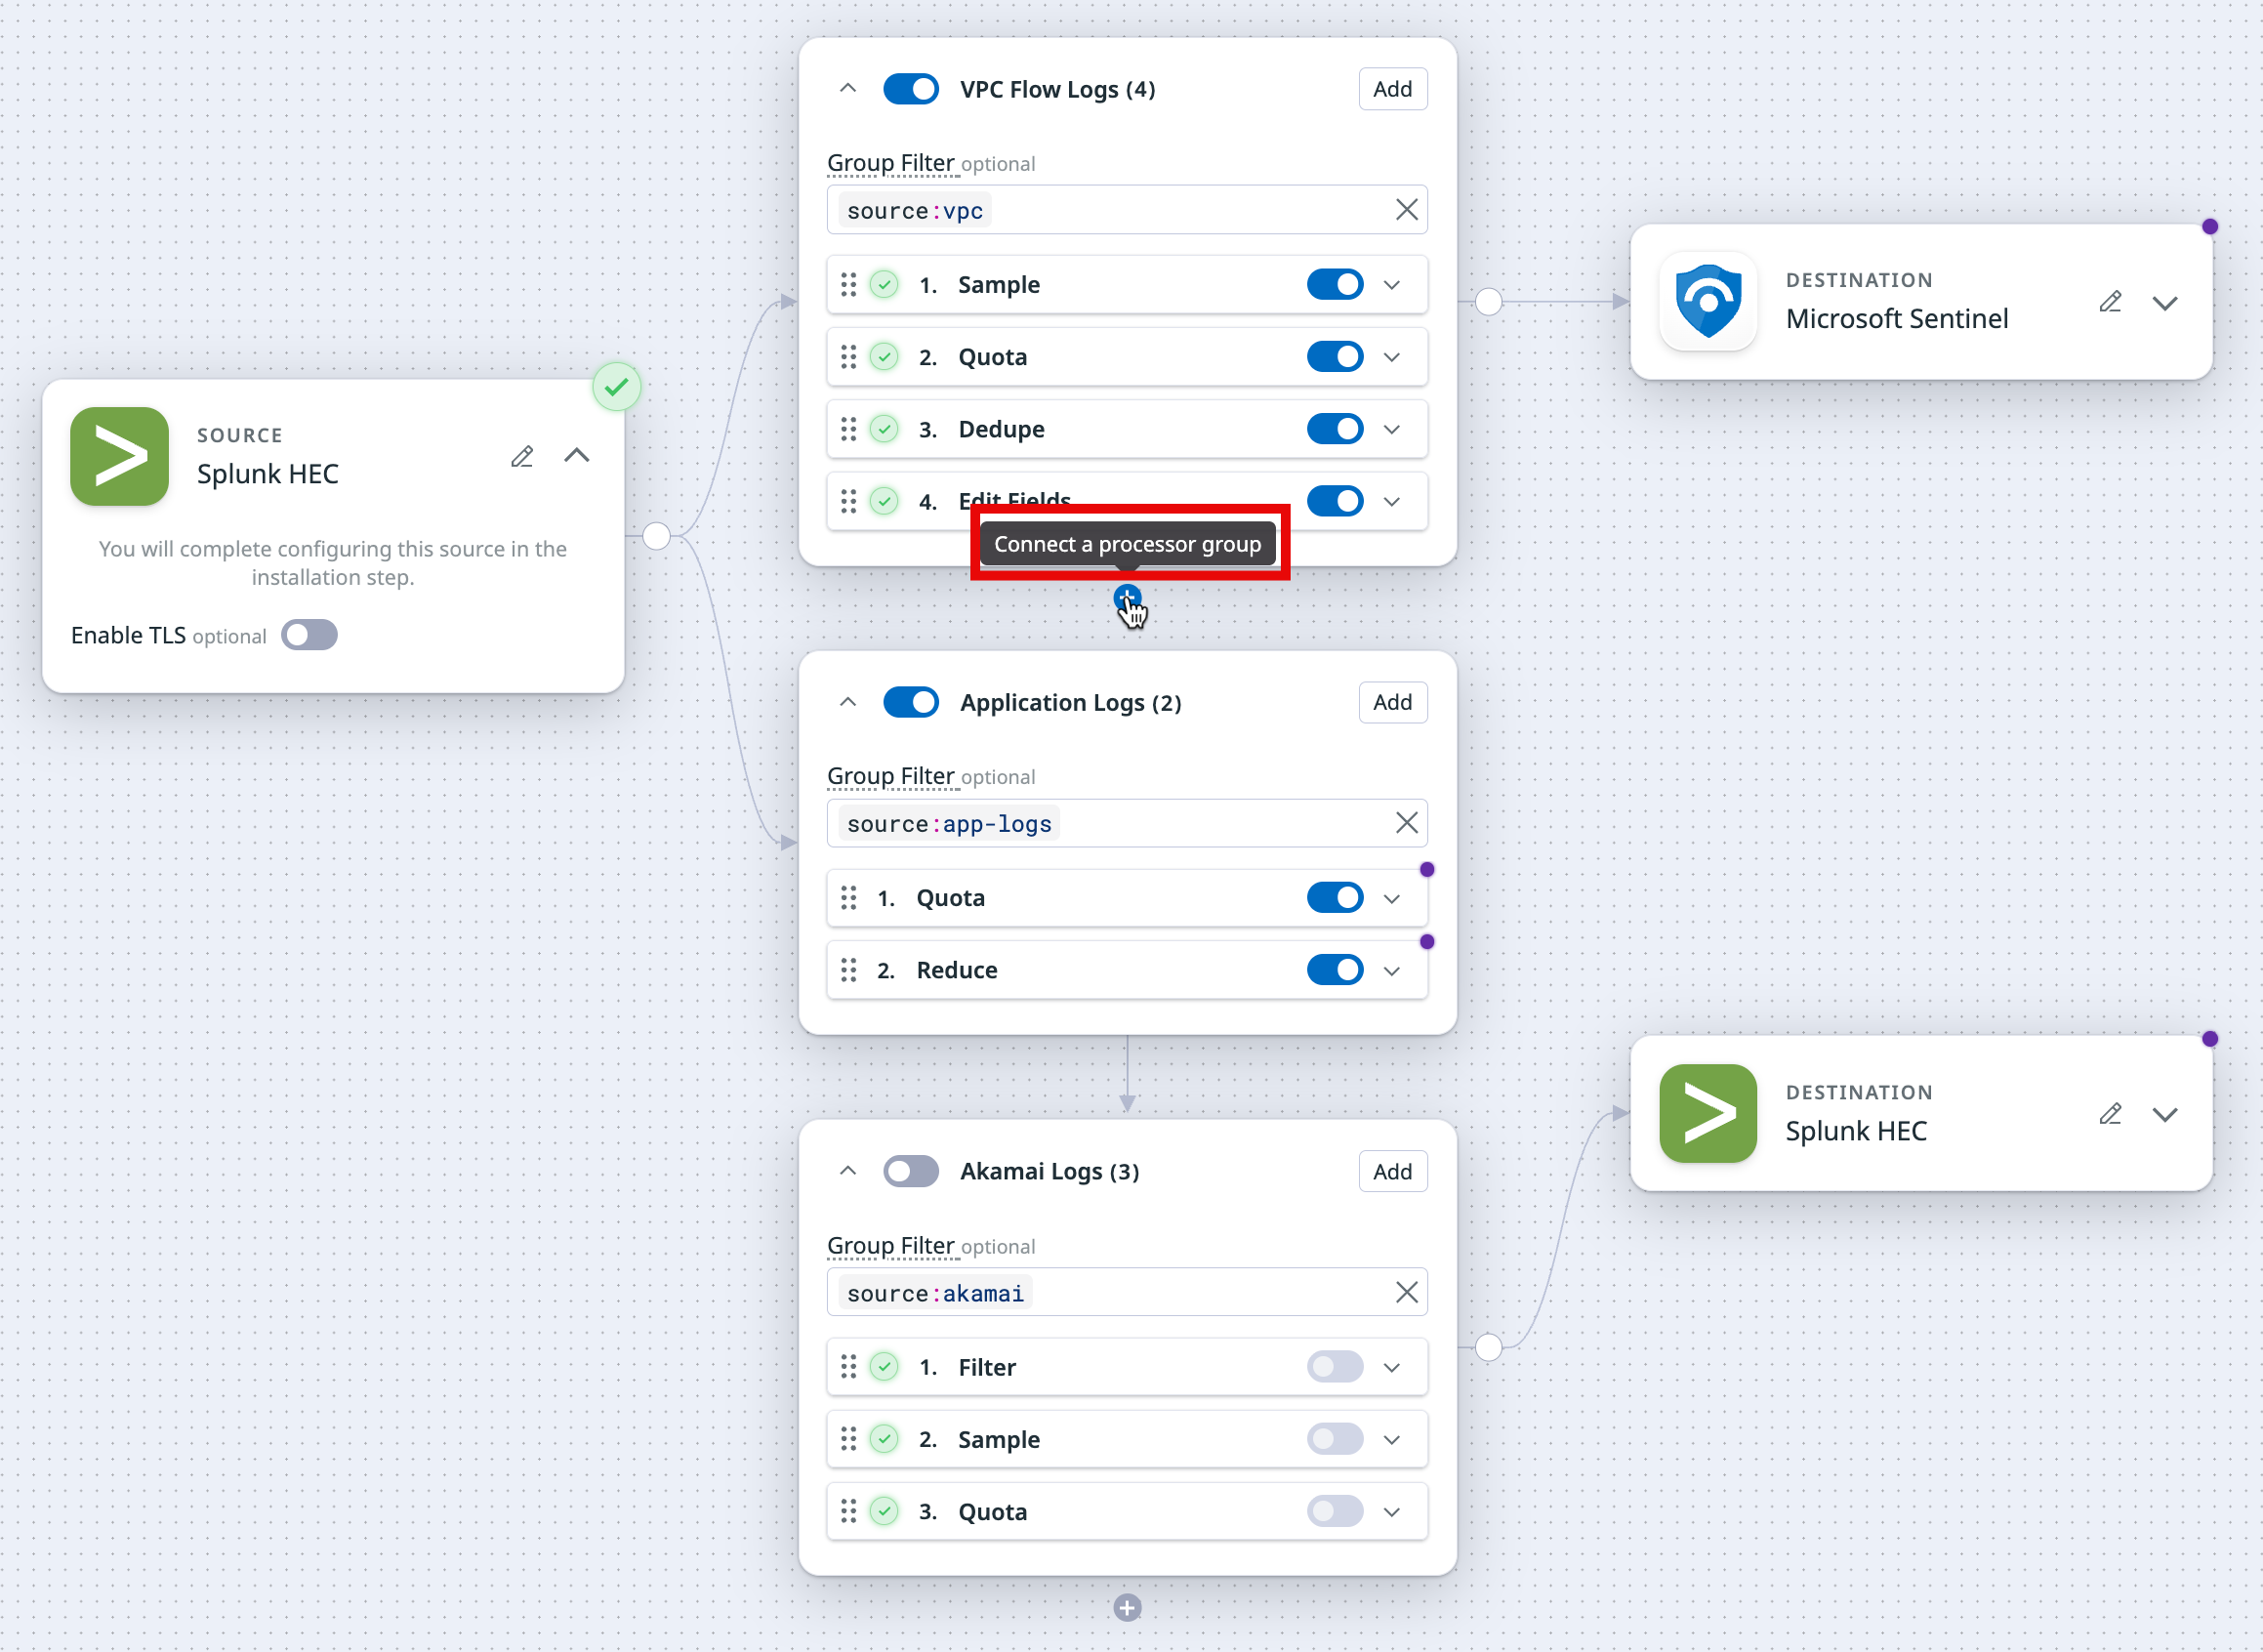
You can organize your processors into logical groups to help you manage them. Each processor group has a Group Filter so that those processors are only applied to specific events. For example, if you want the group processors to only process events coming from vpc, then use the group filter source:vpc. You can also add filters for each individual processor.
Processor groups and the processors within each group are executed from top to bottom. The order of the processors is important because events are checked by each processor, but only events that match the processor’s filters are processed. To change the order of the processors, use the drag handle on the top left corner of the processor you want to move.
Note: There is a limit of 25 processor groups per pipeline canvas. For example, in a dual-ship pipeline with two destinations, the combined number of processor groups across both destinations cannot exceed 25. You can have the groups in any combination, such as 15 on one destination and 10 on the other.
Further Reading
Documentation, liens et articles supplémentaires utiles:

