- Principales informations
- Getting Started
- Agent
- API
- Tracing
- Conteneurs
- Dashboards
- Database Monitoring
- Datadog
- Site Datadog
- DevSecOps
- Incident Management
- Intégrations
- Internal Developer Portal
- Logs
- Monitors
- OpenTelemetry
- Profileur
- Session Replay
- Security
- Serverless for AWS Lambda
- Software Delivery
- Surveillance Synthetic
- Tags
- Workflow Automation
- Learning Center
- Support
- Glossary
- Standard Attributes
- Guides
- Agent
- Intégrations
- Développeurs
- OpenTelemetry
- Administrator's Guide
- API
- Partners
- Application mobile
- DDSQL Reference
- CoScreen
- CoTerm
- Remote Configuration
- Cloudcraft
- In The App
- Dashboards
- Notebooks
- DDSQL Editor
- Reference Tables
- Sheets
- Alertes
- Watchdog
- Métriques
- Bits AI
- Internal Developer Portal
- Error Tracking
- Change Tracking
- Service Management
- Actions & Remediations
- Infrastructure
- Cloudcraft
- Resource Catalog
- Universal Service Monitoring
- Hosts
- Conteneurs
- Processes
- Sans serveur
- Surveillance réseau
- Cloud Cost
- Application Performance
- APM
- Termes et concepts de l'APM
- Sending Traces to Datadog
- APM Metrics Collection
- Trace Pipeline Configuration
- Connect Traces with Other Telemetry
- Trace Explorer
- Recommendations
- Code Origin for Spans
- Observabilité des services
- Endpoint Observability
- Dynamic Instrumentation
- Live Debugger
- Suivi des erreurs
- Sécurité des données
- Guides
- Dépannage
- Profileur en continu
- Database Monitoring
- Agent Integration Overhead
- Setup Architectures
- Configuration de Postgres
- Configuration de MySQL
- Configuration de SQL Server
- Setting Up Oracle
- Setting Up Amazon DocumentDB
- Setting Up MongoDB
- Connecting DBM and Traces
- Données collectées
- Exploring Database Hosts
- Explorer les métriques de requête
- Explorer des échantillons de requêtes
- Exploring Database Schemas
- Exploring Recommendations
- Dépannage
- Guides
- Data Streams Monitoring
- Data Jobs Monitoring
- Data Observability
- Digital Experience
- RUM et Session Replay
- Surveillance Synthetic
- Continuous Testing
- Product Analytics
- Software Delivery
- CI Visibility
- CD Visibility
- Deployment Gates
- Test Visibility
- Code Coverage
- Quality Gates
- DORA Metrics
- Feature Flags
- Securité
- Security Overview
- Cloud SIEM
- Code Security
- Cloud Security Management
- Application Security Management
- Workload Protection
- Sensitive Data Scanner
- AI Observability
- Log Management
- Pipelines d'observabilité
- Log Management
- CloudPrem
- Administration
(LEGACY) Observability Pipelines Documentation
Ce produit n'est pas pris en charge par le site Datadog que vous avez sélectionné. ().
Cette page n'est pas encore disponible en français, sa traduction est en cours.
Si vous avez des questions ou des retours sur notre projet de traduction actuel, n'hésitez pas à nous contacter.
Si vous avez des questions ou des retours sur notre projet de traduction actuel, n'hésitez pas à nous contacter.
If you upgrade your OP Workers version 1.8 or below to version 2.0 or above, your existing pipelines will break. Do not upgrade your OP Workers if you want to continue using OP Workers version 1.8 or below. If you want to use OP Worker 2.0 or above, you must migrate your OP Worker 1.8 or earlier pipelines to OP Worker 2.x.
Datadog recommends that you update to OP Worker versions 2.0 or above. Upgrading to a major OP Worker version and keeping it updated is the only supported way to get the latest OP Worker functionality, fixes, and security updates.
Datadog recommends that you update to OP Worker versions 2.0 or above. Upgrading to a major OP Worker version and keeping it updated is the only supported way to get the latest OP Worker functionality, fixes, and security updates.
The following documents are for the Observability Pipelines Worker 1.8 and older.
Deployment
Working with Data
Monitoring
Reference: Configurations
Guides
Architecture
Legacy Observability Pipelines
Overview
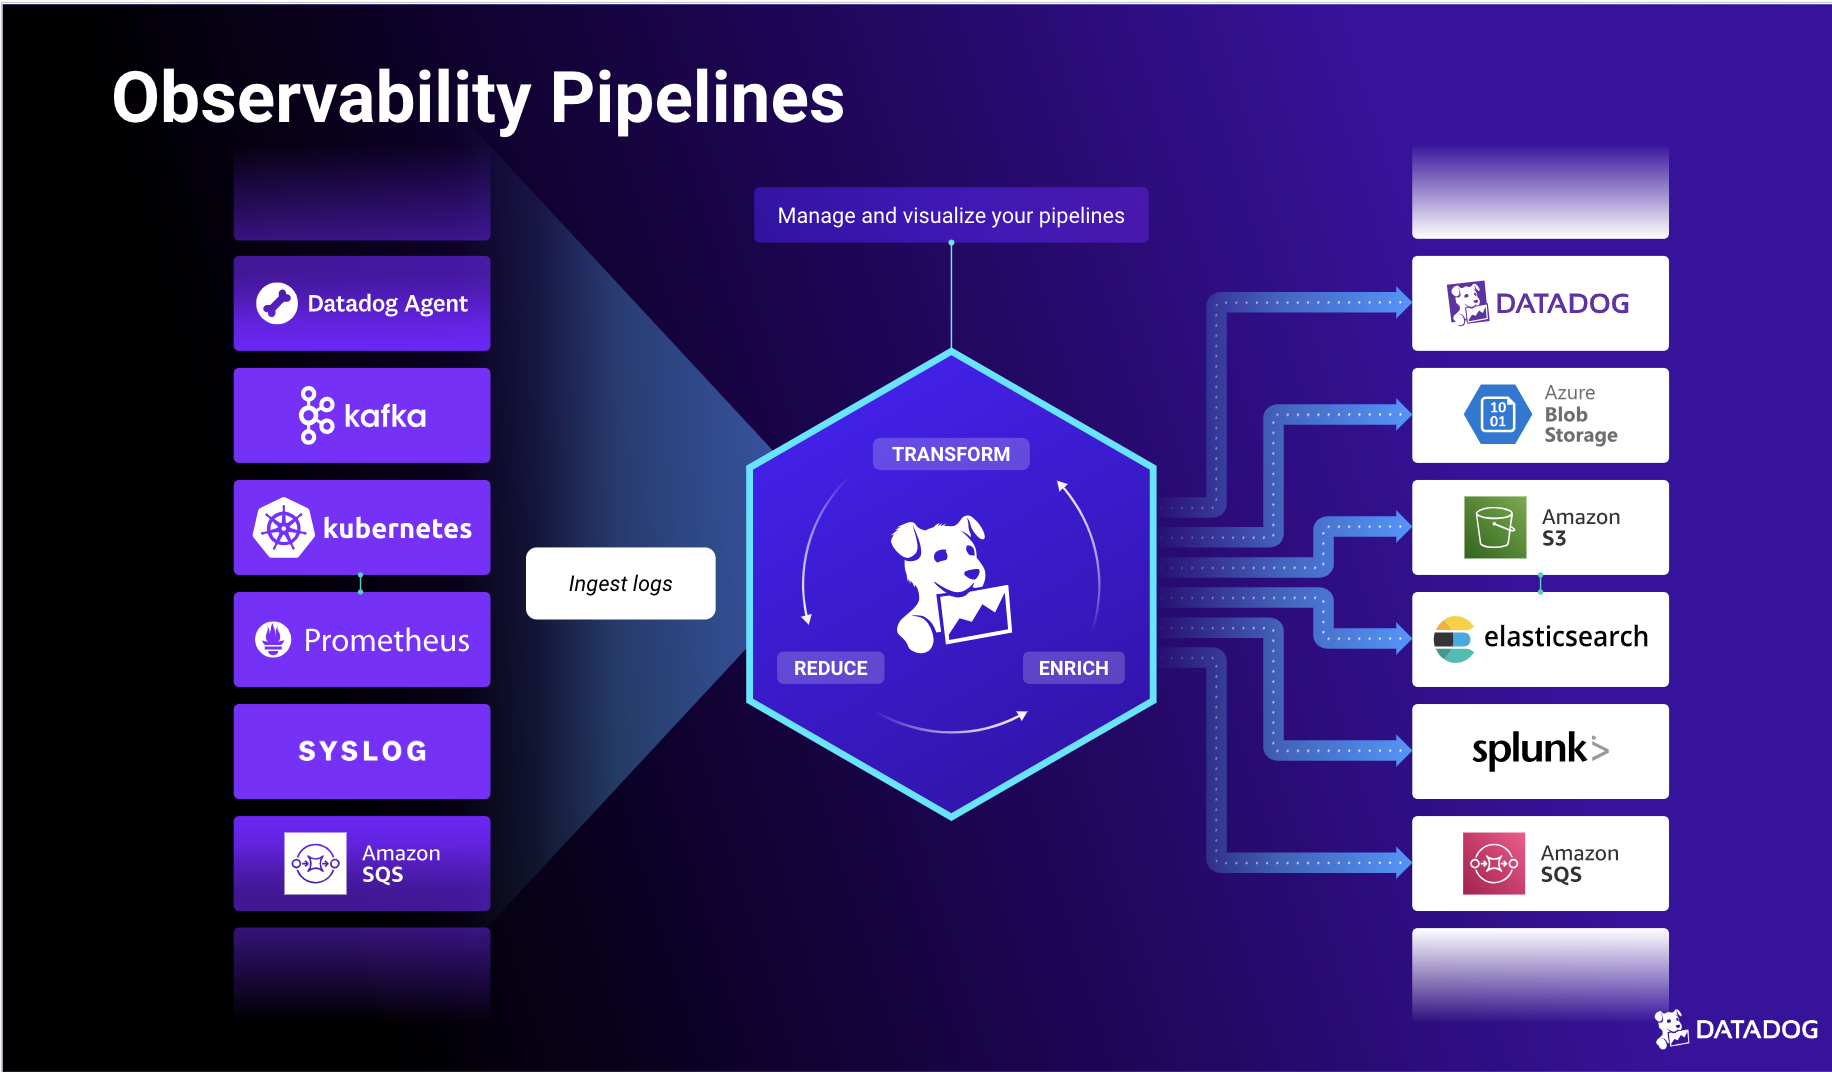
Observability Pipelines allow you to collect, process, and route logs from any source to any destination in infrastructure that you own or manage.
With Observability Pipelines, you can:
- Control your data volume before routing to manage costs.
- Route data anywhere to reduce vendor lock-in and simplify migrations.
- Transform logs by adding, parsing, enriching, and removing fields and tags.
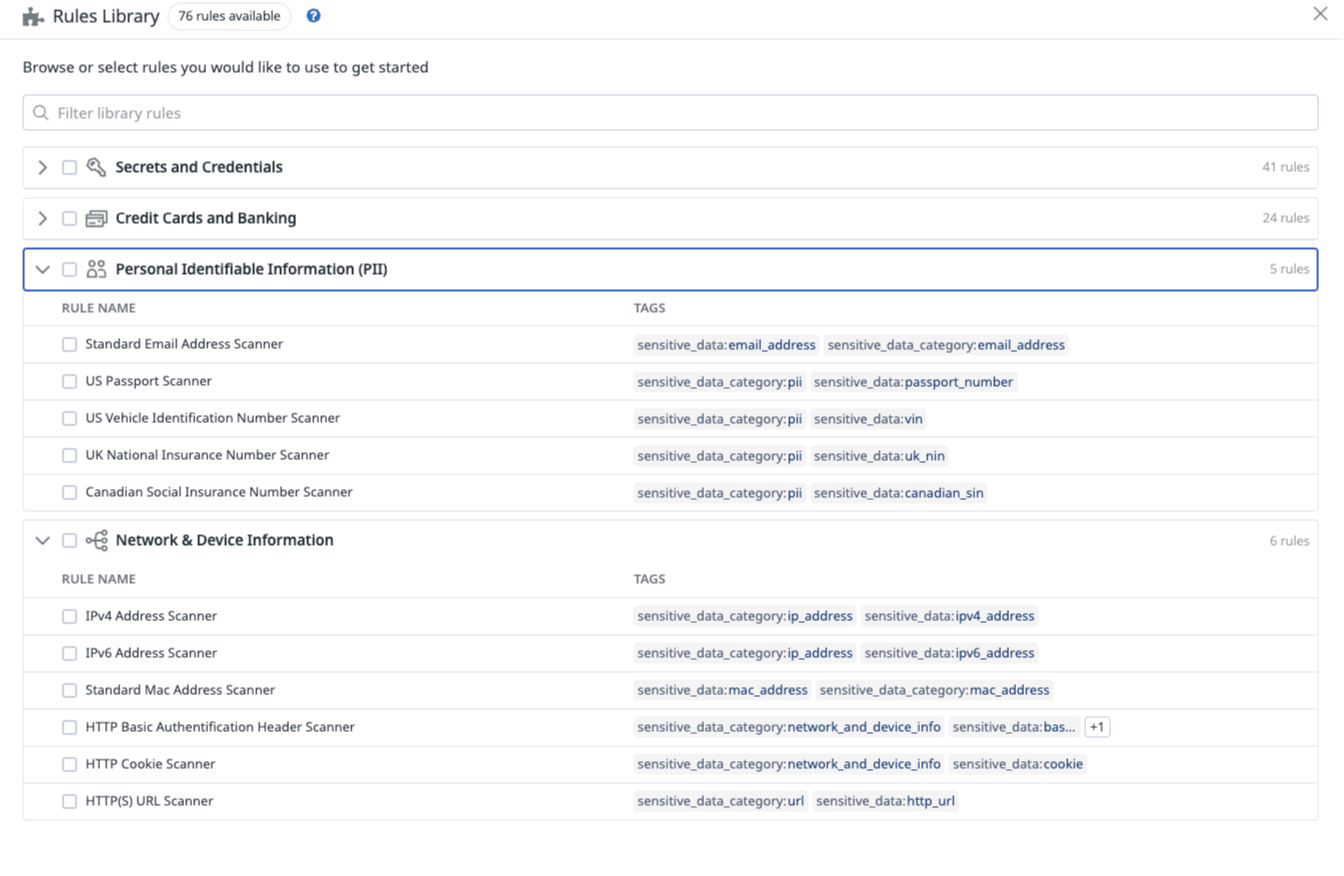
- Redact sensitive data from your telemetry data.
The Observability Pipelines Worker is the software that runs in your infrastructure. It aggregates and centrally processes and routes your data. More specifically, the Worker can:
- Receive or pull all your observability data collected by your agents, collectors, or forwarders.
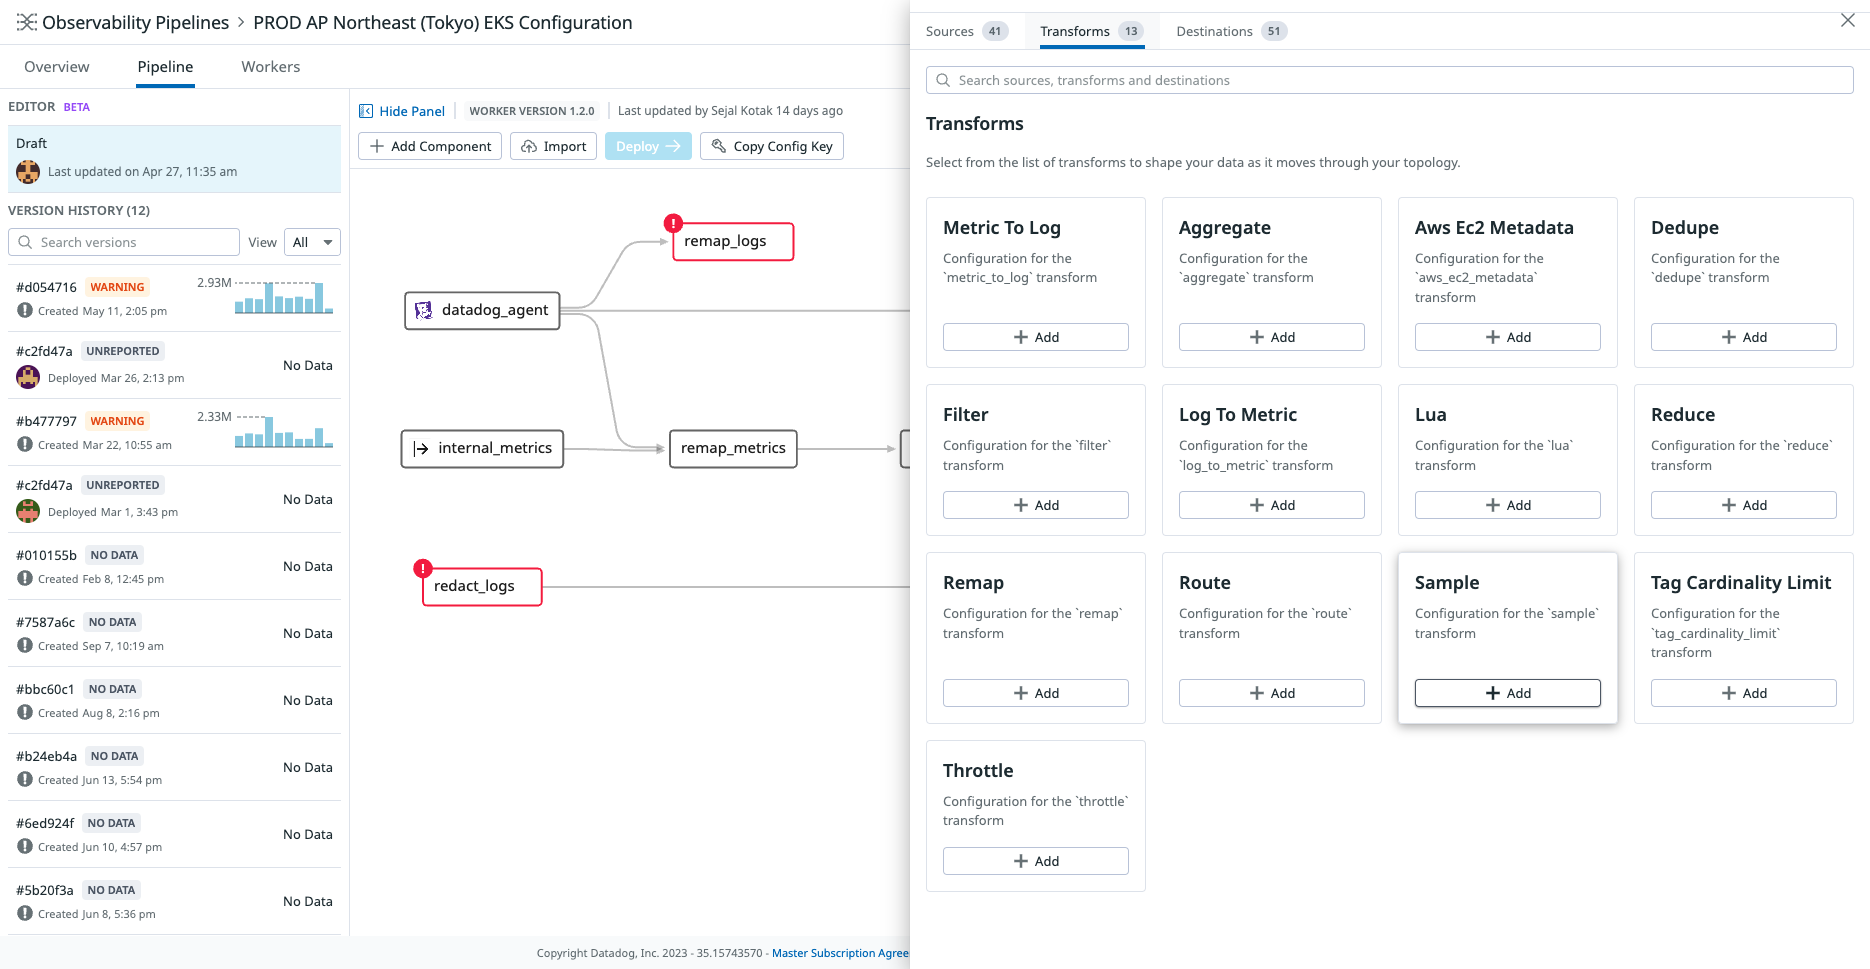
- Transform ingested data (for example: parse, filter, sample, enrich, and more).
- Route the processed data to any destination.
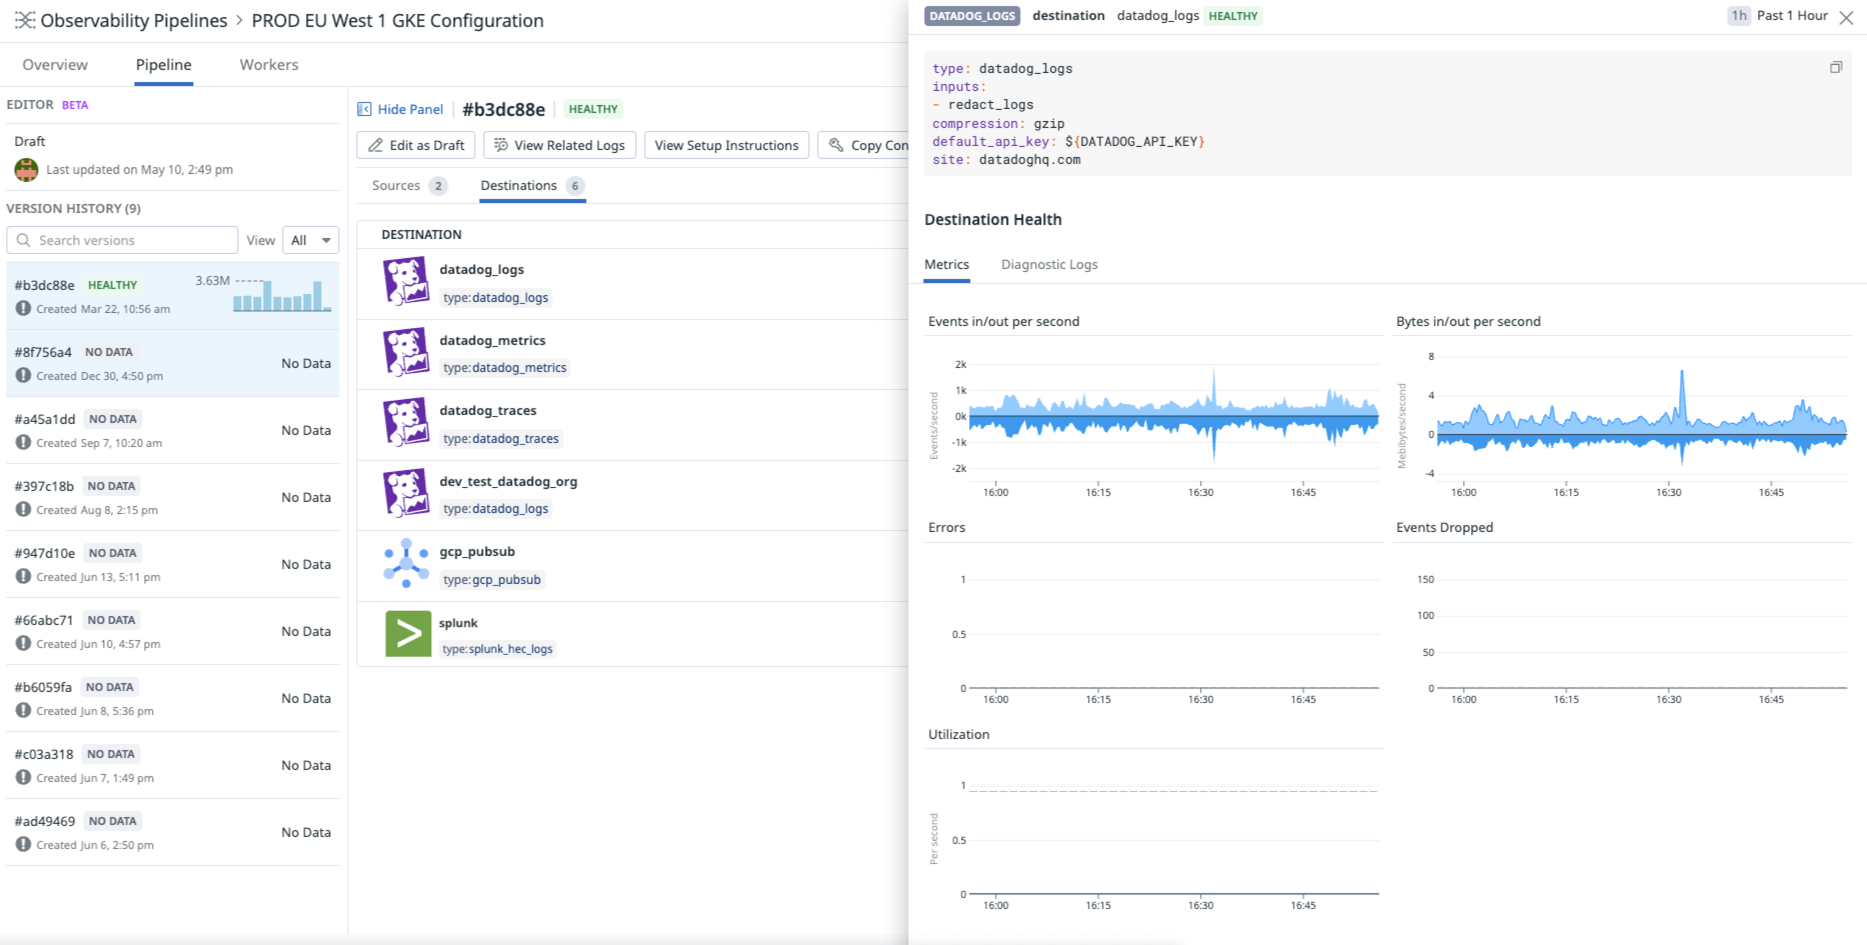
The Datadog UI provides a control plane to manage your Observability Pipelines Workers. You can monitor your pipelines to understand the health of your pipelines, identify bottlenecks and latencies, fine-tune performance, validate data delivery, and investigate your largest volume contributors. You can build or edit pipelines, whether it be routing a subset of data to a new destination or introducing a new sensitive data redaction rule, and roll out these changes to your active pipelines from the Datadog UI.
Get started
- Set up the Observability Pipelines Worker.
- Create pipelines to collect, transform and route your data.
- Discover how to deploy Observability Pipelines at production scale:
- See Deployment Design and Principles for information on what to consider when designing your Observability Pipelines architecture.
- See Best Practices for OP Worker Aggregator Architecture.
Explore Observability Pipelines
Start getting insights into your Observability Pipelines:
Collect data from any source and route data to any destination
Collect data* from any source and route them to any destination to reduce vendor lock-in and simplify migrations.
Control your data volume before it gets routed
Optimize volume and reduce the size of your observability data by sampling, filtering, deduplicating, and aggregating your logs.
Redact sensitive data from your telemetry data
Redact sensitive data before they are routed outside of your infrastructure, using out-of-the-box patterns to scan for PII, PCI, private keys, and more.
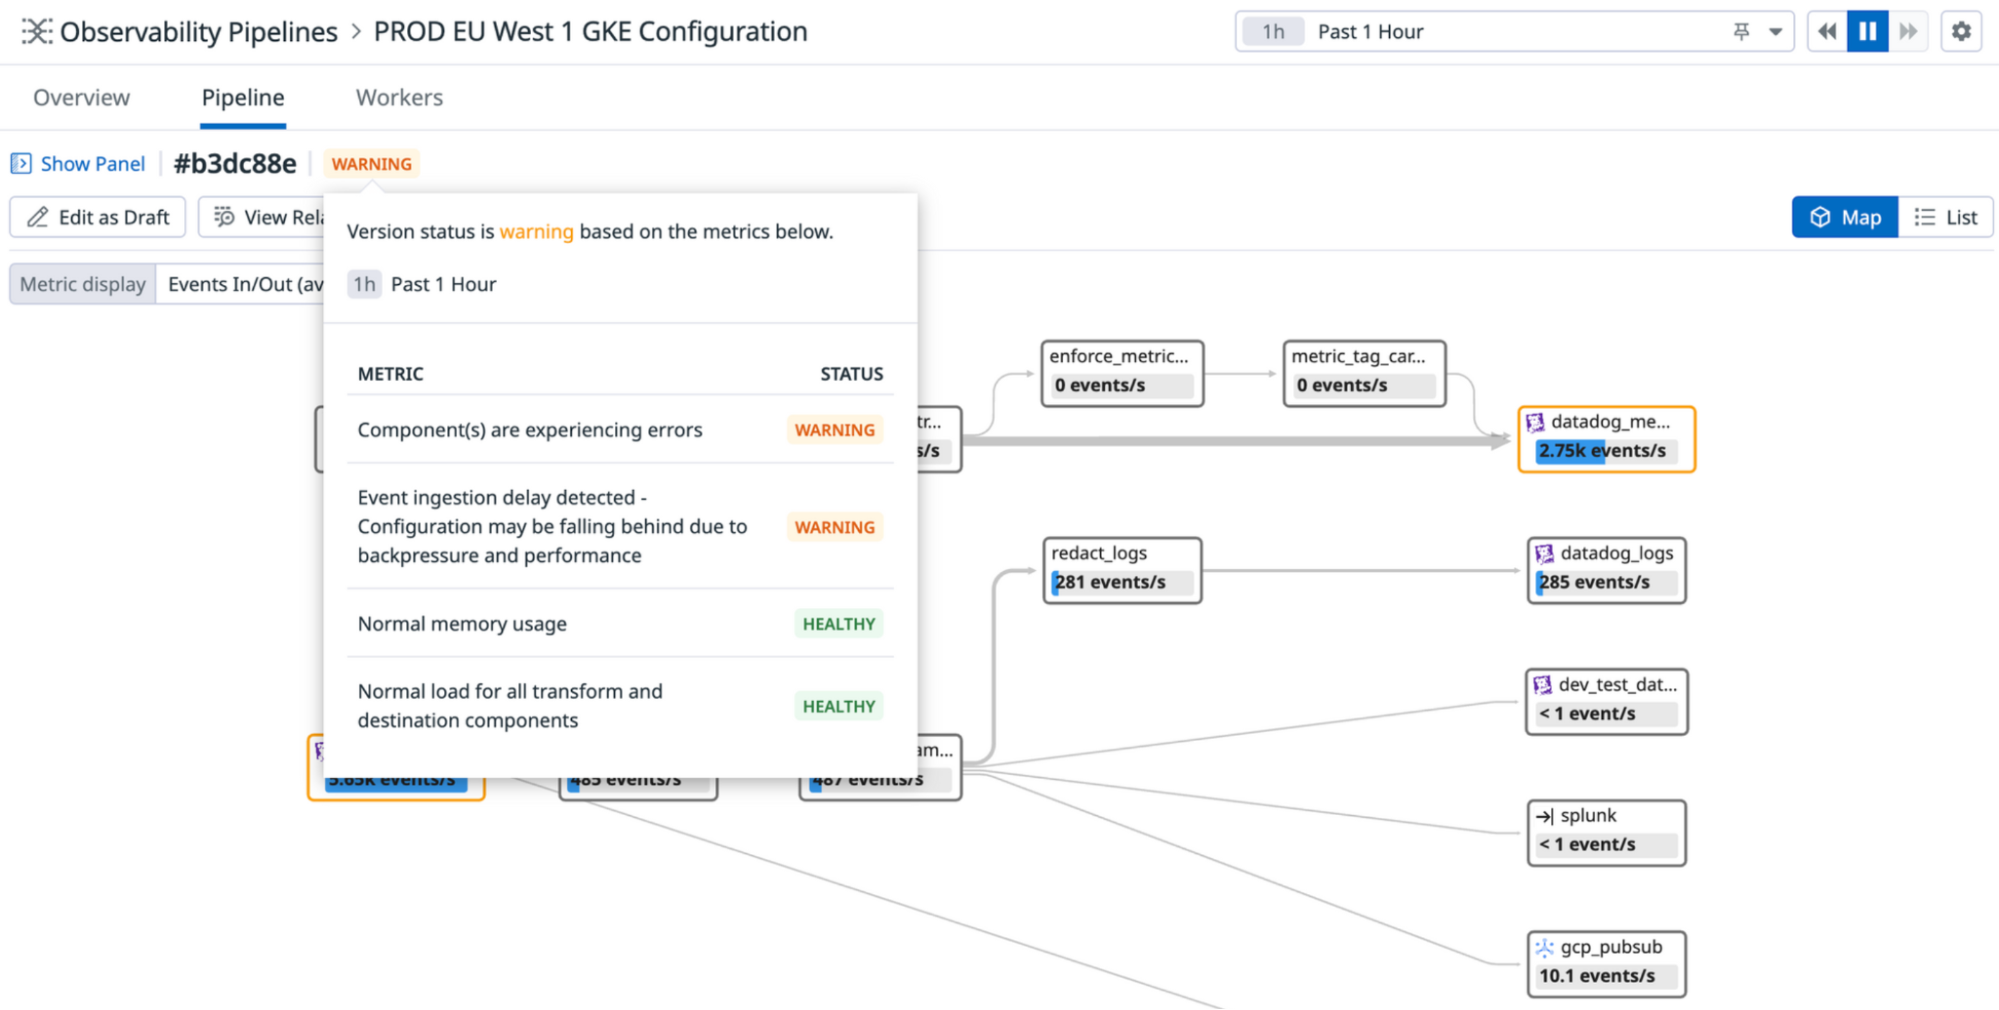
Monitor the health of your pipelines
Get a holistic view of all of your pipelines’ topologies and monitor key performance indicators, such as average load, error rate, and throughput for each of your flows.
Further Reading
Documentation, liens et articles supplémentaires utiles:
