- Principales informations
- Getting Started
- Agent
- API
- Tracing
- Conteneurs
- Dashboards
- Database Monitoring
- Datadog
- Site Datadog
- DevSecOps
- Incident Management
- Intégrations
- Internal Developer Portal
- Logs
- Monitors
- OpenTelemetry
- Profileur
- Session Replay
- Security
- Serverless for AWS Lambda
- Software Delivery
- Surveillance Synthetic
- Tags
- Workflow Automation
- Learning Center
- Support
- Glossary
- Standard Attributes
- Guides
- Agent
- Intégrations
- Développeurs
- OpenTelemetry
- Administrator's Guide
- API
- Partners
- Application mobile
- DDSQL Reference
- CoScreen
- CoTerm
- Remote Configuration
- Cloudcraft
- In The App
- Dashboards
- Notebooks
- DDSQL Editor
- Reference Tables
- Sheets
- Alertes
- Watchdog
- Métriques
- Bits AI
- Internal Developer Portal
- Error Tracking
- Change Tracking
- Service Management
- Actions & Remediations
- Infrastructure
- Cloudcraft
- Resource Catalog
- Universal Service Monitoring
- Hosts
- Conteneurs
- Processes
- Sans serveur
- Surveillance réseau
- Cloud Cost
- Application Performance
- APM
- Termes et concepts de l'APM
- Sending Traces to Datadog
- APM Metrics Collection
- Trace Pipeline Configuration
- Connect Traces with Other Telemetry
- Trace Explorer
- Recommendations
- Code Origin for Spans
- Observabilité des services
- Endpoint Observability
- Dynamic Instrumentation
- Live Debugger
- Suivi des erreurs
- Sécurité des données
- Guides
- Dépannage
- Profileur en continu
- Database Monitoring
- Agent Integration Overhead
- Setup Architectures
- Configuration de Postgres
- Configuration de MySQL
- Configuration de SQL Server
- Setting Up Oracle
- Setting Up Amazon DocumentDB
- Setting Up MongoDB
- Connecting DBM and Traces
- Données collectées
- Exploring Database Hosts
- Explorer les métriques de requête
- Explorer des échantillons de requêtes
- Exploring Database Schemas
- Exploring Recommendations
- Dépannage
- Guides
- Data Streams Monitoring
- Data Jobs Monitoring
- Data Observability
- Digital Experience
- RUM et Session Replay
- Surveillance Synthetic
- Continuous Testing
- Product Analytics
- Software Delivery
- CI Visibility
- CD Visibility
- Deployment Gates
- Test Visibility
- Code Coverage
- Quality Gates
- DORA Metrics
- Feature Flags
- Securité
- Security Overview
- Cloud SIEM
- Code Security
- Cloud Security Management
- Application Security Management
- Workload Protection
- Sensitive Data Scanner
- AI Observability
- Log Management
- Pipelines d'observabilité
- Log Management
- CloudPrem
- Administration
Change Alert Monitor
Cette page n'est pas encore disponible en français, sa traduction est en cours.
Si vous avez des questions ou des retours sur notre projet de traduction actuel, n'hésitez pas à nous contacter.
Si vous avez des questions ou des retours sur notre projet de traduction actuel, n'hésitez pas à nous contacter.
Overview
Metric monitors are one of the most commonly used type of monitor. This guide clarifies the change alert detection method’s behavior and its additional options. Learn how change alert monitors work and how to troubleshoot change alert evaluations.
What are change alert monitors?
Here is a breakdown of how monitors with the change detection method work:
- The monitor takes a query of data points at the current time.
- It takes a query of data points N minutes, hours, or days ago.
- Then, it takes a query of the difference of the values between (1) and (2).
- Aggregation is applied over the query in (3) which returns a single value.
- The threshold defined in Set alert conditions is compared to the single value returned in (4).
Monitor creation
To create a Change Alert monitor in Datadog, use the main navigation: Monitors –> New Monitor –> Change.
Evaluation conditions
Here are the different options that you need to configure in a change alert monitor.
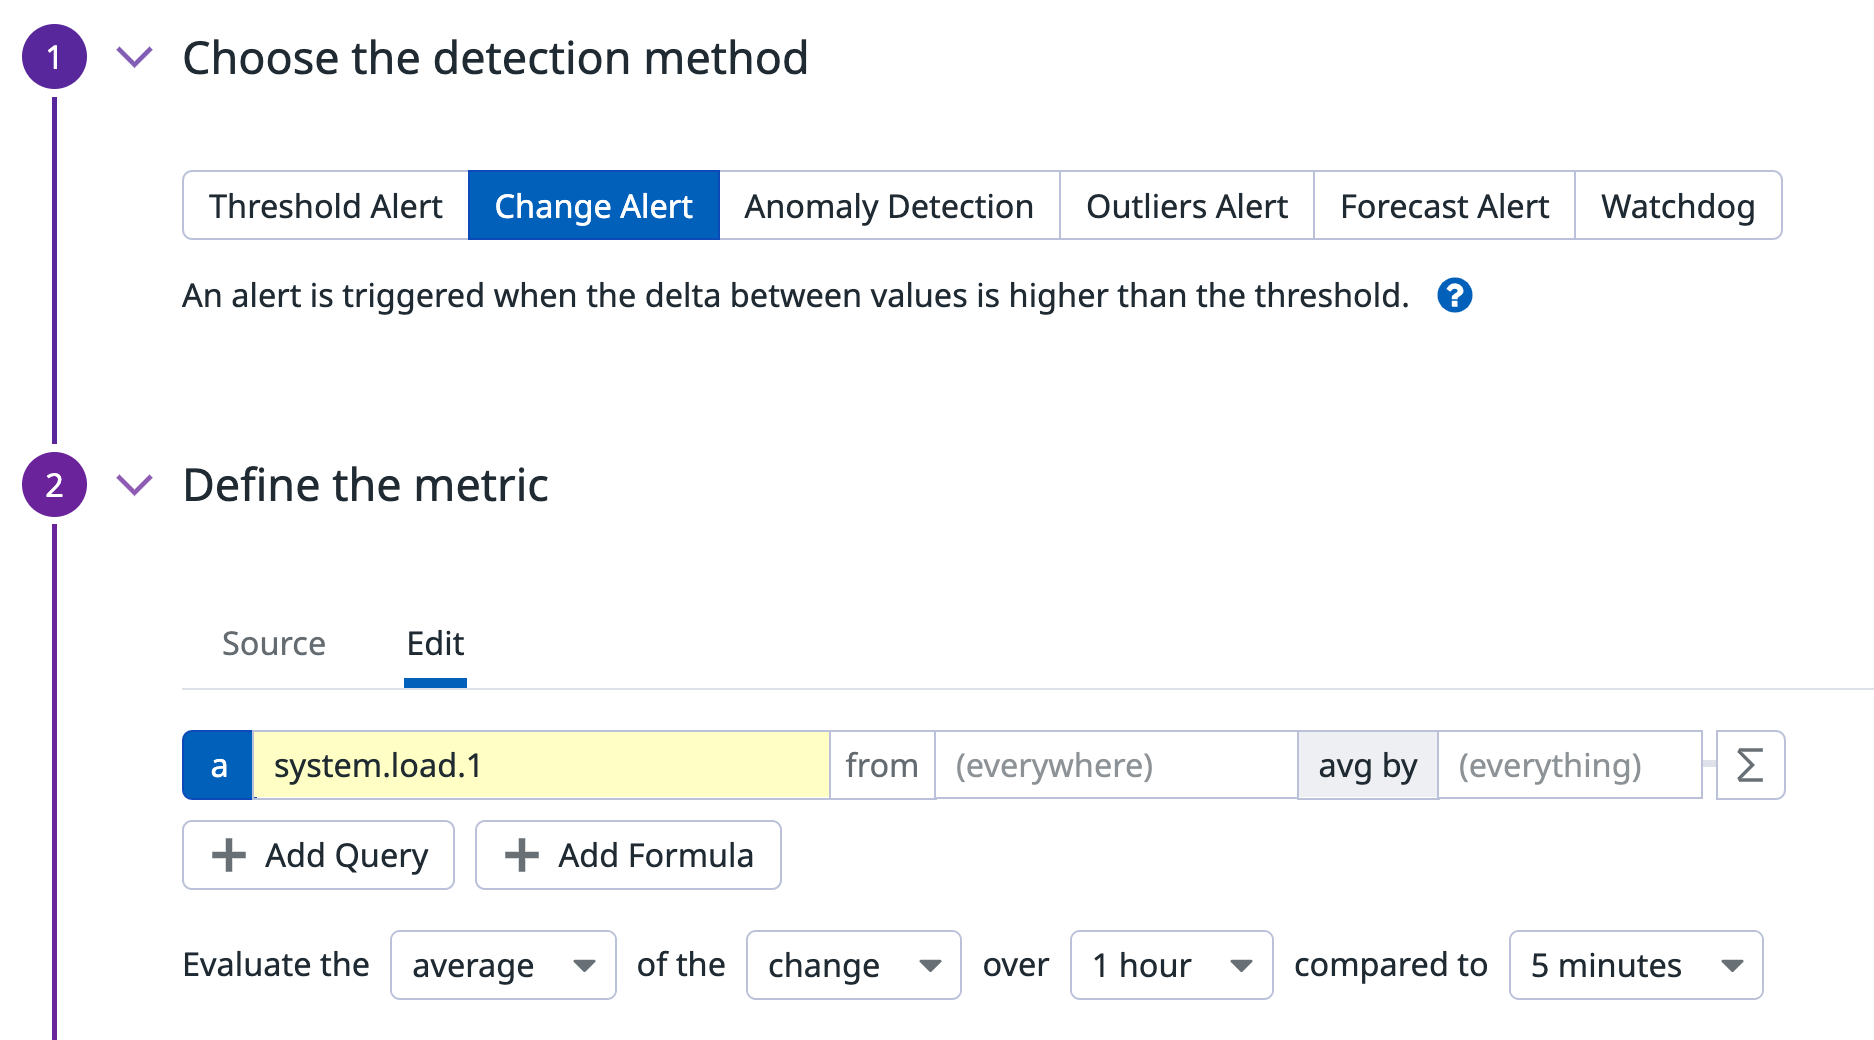
The example shows the following alert condition: The average of the change over 1 hour compared to 5 minutes
| Options selected | Description | Options |
|---|---|---|
| average | The aggregation that is used on the query. | Average, Maximum, Minimum, Sum |
| change | Choose between the absolute or percentage change of the value. | change or % change |
| 1 hour | The evaluation window. For more information, see the Monitor Configuration documentation. | This can be N minutes, hours, days, weeks, or at most one month. |
| 5 minutes | The timeframe that you wish to shift the query by. | This can be N minutes, hours, days, weeks, or at most one month ago. |
Change and change %
There are two options when configuring a change alert detection, Change and % Change.
This determines the way the monitor evaluates as expressed in the formula section in the following table:
| Option | Description | Formula |
|---|---|---|
| Change | The absolute change of the value. | a - b |
| % Change | The percentage change of the value compared to its previous value. | ((a - b) / b) * 100 |
In both cases, Change, and % Change can be either positive or negative.
Notifications
For instructions on the Configure notifications and automations section, see the Notifications and Monitor configuration pages.
Troubleshooting a change alert evaluation
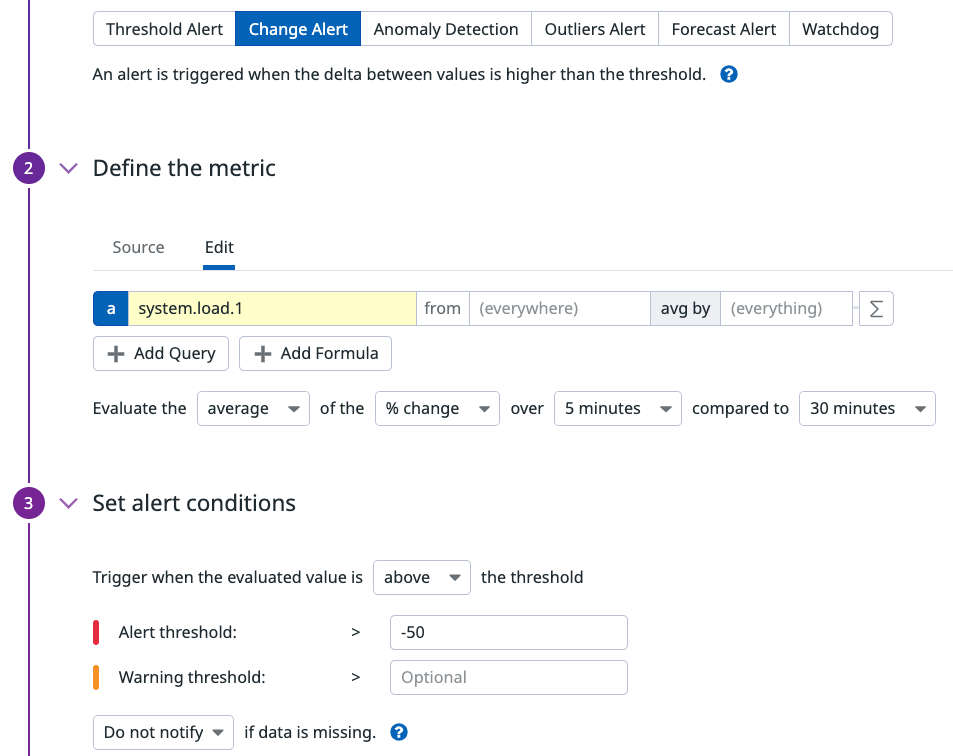
To verify the results of your change alert evaluation, reconstruct the metric queries with a Notebook. Take this change alert monitor with the following settings.
Monitor Query:
pct_change(avg(last_5m),last_30m):<METRIC> > -50
This is a break down of the query with the following conditions:
- Aggregation of avg.
- Uses % change.
- Evaluation window of 5 minutes.
- Timeshift of 30 minutes or 1800 seconds.
- Threshold of > -50.
Reconstructing the query
- Use a notebook and the timeshift function to reconstruct the data used by the monitor at a specific evaluation.
- Query of data points at the current time (this is the normal query
). - Query of data points N minutes ago (this is the normal query + timeshift(-1800)).
- The timeshift function uses a negative duration because you’re shifting the data back. Combine these queries along with the % change formula from the table.
- Note: Since this example only has one metric, it’s also possible to use a single query (a) and add the formula
((a - timeshift(a, -1800)) / timeshift(a, -1800)) * 100
- Query of data points at the current time (this is the normal query
- Compare the monitor’s history graph with the notebook graph. Are the values comparable?
- Apply the aggregation.
- To compare your notebook graph to the change alert monitor evaluation, scope your timeframe to match the change alert.
- For example, if you are looking to verify the value of a monitor evaluation over the last five minutes at 1:30, scope your notebook to 1:25 - 1:30.
Further reading
Documentation, liens et articles supplémentaires utiles:


