- Principales informations
- Getting Started
- Agent
- API
- Tracing
- Conteneurs
- Dashboards
- Database Monitoring
- Datadog
- Site Datadog
- DevSecOps
- Incident Management
- Intégrations
- Internal Developer Portal
- Logs
- Monitors
- OpenTelemetry
- Profileur
- Session Replay
- Security
- Serverless for AWS Lambda
- Software Delivery
- Surveillance Synthetic
- Tags
- Workflow Automation
- Learning Center
- Support
- Glossary
- Standard Attributes
- Guides
- Agent
- Intégrations
- Développeurs
- OpenTelemetry
- Administrator's Guide
- API
- Partners
- Application mobile
- DDSQL Reference
- CoScreen
- CoTerm
- Remote Configuration
- Cloudcraft
- In The App
- Dashboards
- Notebooks
- DDSQL Editor
- Reference Tables
- Sheets
- Alertes
- Watchdog
- Métriques
- Bits AI
- Internal Developer Portal
- Error Tracking
- Change Tracking
- Service Management
- Actions & Remediations
- Infrastructure
- Cloudcraft
- Resource Catalog
- Universal Service Monitoring
- Hosts
- Conteneurs
- Processes
- Sans serveur
- Surveillance réseau
- Cloud Cost
- Application Performance
- APM
- Termes et concepts de l'APM
- Sending Traces to Datadog
- APM Metrics Collection
- Trace Pipeline Configuration
- Connect Traces with Other Telemetry
- Trace Explorer
- Recommendations
- Code Origin for Spans
- Observabilité des services
- Endpoint Observability
- Dynamic Instrumentation
- Live Debugger
- Suivi des erreurs
- Sécurité des données
- Guides
- Dépannage
- Profileur en continu
- Database Monitoring
- Agent Integration Overhead
- Setup Architectures
- Configuration de Postgres
- Configuration de MySQL
- Configuration de SQL Server
- Setting Up Oracle
- Setting Up Amazon DocumentDB
- Setting Up MongoDB
- Connecting DBM and Traces
- Données collectées
- Exploring Database Hosts
- Explorer les métriques de requête
- Explorer des échantillons de requêtes
- Exploring Database Schemas
- Exploring Recommendations
- Dépannage
- Guides
- Data Streams Monitoring
- Data Jobs Monitoring
- Data Observability
- Digital Experience
- RUM et Session Replay
- Surveillance Synthetic
- Continuous Testing
- Product Analytics
- Software Delivery
- CI Visibility
- CD Visibility
- Deployment Gates
- Test Visibility
- Code Coverage
- Quality Gates
- DORA Metrics
- Feature Flags
- Securité
- Security Overview
- Cloud SIEM
- Code Security
- Cloud Security Management
- Application Security Management
- Workload Protection
- Sensitive Data Scanner
- AI Observability
- Log Management
- Pipelines d'observabilité
- Log Management
- CloudPrem
- Administration
Status Events
Cette page n'est pas encore disponible en français, sa traduction est en cours.
Si vous avez des questions ou des retours sur notre projet de traduction actuel, n'hésitez pas à nous contacter.
Si vous avez des questions ou des retours sur notre projet de traduction actuel, n'hésitez pas à nous contacter.
Status Events is part of the provisional Monitor Status Page. If you are using the legacy status page, see the Status Page (Legacy) documentation.
Overview
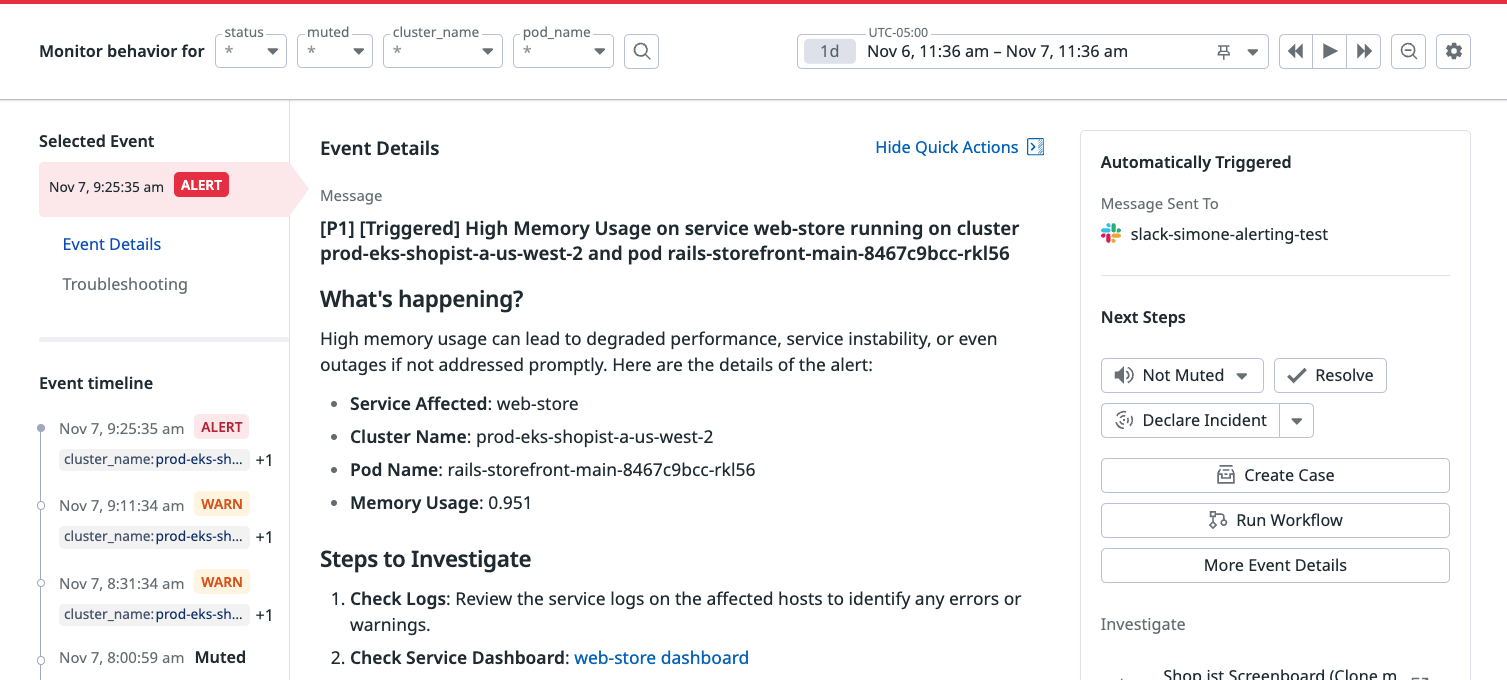
All events generated by your monitor appear on the monitor’s status page, showing the groups’ name, event type, and timestamp. The Event timeline also includes downtime and audit trail events.
For each event, you can access quick actions and view related assets, like dashboards and logs.
Event details section
To explore each individual event for more information, including associated tags and actions:
- From the monitor status page, scroll down to the Event timeline.
- Click on an event in the timeline to view event details.
Use the event details to understand monitor alerts and identify root causes. This information supports responder workflows and helps you stay informed about ongoing situations.
Take action to remediate
With Quick Actions, you can take action without leaving the status page. Responders save time since the context is automatically added.
| Action | Description |
|---|---|
| Mute | Create a downtime to mute monitor alerts. |
| Resolve | Temporarily set the monitor status to OK until its next evaluation. |
| Declare Incident | Escalate monitor alerts with Incident Management. |
| Create Case | Create a case to keep track of this alert investigation without leaving Datadog. |
| Run Workflow | Run Workflow Automation with predefined snippets to run mitigation actions. |
Resolve
You can resolve a monitor alert from the status page Header or Event details sections. Resolving from the Event details section only affects the group related to the selected event, while resolving from the Header resolves all groups in the alert and sets the monitor status to OK (all groups).
If a monitor is alerting because its current data corresponds to the ALERT state, using resolve will cause the state to temporarily switch from ALERT to OK, and then back to ALERT. Therefore, resolve is not meant for acknowledging the alert or instructing Datadog to ignore it.
Manually resolving a monitor is useful when data is reported intermittently. For example, after an alert is triggered, the monitor may stop receiving data, preventing it from evaluating alert conditions and recovering to the OK state. In such cases, the resolve function or the Automatically resolve monitor after X hours changes the monitor back to an OK state.
Typical use case: A monitor based on error metrics that are not generated when there are no errors (aws.elb.httpcode_elb_5xx, or any DogStatsD counter in your code reporting an error only when there is an error).
Event troubleshooting section
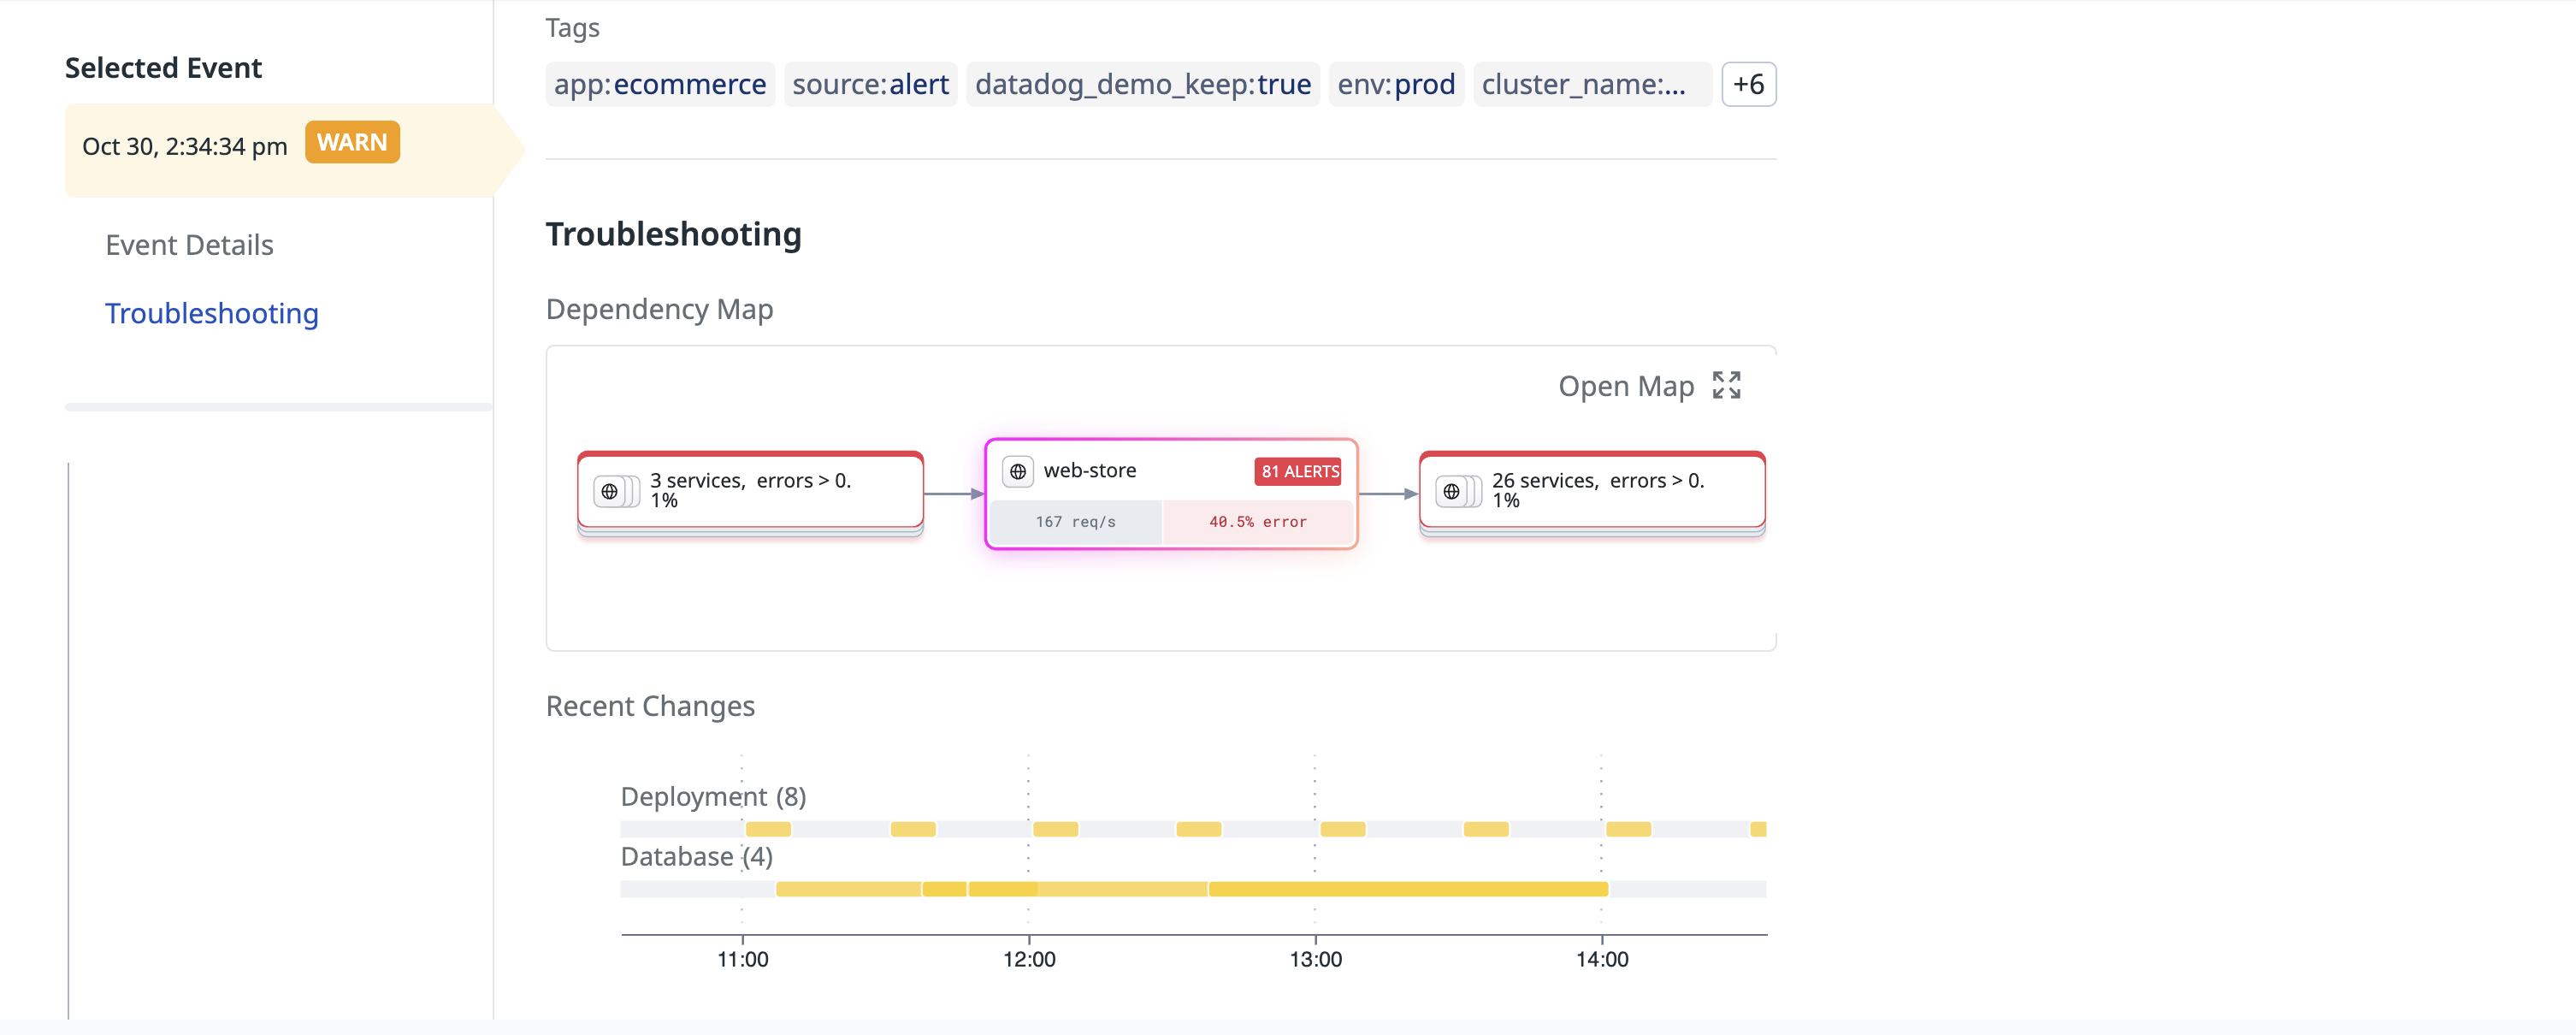
For each event, access troubleshooting information to help responders quickly understand the context of the alert.
| Troubleshooting component | Description |
|---|---|
| Dependency Map | When a service tag is available, either as a monitor tag or in the group, you can access a dependency map showing the status of your dependencies. |
| Change Tracking | When a service tag is available, either as a monitor tag or in the group, you can access a list of relevant changes to your service and its dependencies. For details on specific types of supported changes and setup requirements, see the Change Tracking documentation. |
Further reading
Documentation, liens et articles supplémentaires utiles:


