- Principales informations
- Getting Started
- Agent
- API
- Tracing
- Conteneurs
- Dashboards
- Database Monitoring
- Datadog
- Site Datadog
- DevSecOps
- Incident Management
- Intégrations
- Internal Developer Portal
- Logs
- Monitors
- OpenTelemetry
- Profileur
- Session Replay
- Security
- Serverless for AWS Lambda
- Software Delivery
- Surveillance Synthetic
- Tags
- Workflow Automation
- Learning Center
- Support
- Glossary
- Standard Attributes
- Guides
- Agent
- Intégrations
- Développeurs
- OpenTelemetry
- Administrator's Guide
- API
- Partners
- Application mobile
- DDSQL Reference
- CoScreen
- CoTerm
- Remote Configuration
- Cloudcraft
- In The App
- Dashboards
- Notebooks
- DDSQL Editor
- Reference Tables
- Sheets
- Alertes
- Watchdog
- Métriques
- Bits AI
- Internal Developer Portal
- Error Tracking
- Change Tracking
- Service Management
- Actions & Remediations
- Infrastructure
- Cloudcraft
- Resource Catalog
- Universal Service Monitoring
- Hosts
- Conteneurs
- Processes
- Sans serveur
- Surveillance réseau
- Cloud Cost
- Application Performance
- APM
- Termes et concepts de l'APM
- Sending Traces to Datadog
- APM Metrics Collection
- Trace Pipeline Configuration
- Connect Traces with Other Telemetry
- Trace Explorer
- Recommendations
- Code Origin for Spans
- Observabilité des services
- Endpoint Observability
- Dynamic Instrumentation
- Live Debugger
- Suivi des erreurs
- Sécurité des données
- Guides
- Dépannage
- Profileur en continu
- Database Monitoring
- Agent Integration Overhead
- Setup Architectures
- Configuration de Postgres
- Configuration de MySQL
- Configuration de SQL Server
- Setting Up Oracle
- Setting Up Amazon DocumentDB
- Setting Up MongoDB
- Connecting DBM and Traces
- Données collectées
- Exploring Database Hosts
- Explorer les métriques de requête
- Explorer des échantillons de requêtes
- Exploring Database Schemas
- Exploring Recommendations
- Dépannage
- Guides
- Data Streams Monitoring
- Data Jobs Monitoring
- Data Observability
- Digital Experience
- RUM et Session Replay
- Surveillance Synthetic
- Continuous Testing
- Product Analytics
- Software Delivery
- CI Visibility
- CD Visibility
- Deployment Gates
- Test Visibility
- Code Coverage
- Quality Gates
- DORA Metrics
- Feature Flags
- Securité
- Security Overview
- Cloud SIEM
- Code Security
- Cloud Security Management
- Application Security Management
- Workload Protection
- Sensitive Data Scanner
- AI Observability
- Log Management
- Pipelines d'observabilité
- Log Management
- CloudPrem
- Administration
Monitoring Sparse Metrics
Cette page n'est pas encore disponible en français, sa traduction est en cours.
Si vous avez des questions ou des retours sur notre projet de traduction actuel, n'hésitez pas à nous contacter.
Si vous avez des questions ou des retours sur notre projet de traduction actuel, n'hésitez pas à nous contacter.
Overview
Monitors that report data infrequently, can have unexpected results and queries may not evaluate as intended. There are tools and behaviors that you can use to ensure a monitor’s settings are appropriate for your data and expected evaluations.
This guide covers the following ways of troubleshooting and configuring monitors with sparse data:
- Determine if you have sparse metrics
- Consider the source of your monitor -> Metric-based monitor, Event-based monitor
- Is the monitor running on a schedule?
How to determine whether you have a sparse metric
You can use a dashboard widget, a notebook, or even an existing monitor’s history graph and hover over the datapoints to see if the datapoints seem continuous, as opposed to straight lines filling the gaps between each point.
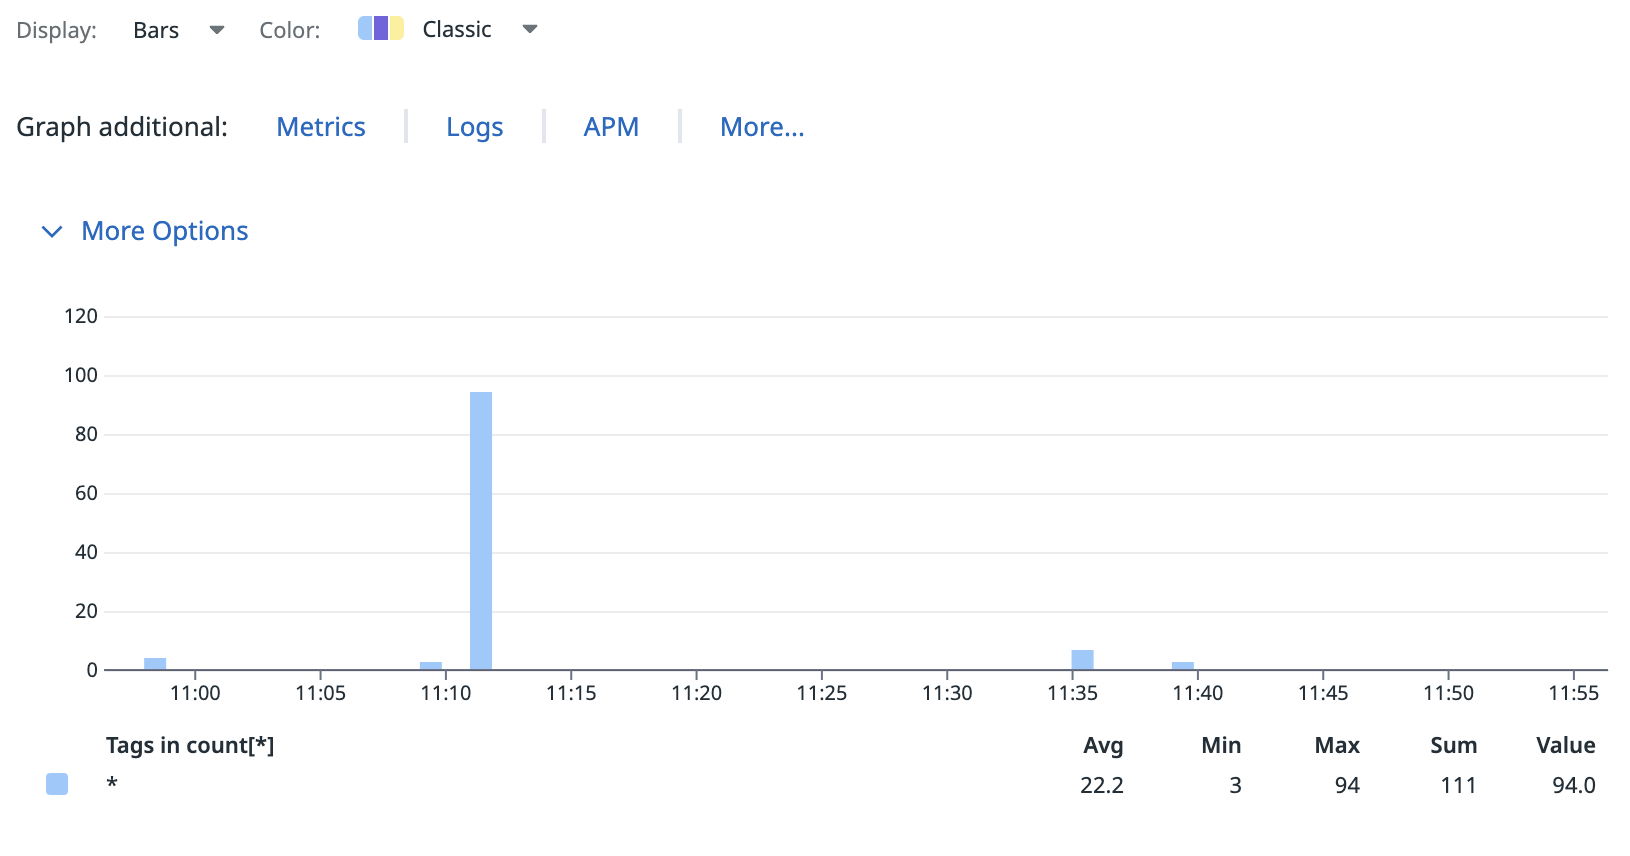
In a notebook, or widget, select the Bars display option to see the points of data and their frequency.
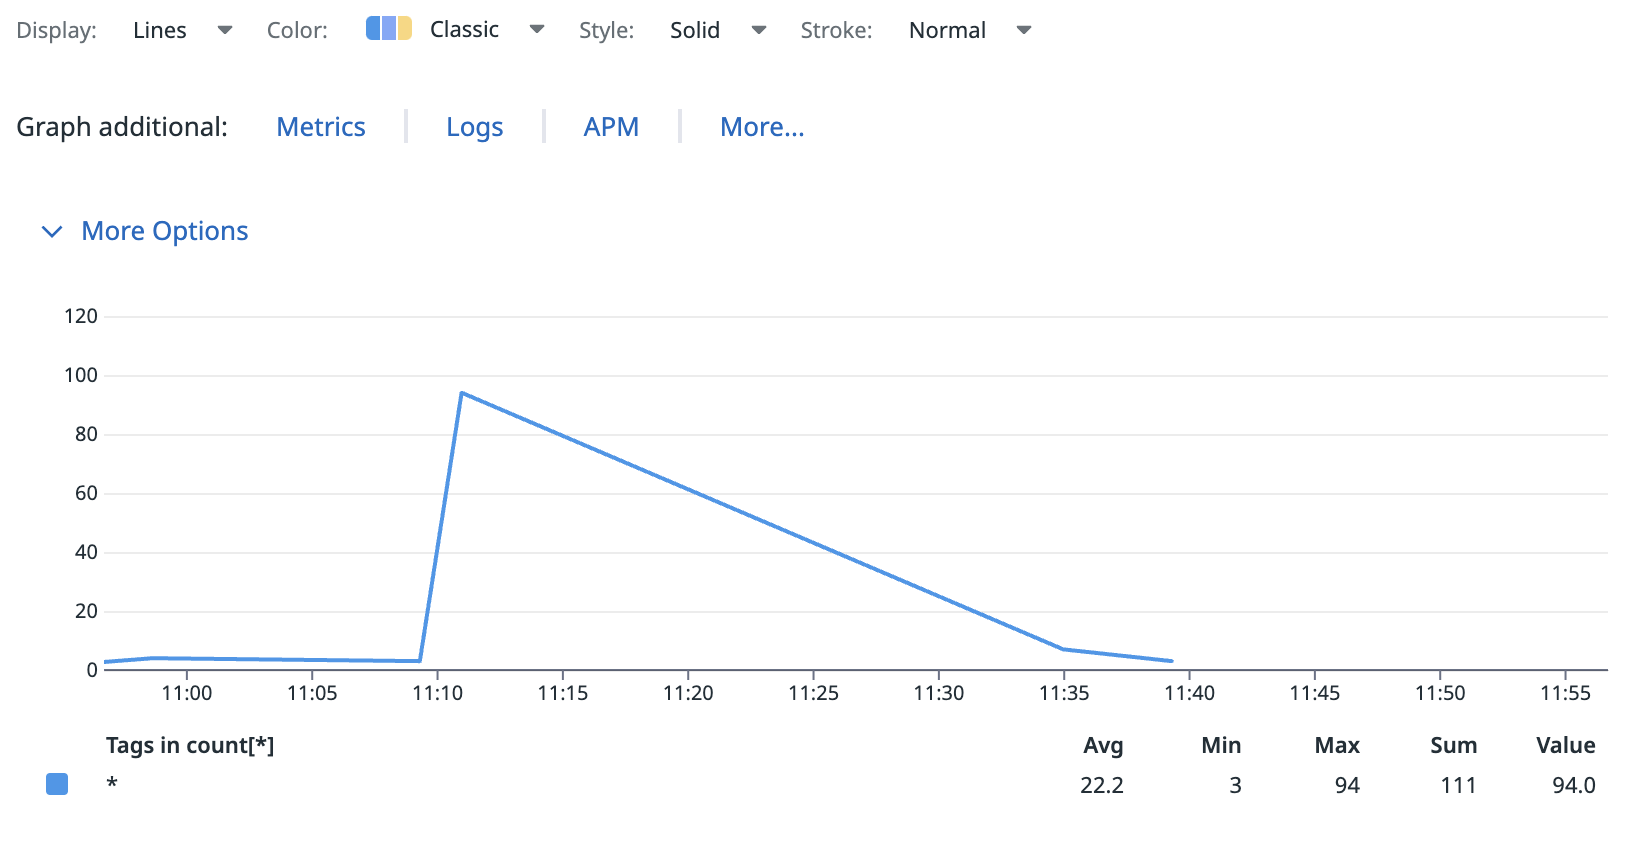
A metric displayed in a widget may look like this:
But when the Bars style is applied, it looks like this:
With the bar graph display, you can visualize the gaps between datapoints more clearly.
If the graph editor does not have multiple options to change the graph style, you can apply the function default_zero() to the metric, which helps reveal the gaps in data. For more information on this function, see the Interpolation documentation.
Metric-based monitor
Is this a metric, change, anomaly, forecast, or outlier monitor? Adjust the following settings:
- Under Advanced options, select Do not require a full window of data for evaluation.
- Is the data often delayed? Consider adding time (in seconds) to the monitor evaluation delay. Under Advanced options add a value to the Delay monitor evaluation by X seconds field.
- Adjust the evaluation (avg by, max by, min by, sum by) based on the expected frequency. The default evaluation is avg by, which may not be suited for sparse metrics.
- If you are using the avg by aggregator, consider adding an interpolation function like
default_zero()to ensure the gaps in the metric are evaluated as zero. - If you are using arithmetic in your query, take a look at Monitor Arithmetic and Sparse Metrics for some further guidance.
Event-based monitor
Is this a log, event, audit trail, or error tracking monitor? Look at the following:
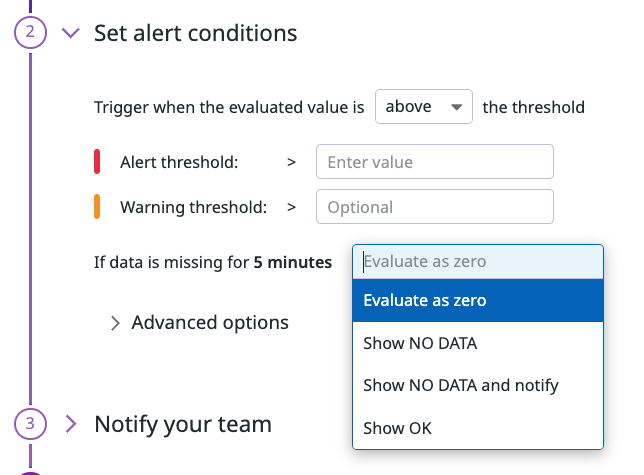
- Verify the “Missing data” setting corresponds to your expected monitor behavior: Evaluate as zero, Show NO DATA, Show NO DATA and notify, or Show OK
- Adjust the evaluation period. If datapoints are expected to be available every 30 minutes, then the evaluation period should account for that.
Schedule-based monitoring
Are you monitoring an event that needs to happen at certain times of the day, week, month? A CRON task such as a backup job or export? Consider using Custom Schedules, which allow you to set RRULES to define when the monitor should evaluate and notify.
Troubleshooting
Reach out to the Datadog support team if you have any questions regarding monitoring sparse data.
Further Reading
Documentation, liens et articles supplémentaires utiles:


