- Principales informations
- Getting Started
- Agent
- API
- Tracing
- Conteneurs
- Dashboards
- Database Monitoring
- Datadog
- Site Datadog
- DevSecOps
- Incident Management
- Intégrations
- Internal Developer Portal
- Logs
- Monitors
- OpenTelemetry
- Profileur
- Session Replay
- Security
- Serverless for AWS Lambda
- Software Delivery
- Surveillance Synthetic
- Tags
- Workflow Automation
- Learning Center
- Support
- Glossary
- Standard Attributes
- Guides
- Agent
- Intégrations
- Développeurs
- OpenTelemetry
- Administrator's Guide
- API
- Partners
- Application mobile
- DDSQL Reference
- CoScreen
- CoTerm
- Remote Configuration
- Cloudcraft
- In The App
- Dashboards
- Notebooks
- DDSQL Editor
- Reference Tables
- Sheets
- Alertes
- Watchdog
- Métriques
- Bits AI
- Internal Developer Portal
- Error Tracking
- Change Tracking
- Service Management
- Actions & Remediations
- Infrastructure
- Cloudcraft
- Resource Catalog
- Universal Service Monitoring
- Hosts
- Conteneurs
- Processes
- Sans serveur
- Surveillance réseau
- Cloud Cost
- Application Performance
- APM
- Termes et concepts de l'APM
- Sending Traces to Datadog
- APM Metrics Collection
- Trace Pipeline Configuration
- Connect Traces with Other Telemetry
- Trace Explorer
- Recommendations
- Code Origin for Spans
- Observabilité des services
- Endpoint Observability
- Dynamic Instrumentation
- Live Debugger
- Suivi des erreurs
- Sécurité des données
- Guides
- Dépannage
- Profileur en continu
- Database Monitoring
- Agent Integration Overhead
- Setup Architectures
- Configuration de Postgres
- Configuration de MySQL
- Configuration de SQL Server
- Setting Up Oracle
- Setting Up Amazon DocumentDB
- Setting Up MongoDB
- Connecting DBM and Traces
- Données collectées
- Exploring Database Hosts
- Explorer les métriques de requête
- Explorer des échantillons de requêtes
- Exploring Database Schemas
- Exploring Recommendations
- Dépannage
- Guides
- Data Streams Monitoring
- Data Jobs Monitoring
- Data Observability
- Digital Experience
- RUM et Session Replay
- Surveillance Synthetic
- Continuous Testing
- Product Analytics
- Software Delivery
- CI Visibility
- CD Visibility
- Deployment Gates
- Test Visibility
- Code Coverage
- Quality Gates
- DORA Metrics
- Feature Flags
- Securité
- Security Overview
- Cloud SIEM
- Code Security
- Cloud Security Management
- Application Security Management
- Workload Protection
- Sensitive Data Scanner
- AI Observability
- Log Management
- Pipelines d'observabilité
- Log Management
- CloudPrem
- Administration
Metrics Overview Page
Cette page n'est pas encore disponible en français, sa traduction est en cours.
Si vous avez des questions ou des retours sur notre projet de traduction actuel, n'hésitez pas à nous contacter.
Si vous avez des questions ou des retours sur notre projet de traduction actuel, n'hésitez pas à nous contacter.
Overview
The Metrics Overview page provides users of all experience levels with a deeper understanding of their metrics landscape. It provides guidance on how you can maximize the value of your Datadog metrics.
With the Metrics Overview Page you can learn how to:
- Explore the sources of your metrics
- Generate additional metrics from Datadog products
- Enable advanced platform capabilities such as percentiles, Metrics without Limits™, and historical metric ingestion
How your metrics flow through Datadog
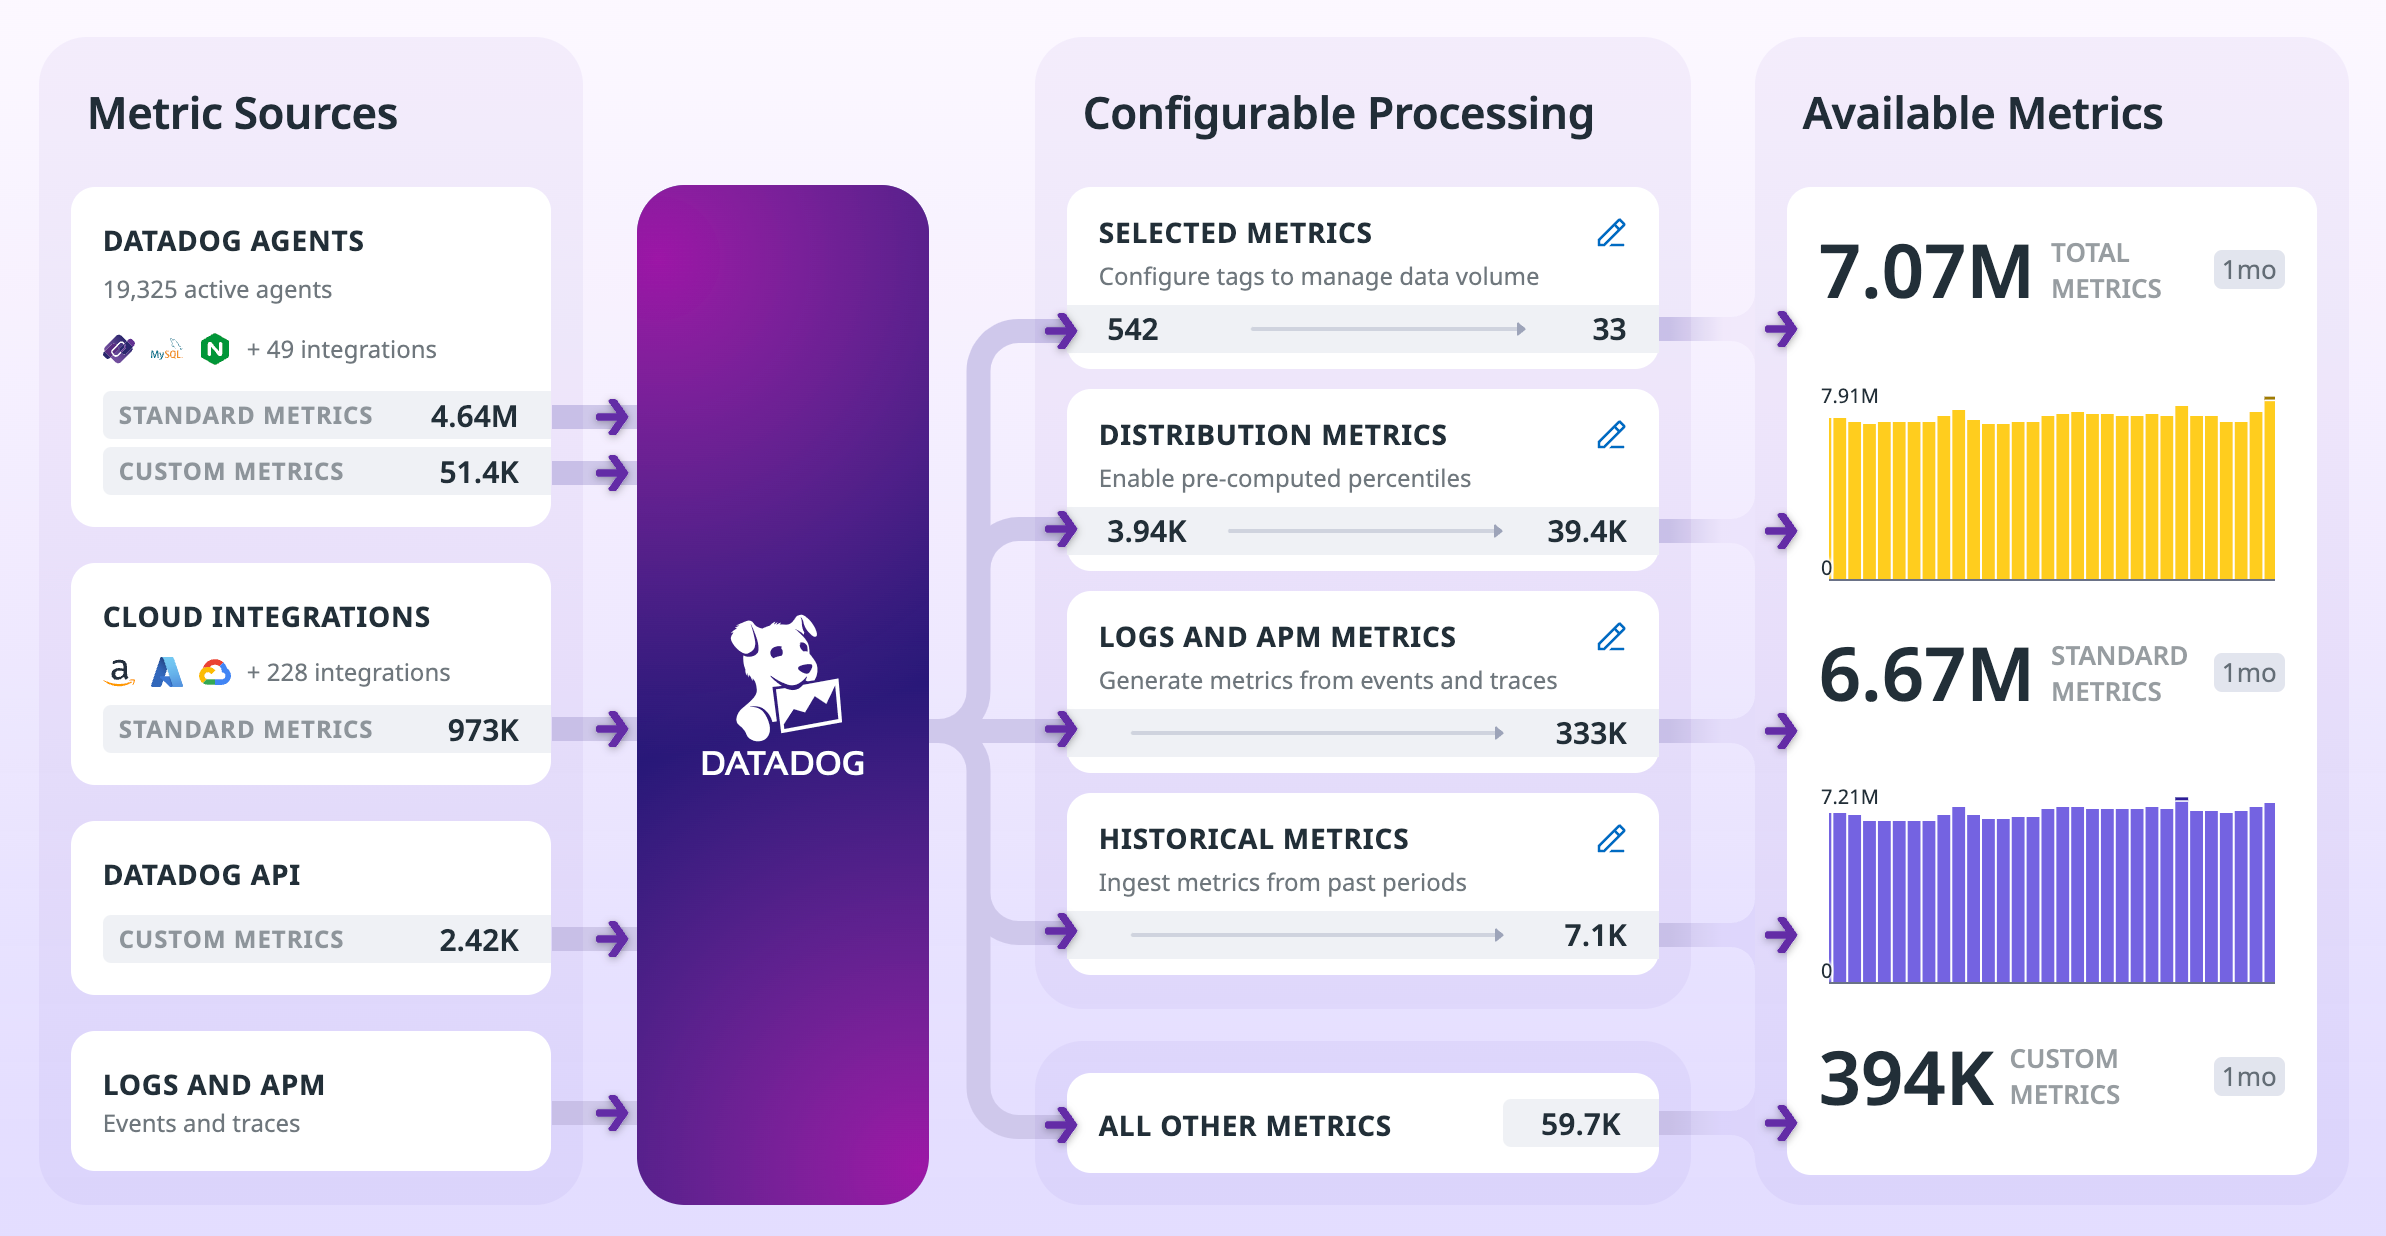
This section shows all of your metric sources, the additional processing and configuration that is applied to your metrics data, and a volume breakdown of standard and custom metrics.
Note: the Overview page is not dedicated to managing the costs of metrics. See Best Practices for Custom Metrics Governance for further details on how to optimize costs.
Metric Sources
The Metric Sources column shows a summary of the metric sources reporting to Datadog. Click on any of the sources to open the Summary page scoped to that source. Your Datadog metrics can originate from the following sources:
Datadog Agent
Datadog Agent
The Datadog Agent collects metrics from the hosts where it’s installed and forwards them to Datadog. These metrics could originate from:
- Any of the official Datadog integrations that are bundled with the Agent. See the integrations-core repository for a full listing of the available Agent-based integrations.
- DogStatsD, a metrics aggregation service bundled with the Datadog Agent. DogStatsD implements the StatsD protocol with some Datadog-specific extensions.
- Custom checks, which are used to collect metrics from custom applications or unique systems. You define the logic for the check yourself in the Agent’s configuration files. See Writing a Custom Agent Check for more information.
- Marketplace integrations installed on the Agent. The Datadog Marketplace is a digital marketplace where Technology Partners can list their paid offerings to Datadog users.
Cloud integrations
Cloud integrations
Also known as authentication-based integrations, these integrations are set up in Datadog. You provide the credentials for obtaining metrics, and Datadog makes API calls on your behalf to collect them. Common examples are cloud provider integrations, Slack, and PagerDuty. See API-based integrations in the Developers documentation for more information.
Datadog API
Datadog API
You can send metrics directly to the Metrics API.
In total, Datadog has more than 1,000 integrations. See Integration Management for more information about managing your integrations.
Configurable Processing
The Configurable Processing column lists the various advanced configuration options that you can use to increase the value of your metrics. Click on any of the options for more information and a link to the relevant configuration screen.
Optimize your custom metrics costs with Metrics without Limits™
Optimize your custom metrics costs with Metrics without Limits™
Metrics without Limits™ helps you manage custom metric costs by indexing only the metric tags most valuable to your organization. Your use of Metrics without Limits™ is reflected in the top section of the Overview page as Selected Metrics. For more information about managing your custom metrics costs, see Best Practices for Custom Metrics Governance.
Enable percentiles on distribution metrics
Enable percentiles on distribution metrics
Distribution metrics with percentiles enabled provide you with globally accurate percentiles calculated server-side from all hosts, so you can measure statistical distributions across your entire distributed infrastructure.
Generate metrics from other Datadog products
Generate metrics from other Datadog products
Some products incorporate standard metrics to surface insights out of the box (for example, APM).
Logs
Generate custom metrics from ingested logs to summarize data from all the logs ingested by Datadog. This allows you to visualize and alert on log data that’s important to your environment, even if the logs are not indexed for long-term search.
APM
Generate custom metrics from your ingested spans to visualize anomalies and trends across any parameters that are important to your business context.
Real User Monitoring (RUM)
Generate custom metrics from RUM events to summarize the data from your RUM events, so you can visualize and alert on the user behaviors that are most impactful to your organization.
Processes
Generate custom process-based metrics to monitor the resource consumption of your processes, as well as any other process-related behavior that might be important to your business needs.
Events
Generate custom event-based metrics for visibility into monitor alerts or any other event-based data ingested by Datadog.
Ingest historical metrics
Ingest historical metrics
Historical Metrics Ingestion enables you to ingest metric values with timestamps older than one hour from the time of submission.
Available Metrics
The Available Metrics column breaks down your total metric volume by standard and custom metrics over the past month. If you’re interested in managing your custom metrics volume, see the Best Practices for Custom Metrics Governance page and the Metrics Volume Management page for more detailed insights.
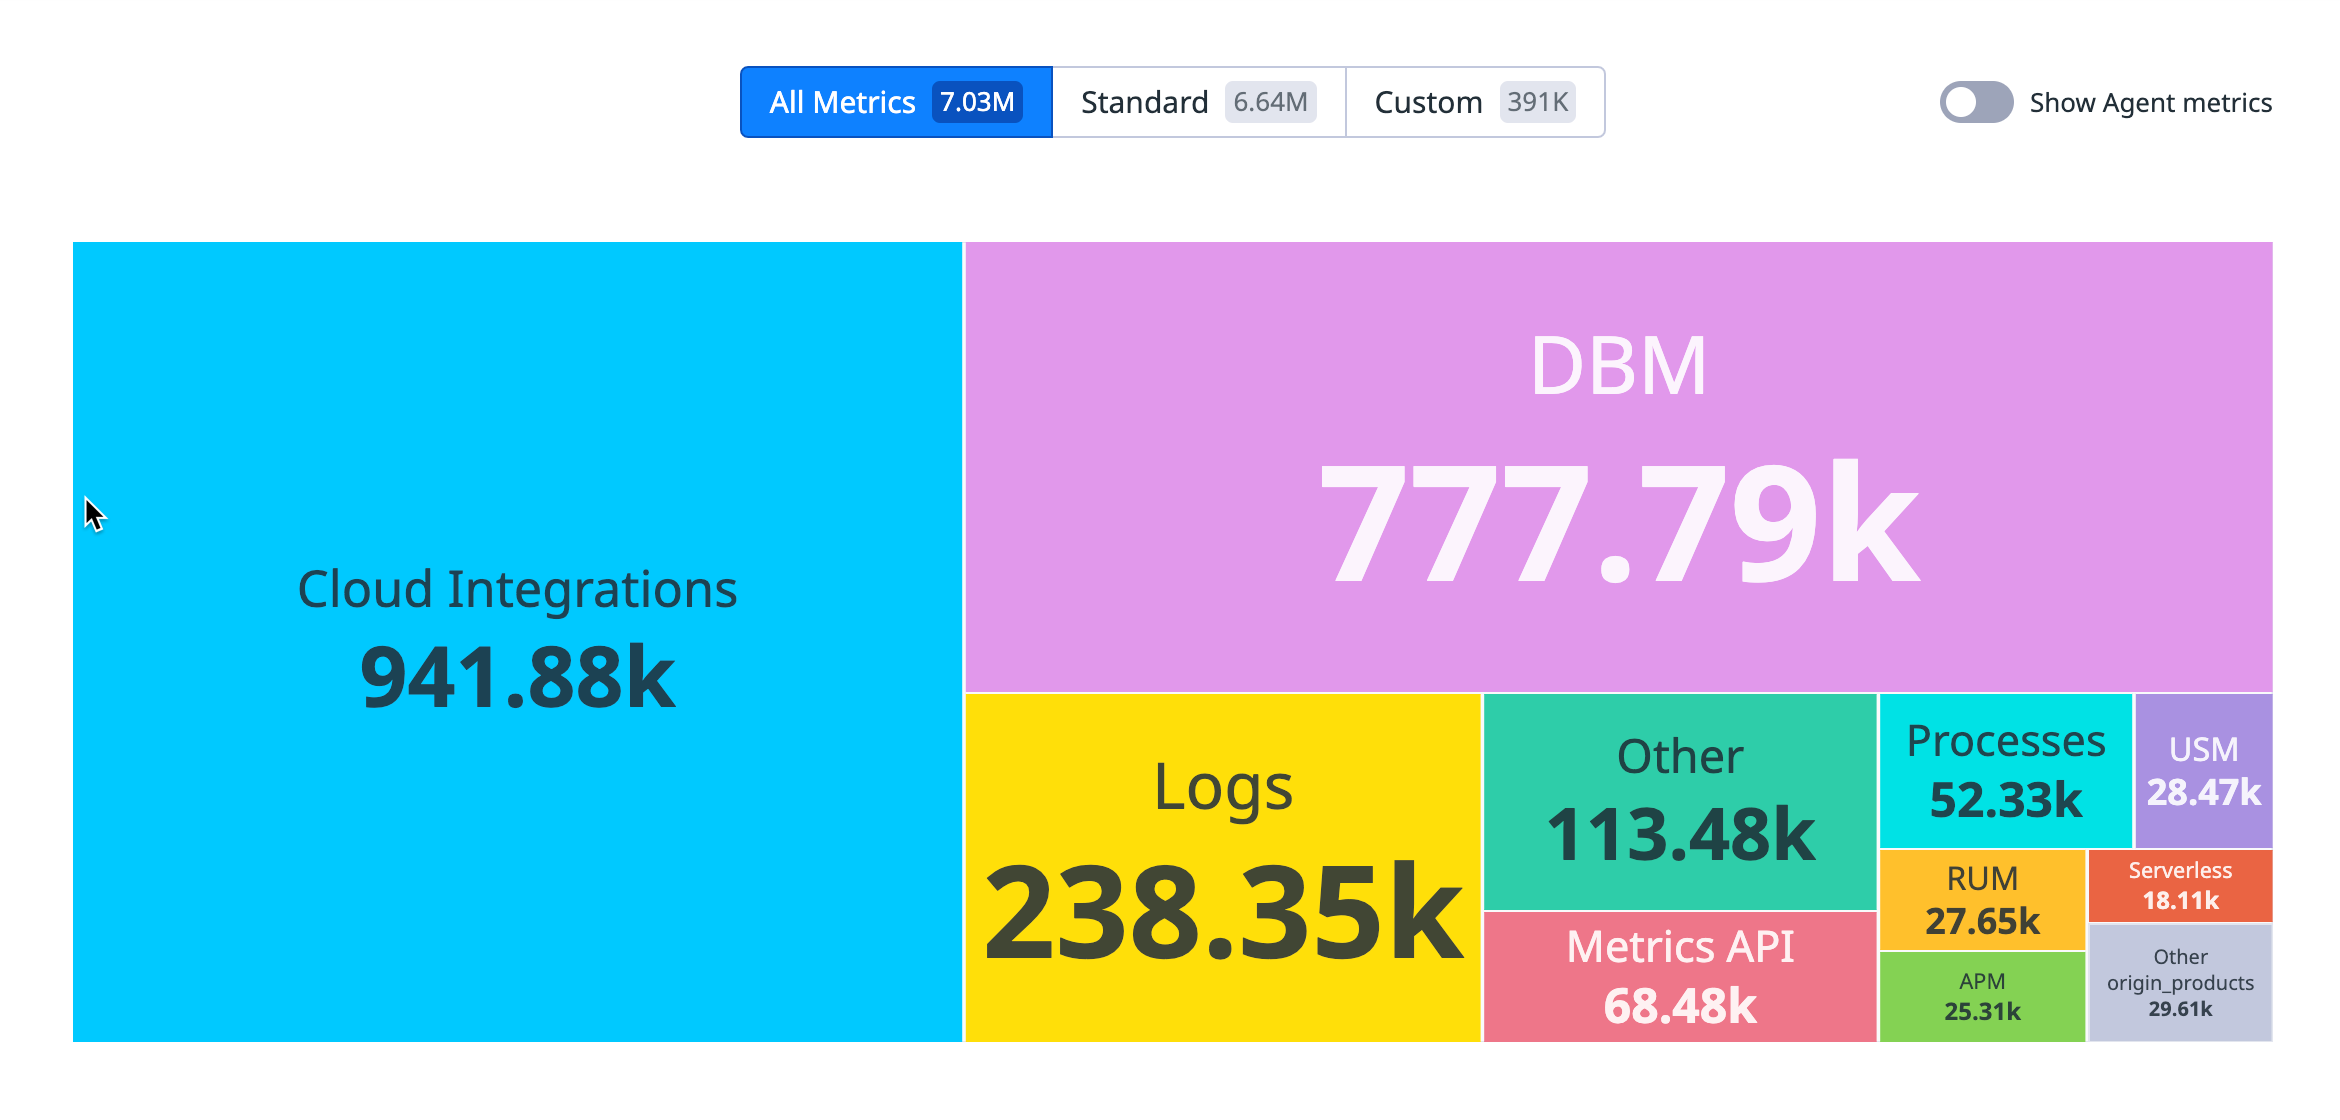
Your metrics by source
This section contains a tree map that outlines your metric sources and their respective volumes.
Generate metrics from any source
Clicking on any of the options below brings you to the corresponding product’s Generate Metrics page, where you can create custom metrics from that product:
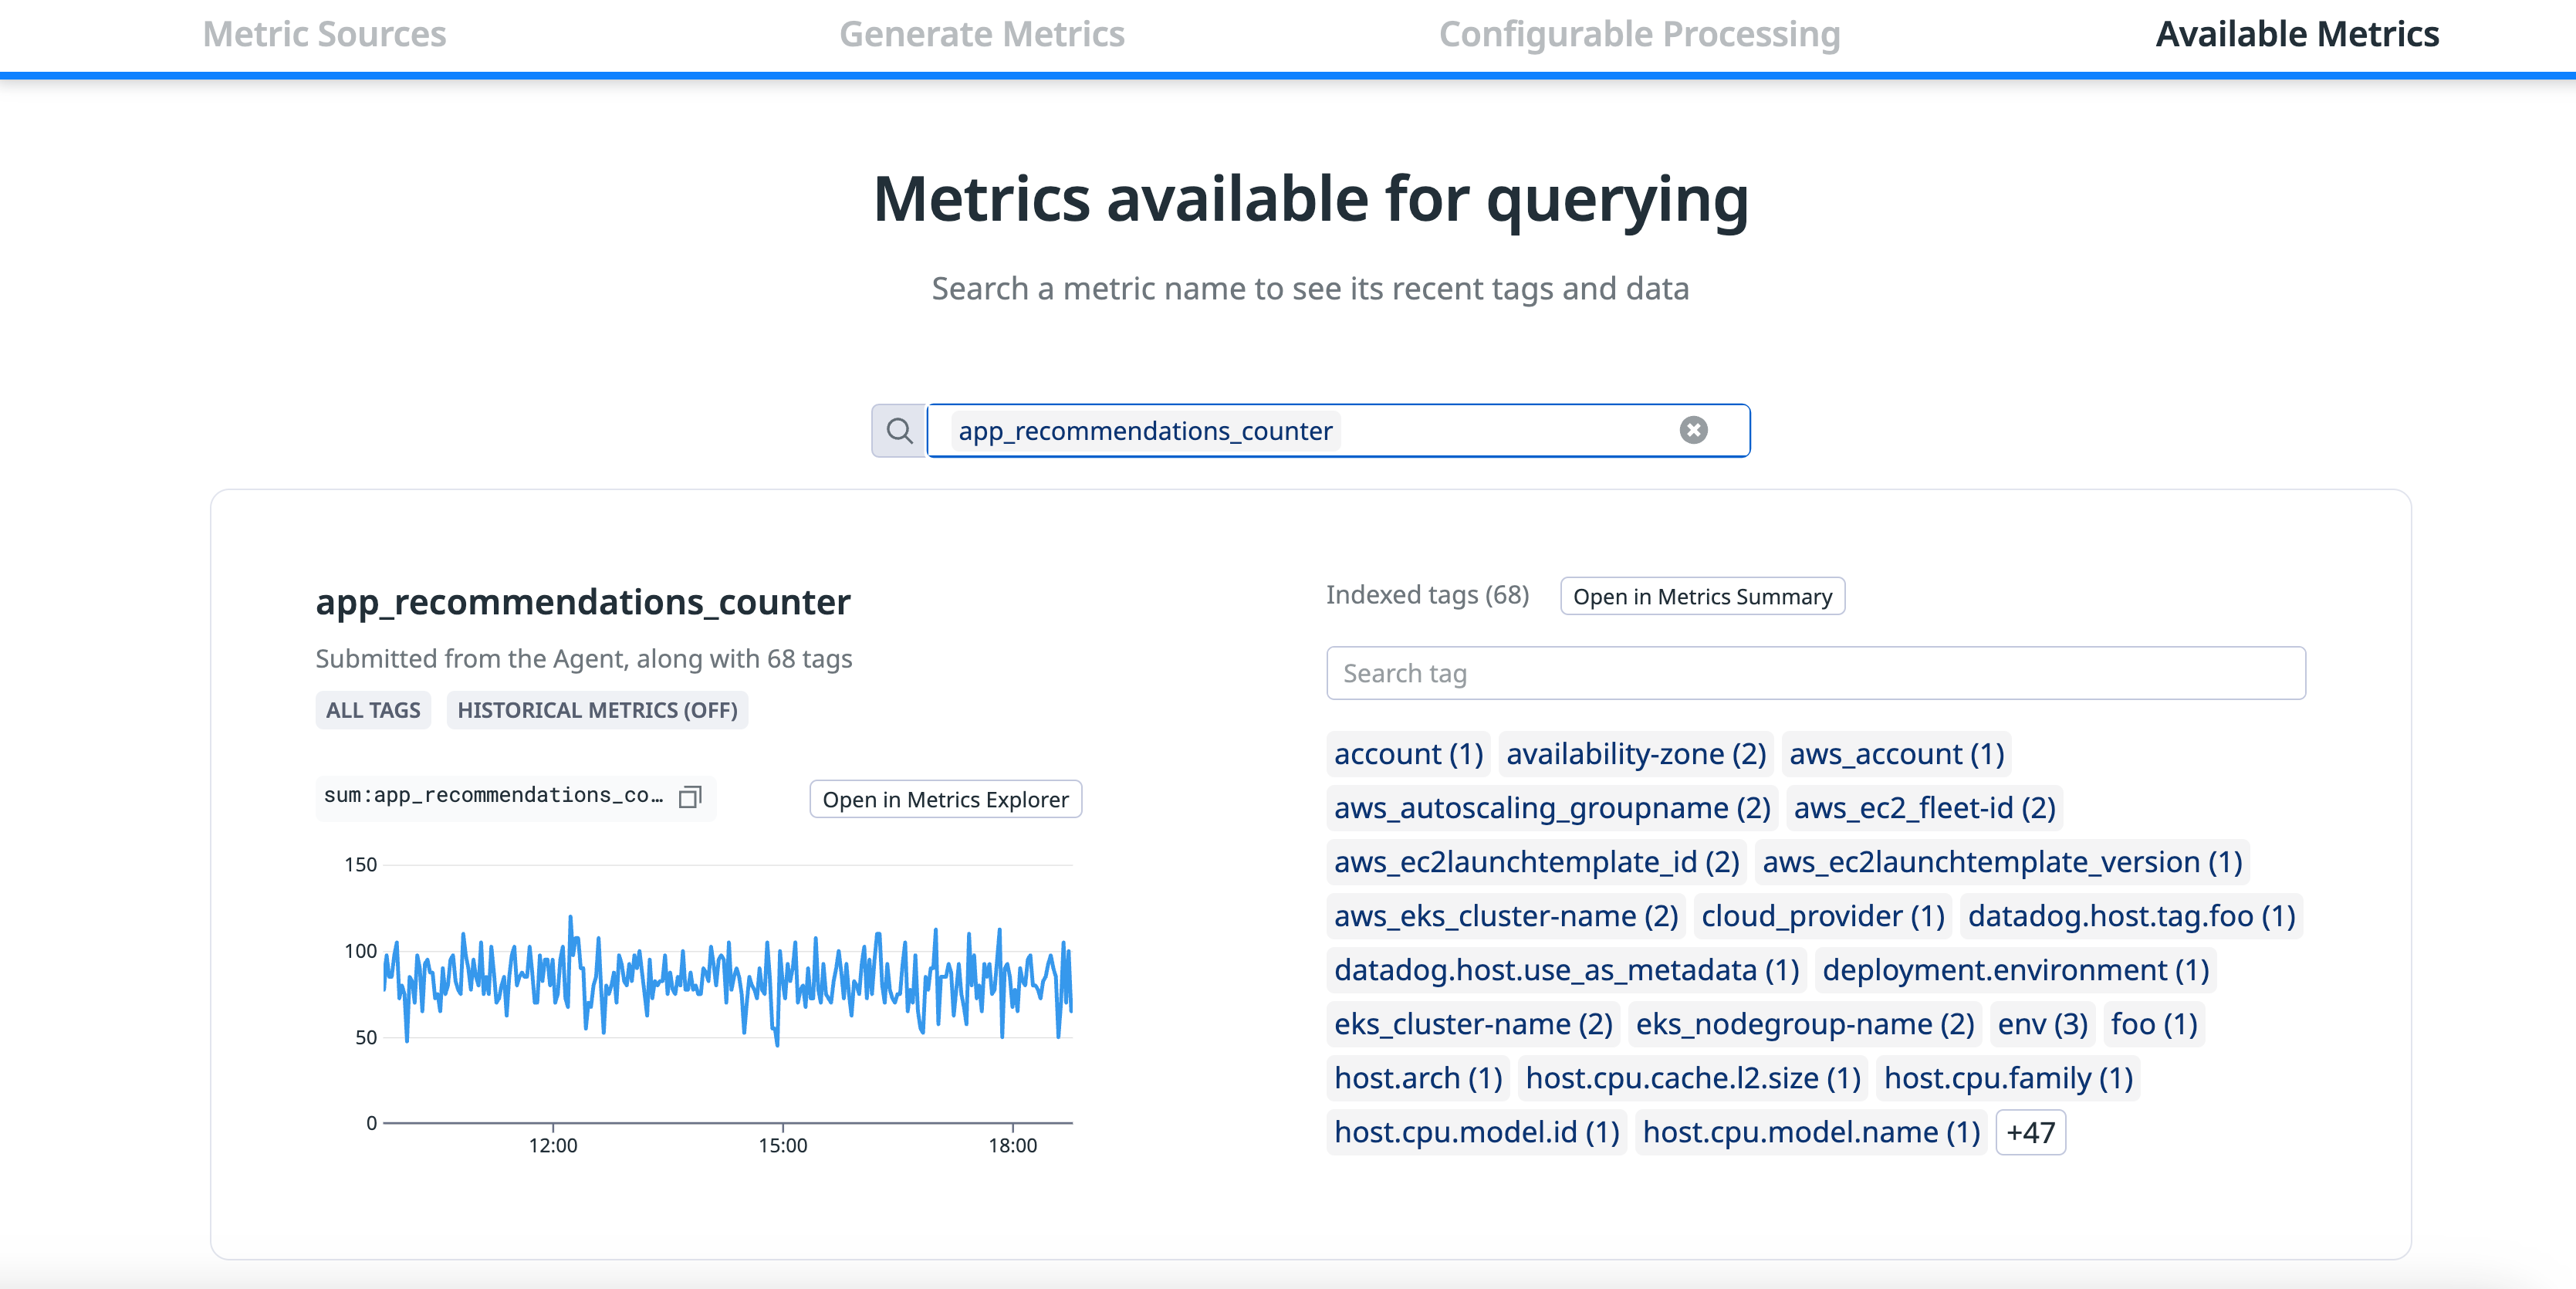
Metrics available for querying
Use the search bar in this section to view the latest data and configuration options of any of your metrics. You can search all its tags, or click to investigate the metric further in the Metrics Explorer or Summary pages.
Further reading
Documentation, liens et articles supplémentaires utiles:


