- Principales informations
- Getting Started
- Agent
- API
- Tracing
- Conteneurs
- Dashboards
- Database Monitoring
- Datadog
- Site Datadog
- DevSecOps
- Incident Management
- Intégrations
- Internal Developer Portal
- Logs
- Monitors
- OpenTelemetry
- Profileur
- Session Replay
- Security
- Serverless for AWS Lambda
- Software Delivery
- Surveillance Synthetic
- Tags
- Workflow Automation
- Learning Center
- Support
- Glossary
- Standard Attributes
- Guides
- Agent
- Intégrations
- Développeurs
- OpenTelemetry
- Administrator's Guide
- API
- Partners
- Application mobile
- DDSQL Reference
- CoScreen
- CoTerm
- Remote Configuration
- Cloudcraft
- In The App
- Dashboards
- Notebooks
- DDSQL Editor
- Reference Tables
- Sheets
- Alertes
- Watchdog
- Métriques
- Bits AI
- Internal Developer Portal
- Error Tracking
- Change Tracking
- Service Management
- Actions & Remediations
- Infrastructure
- Cloudcraft
- Resource Catalog
- Universal Service Monitoring
- Hosts
- Conteneurs
- Processes
- Sans serveur
- Surveillance réseau
- Cloud Cost
- Application Performance
- APM
- Termes et concepts de l'APM
- Sending Traces to Datadog
- APM Metrics Collection
- Trace Pipeline Configuration
- Connect Traces with Other Telemetry
- Trace Explorer
- Recommendations
- Code Origin for Spans
- Observabilité des services
- Endpoint Observability
- Dynamic Instrumentation
- Live Debugger
- Suivi des erreurs
- Sécurité des données
- Guides
- Dépannage
- Profileur en continu
- Database Monitoring
- Agent Integration Overhead
- Setup Architectures
- Configuration de Postgres
- Configuration de MySQL
- Configuration de SQL Server
- Setting Up Oracle
- Setting Up Amazon DocumentDB
- Setting Up MongoDB
- Connecting DBM and Traces
- Données collectées
- Exploring Database Hosts
- Explorer les métriques de requête
- Explorer des échantillons de requêtes
- Exploring Database Schemas
- Exploring Recommendations
- Dépannage
- Guides
- Data Streams Monitoring
- Data Jobs Monitoring
- Data Observability
- Digital Experience
- RUM et Session Replay
- Surveillance Synthetic
- Continuous Testing
- Product Analytics
- Software Delivery
- CI Visibility
- CD Visibility
- Deployment Gates
- Test Visibility
- Code Coverage
- Quality Gates
- DORA Metrics
- Feature Flags
- Securité
- Security Overview
- Cloud SIEM
- Code Security
- Cloud Security Management
- Application Security Management
- Workload Protection
- Sensitive Data Scanner
- AI Observability
- Log Management
- Pipelines d'observabilité
- Log Management
- CloudPrem
- Administration
Best Practices for Custom Metrics Governance
Cette page n'est pas encore disponible en français, sa traduction est en cours.
Si vous avez des questions ou des retours sur notre projet de traduction actuel, n'hésitez pas à nous contacter.
Si vous avez des questions ou des retours sur notre projet de traduction actuel, n'hésitez pas à nous contacter.
Overview
Cloud-based applications can generate massive amounts of data and large observability costs, ultimately placing pressure on organizations to reduce this budget line item. To reduce observability costs, many teams resort to collecting fewer metrics; however, for centralized SRE and observability teams, effective custom metrics governance should increase monitoring efficiency rather than cut visibility entirely.
This guide provides best practices for managing your custom metrics volumes through the three key components of effective metrics governance: Visibility and Attribution, Actionable Custom Metrics Governance, and Monitoring and Prevention. Learn how to use available Datadog tools to maintain cost-effective observability for these key components:
- Find and understand your metrics usage and costs
- Identify your largest cost drivers
- Attribute your largest cost drivers to the teams or services responsible for them
- Reduce costs on less valuable, unused metrics
- Monitor and control usage before incurring billing overages
Check out this interactive walk through of Datadog’s custom metrics governance tools.
Prerequisites
Some product features require Administrator access.
This guide assumes you have an understanding of the following concepts in custom metrics:
Visibility and attribution
The first step for managing your custom metrics volumes and costs is understanding what the key metric costs drivers are and attributing those drivers to their respective owners.
See the steps in this section to review your total account’s monthly metric usage and see a breakdown of your account’s usage by team or by select a tag key.
Account-level visibility
You must have the Datadog Admin Role to access the Plan & Usage page.
The Plan and Usage provides you an out-of-the-box (OOTB) summary of your account’s monthly billable custom metrics usage with detailed insights on your costs, burn rate, and Top Custom Metric names.
- From the Plan & Usage page, scroll down to the Usage Summary section.
- Click the Custom Metrics tab to view your organization’s billable custom metrics usage, usage trends, and top custom metric names.
- Scroll down to the Top Custom Metrics for <MONTH YEAR>, to see the top metric names with their contribution % to your custom metrics costs.
Knowing which metrics are the largest contributor of your account’s monthly usage and costs is the recommended starting point for using Metrics without Limits™. With this knowledge, you can find the source of these metric submissions whether by teams, service, organization, or other tag attribute.
Additionally, review Usage Attribution information for a total breakdown of your account’s billable usage by tag keys. From here, you can identify your largest cost drivers by tags such as team, service, or application.
Note: Usage Attribution is an advanced feature included in the Enterprise plan. For all other plans, contact your account representative or Customer Success to request this feature.
Metric-level visibility
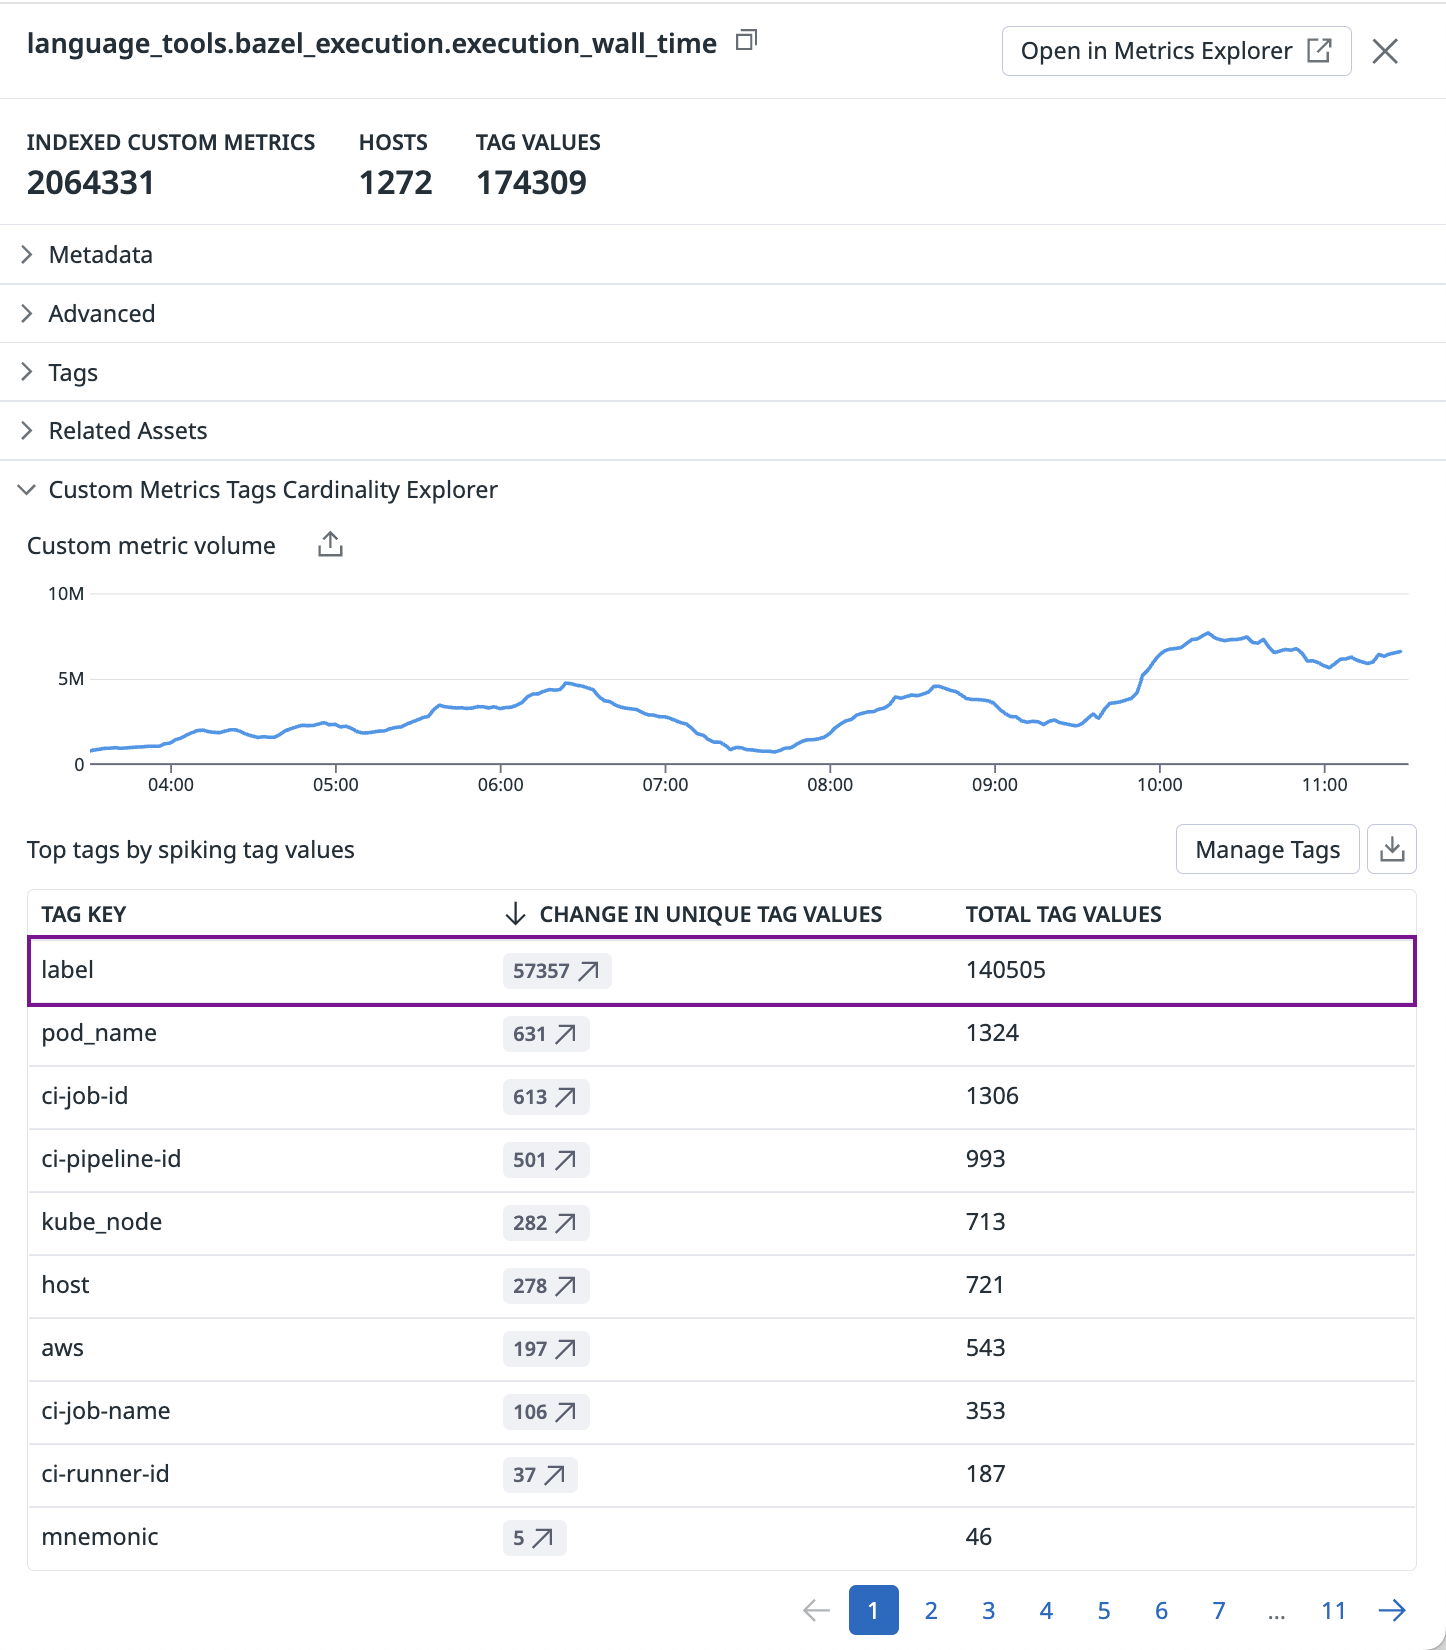
Once you’ve identified which metric names are driving up your account’s monthly usage and costs, you can navigate to the metric’s details side panel to view the Custom Metrics Tags Cardinality Explorer. This shows you which tag keys are driving a particular metric’s cardinality to spike. Any spammy or unbounded tag keys with large increases in the number of unique tag values are the likely cause. Exclude them using Metrics without Limits™ to achieve immediate cost savings.
Team-level visibility and attribution
Team-level visibility enables account administrators to hold teams accountable. More importantly, it gives teams the opportunity to understand and reduce their impact on metrics volume.
Individual teams might have limited insights into the costs of the metrics and tags they’re submitting. This results in teams being less motivated to control their usage or even limit usage growth. It is crucial for everyone to have visibility into their usage and feel empowered to take ownership in managing those volumes and associated costs.
Find the source of your largest custom metrics
You must have the Datadog Admin Role to access the Plan & Usage page.
To identify which team or service is responsible for your top custom metric names:
- From the Plan & Usage page, scroll down to the Usage Summary section.
- Click the Custom Metrics tab to view your organization’s billable usage, usage trends, and top custom metrics.
- Under the table for Top Custom Metrics for
, click the icon to See in Metrics Summary for the top custom metric. This takes you to the Metrics Summary page with the opened metric details side panel. - In the side panel, scroll down to the Tags section to view associated tags such as teams and service.
View your team’s custom metrics
All teams should have visibility into which metrics are driving their bill spikes in real-time and feel confident that their cost optimization efforts do not impact another team’s visibility.
To see all actively reporting metric names submitted by your team, go to the Metrics Summary page, type in the tag key value pair (for example, team:dev or service:demo) in the Filter by Tag Value field.
Identify any team’s metrics that have the biggest impact on your bill
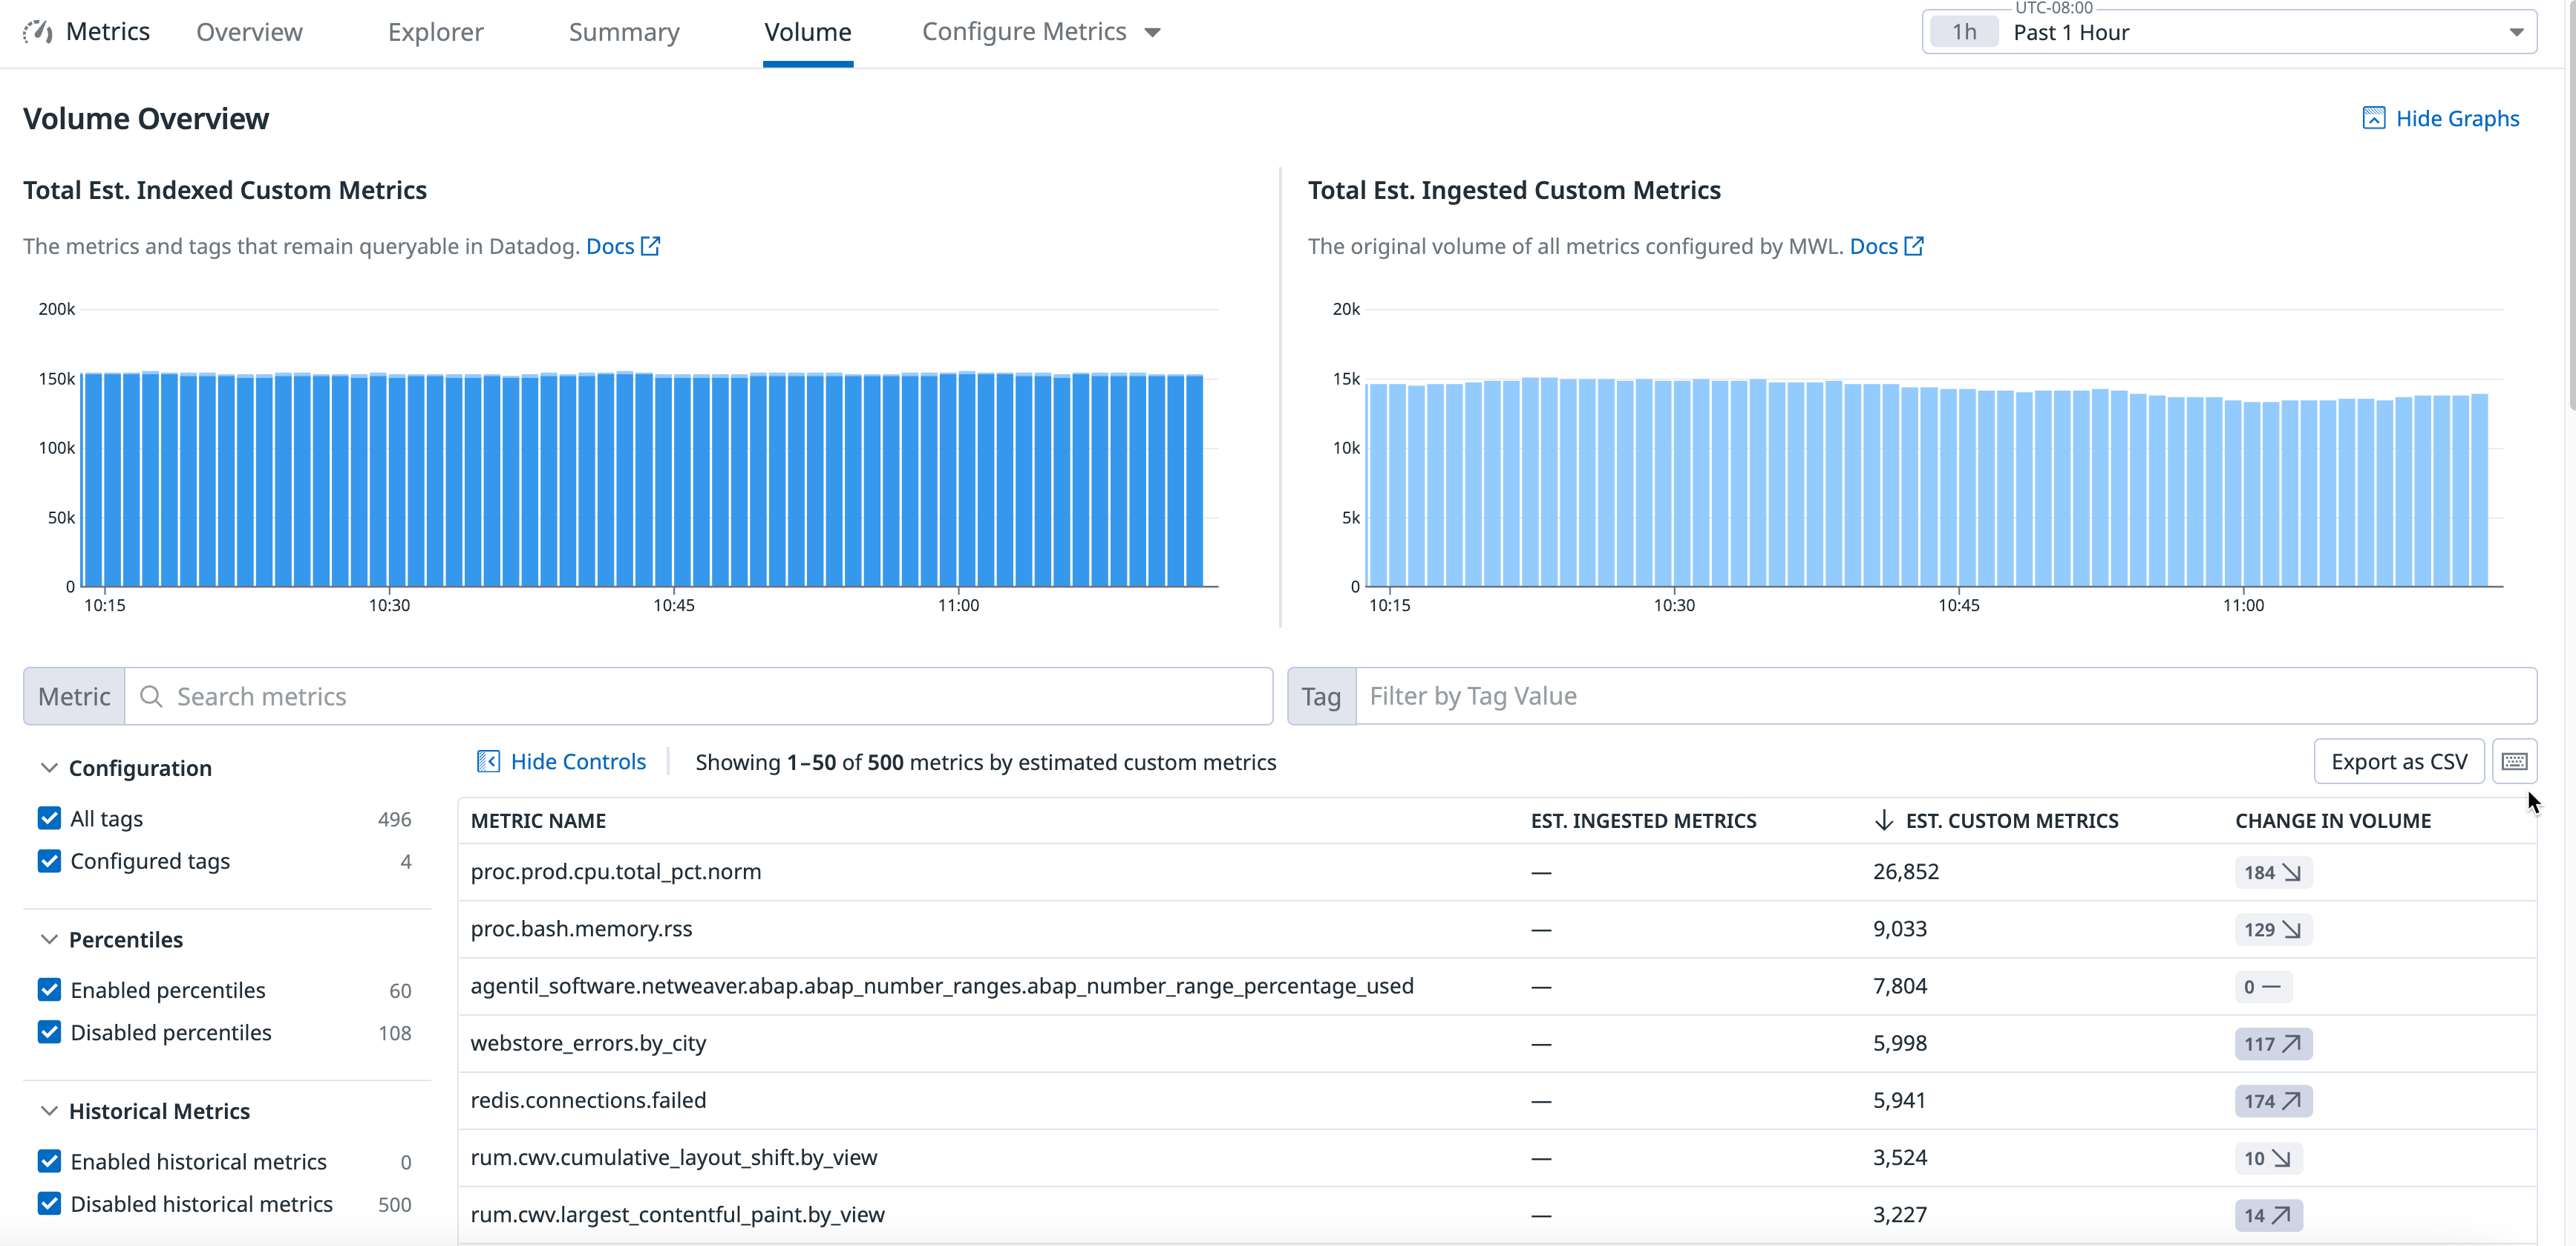
All users in your organization can see OOTB realtime estimated custom metrics usage on the Metrics Volume Management page. Datadog’s intelligent insights help identify which metrics to focus your cost-optimization efforts on. Use Metrics Volume Management with Metrics without Limits™, to control your indexed custom metrics usage and reduce costs without sacrificing accuracy.
With Metrics Volume Management, you can identify your organization’s largest metrics as well as the metric names spiking in volume (likely culprits of any unexpected overage).
For more information, see the Metrics Volume Management documentation.
Value-based metrics governance
Effective custom metrics governance should increase monitoring efficiency. After you understand what your usage is and attribute usage to its source, take action to reduce your metrics.
In this section, learn about the actions you can take to maximize the ROI and value you get from your observability spend without sacrificing the visibility your team actively relies on.
Metrics without Limits™
Datadog’s Metrics without Limits™ is a first in industry cost management feature that decouples metric ingestion from indexing. Not all your metrics are equally valuable at every moment, and with Metrics without Limits™, you only pay for valuable metrics.
Reduce your indexed custom metrics volumes on any metric name by setting a tag configuration that you’d like to preserve for querying. It reduces your cost and preserves the mathematical accuracy of your configured metrics (all within the platform without any code-level changes).
With Metrics without Limits™, Datadog automatically provides the following:
- Up to date recommended tag configurations based on actively queried tags and tags used on assets (powered by our intelligent query insights) to help you maximize the ROI and value you get from your observability spend.
- Intelligent query insights that continuously compute and analyze all users’ interactions (both in-app and through the API) on any metrics submitted to Datadog so that your recommended tag configurations are always relevant.
- Ability to roll back changes at any time to get full visibility into all your originally submitted data.
As part of Datadog’s metrics governance best practices, start by using Metrics without Limits on your Top Custom Metrics.
For more details, see the Metrics without Limits™ documentation.
Prevent unintentional configurations that reduce observability with RBAC
Metrics without Limits™ allows users to reduce costs on metrics by indexing less data. When used incorrectly, the configuration could lead to unintentional spikes in usage or loss of visibility from tags that are no longer indexed. To prevent unexpected changes, use RBAC permissions. You can edit an existing user role to include the metrics_tags_write permission, or create a custom role. This gives your organization better control over which members can impact metrics cardinality and who can change Metrics without Limits™ tag configurations.
Datadog provides an audit trail of all Metrics without Limits™ configurations—detailing the configuration and user that made the configuration—so you can attribute any spikes or dips in your custom metrics usage. To view your audit trail events, enter the following query in the Events Explorer:
tags:audit "Queryable tag configuration"
Reduce costs from unqueried and unused metrics
Unqueried metrics
To ensure you’re not removing valuable visibility while reducing costs, use the Query Activity facet. This lets you differentiate the actively-queried metrics that your team relies on from the metrics that aren’t queried anywhere within Datadog or through the API. Datadog’s intelligent query insights continuously computes and analyzes all users’ interactions (in Datadog or through the API) on any metric to help identify unqueried metrics.
Note: Unqueried metrics might be used in queries on assets (dashboards, notebooks, monitors, and SLOs). They are considered unqueried if the asset is not used within the given time frame.
Unused metrics
You can also reduce costs, without unintended side effects, by using the Related Assets facet. This lets you identify the metrics not being used by any of your assets (dashboards, notebooks, monitors, and SLOs). This lets you make informed decisions about your metric configurations.
Identify all unqueried and unused metrics
Use the Related Assets facet to gain visibility into the metrics that are unused in Datadog, which can help you reduce costs without accidentally breaking any assets. This facet lets you see which metrics are used on your dashboards, notebooks, monitors, and SLOs, allowing you to make informed decisions about your metric configurations.
Identify your organization’s entire list of unqueried and unused metrics:
On the Metrics Summary page, find the Query Activity facet on the left side. Select the time frame of interest (30, 60, or 90 days).
Find the Related Assets facet on the left side, and select Not used in any asset.
Find the Configuration facet on the left side, and select All Tags. The combination of these three facets provides you a list of any metrics that aren’t queried or used on your assets, and which don’t already have a custom tag configuration.
Review the resulting table of metrics names. Are there any patterns or are they submitted from a specific service? Find tags associated with these unqueried metrics.
(Optional) To export this list, click Export as CSV above the metric table.
After you identify the metrics that your developers don’t need, you can safely reduce the custom metrics volumes and associated costs of these unused metrics with Metrics without Limits™.
- At the top of the Metrics Summary page, click the Configure Metrics dropdown menu.
- Select Manage tags to open the Metrics without Limits™ Tag configuration modal to configure multiple metrics in bulk.
- Specify the metric namespace prefix of the metrics you’d like to configure.
- Leave Include tags selected. This includes all tags that have been actively queried on your assets (dashboards, notebooks, monitors, and SLOs), in the Metrics Explorer, or through the API.
- Click Save.
Based on Datadog’s intelligent query insights across thousands of custom metrics customers, we found that using Metrics without Limits™ on unqueried metrics can reduce the average customer’s custom metrics usage by up to 70%.
Understand the relative utility of your metrics
Even though a metric is not queried for the past 30, 60, or 90 days, your teams might still derive value from it for incident management and outage remediation. Conversely, your teams could be underutilizing existing, actively queried metrics. So understanding the relative utility of your metrics is the next recommended step in your governance workflow.
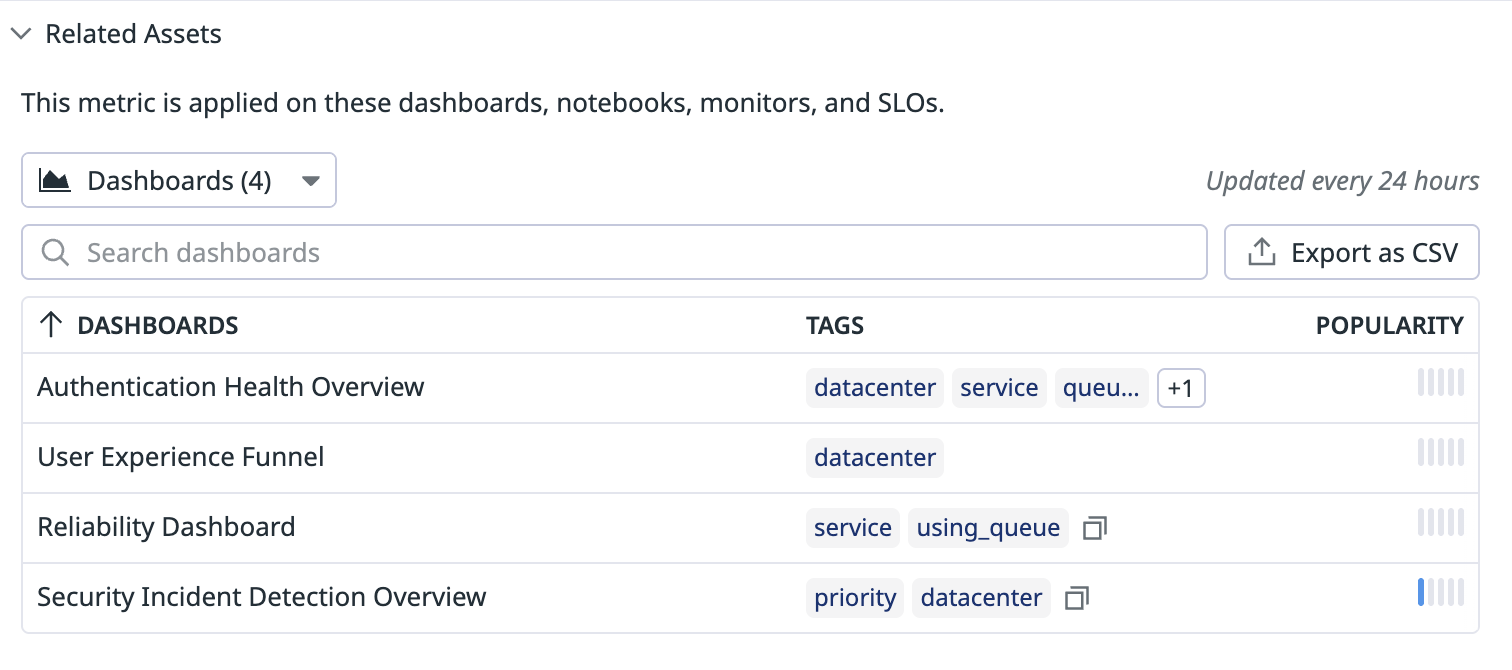
Datadog’s Metrics without Limits™ is a suite of features that also provide you with OOTB insights to assess the value of your actively queried metrics with the Metrics Related Assets side panel. A metrics related asset refers to any Datadog asset, such as a dashboard, notebook, monitor, or SLO that queries a particular metric. Use the Tags column to identify which specific tags are used on assets, ensuring your retain visibility when optimizing with Metrics without Limits™. Use related asset popularity and quantity to evaluate metric utility within your organization, enabling data-driven decisions. Gain a better understanding of how your team can use existing metrics to get more value from your observability spend.
To view a metric’s related assets:
- Click on the metric name to open its details side panel.
- Scroll down to the section of the side panel titled Related Assets.
- Click the dropdown button to view the type of related asset you are interested in (dashboards, monitors, notebooks, SLOs). You can use the search bar to validate specific assets.
Monitoring and prevention
In this section, learn about how to:
- Alert on overages and sudden spikes in your overall account’s custom metrics usage
- Forecast future metrics growth and alert on any unexpected overall deviation
- Alert when a particular metric’s cardinality exceeds a user-defined threshold or anomalously spikes After you have an understanding of your account’s metric usage and the teams responsible for those costs, build monitors to alert you when your custom metrics usage exceeds a certain threshold. Get alerts on spikes in custom metric usage, so you can prevent unintentional bill spikes.
Datadog offers OOTB metrics that measures estimated custom metrics usage. You can use these metrics in your dashboard visualizations and monitor alerts.
| Usage Type | Metric | Description |
|---|---|---|
| Indexed Custom Metrics | datadog.estimated_usage.metrics.custom, datadog.estimated_usage.metrics.custom.by_metric, datadog.estimated_usage.metrics.custom.by_tag | Unique indexed Custom Metrics seen in the last hour. |
| Ingested Custom Metrics | datadog.estimated_usage.metrics.custom.ingested, datadog.estimated_usage.metrics.custom.ingested.by_metric, datadog.estimated_usage.metrics.custom.ingested.by_tag | Unique ingested Custom Metrics seen in the last hour. |
Monitor spikes in custom metric usage to prevent overages
You can also see a breakdown of your realtime estimated custom metrics usage by metric name with either the dashboard timeseries widget, or a metric monitor. Use the datadog.estimated_usage.metrics.custom.by_metric metric to build a monitor so you can always have up-to-date visibility into each of your metric names’ volumes.
Additional monitoring use cases
After you’ve received an alert, use the Metrics Volume Management page to inspect any spiking metrics’ tag keys and use Metrics without Limits™ to immediately drop any anomalous tag keys that are causing your metric to spike. This will ensure you can immediately resolve any unintentional billing spikes.
Additional use cases to build monitors for with the estimated usage metrics:
Summary of best practices
- Start by identifying your largest metric names (your Top Custom Metrics table or the Metrics Volume Page), begin using Metrics without Limits™ to optimize these top metrics to the most cost-effective volume.
- Use the Metrics Volume Management page to attribute any existing custom metrics usage spikes to the top spiking metric names causing that spike.
- For immediate cost savings, identify your unqueried custom metrics and use Metrics without Limits™ to configure these metrics with empty tag configurations.
- Set up monitors on your custom metrics usage using any of Datadog’s OOTB estimated custom metrics usage metrics.
Further reading
Documentation, liens et articles supplémentaires utiles:


