- Principales informations
- Getting Started
- Agent
- API
- Tracing
- Conteneurs
- Dashboards
- Database Monitoring
- Datadog
- Site Datadog
- DevSecOps
- Incident Management
- Intégrations
- Internal Developer Portal
- Logs
- Monitors
- OpenTelemetry
- Profileur
- Session Replay
- Security
- Serverless for AWS Lambda
- Software Delivery
- Surveillance Synthetic
- Tags
- Workflow Automation
- Learning Center
- Support
- Glossary
- Standard Attributes
- Guides
- Agent
- Intégrations
- Développeurs
- OpenTelemetry
- Administrator's Guide
- API
- Partners
- Application mobile
- DDSQL Reference
- CoScreen
- CoTerm
- Remote Configuration
- Cloudcraft
- In The App
- Dashboards
- Notebooks
- DDSQL Editor
- Reference Tables
- Sheets
- Alertes
- Watchdog
- Métriques
- Bits AI
- Internal Developer Portal
- Error Tracking
- Change Tracking
- Service Management
- Actions & Remediations
- Infrastructure
- Cloudcraft
- Resource Catalog
- Universal Service Monitoring
- Hosts
- Conteneurs
- Processes
- Sans serveur
- Surveillance réseau
- Cloud Cost
- Application Performance
- APM
- Termes et concepts de l'APM
- Sending Traces to Datadog
- APM Metrics Collection
- Trace Pipeline Configuration
- Connect Traces with Other Telemetry
- Trace Explorer
- Recommendations
- Code Origin for Spans
- Observabilité des services
- Endpoint Observability
- Dynamic Instrumentation
- Live Debugger
- Suivi des erreurs
- Sécurité des données
- Guides
- Dépannage
- Profileur en continu
- Database Monitoring
- Agent Integration Overhead
- Setup Architectures
- Configuration de Postgres
- Configuration de MySQL
- Configuration de SQL Server
- Setting Up Oracle
- Setting Up Amazon DocumentDB
- Setting Up MongoDB
- Connecting DBM and Traces
- Données collectées
- Exploring Database Hosts
- Explorer les métriques de requête
- Explorer des échantillons de requêtes
- Exploring Database Schemas
- Exploring Recommendations
- Dépannage
- Guides
- Data Streams Monitoring
- Data Jobs Monitoring
- Data Observability
- Digital Experience
- RUM et Session Replay
- Surveillance Synthetic
- Continuous Testing
- Product Analytics
- Software Delivery
- CI Visibility
- CD Visibility
- Deployment Gates
- Test Visibility
- Code Coverage
- Quality Gates
- DORA Metrics
- Feature Flags
- Securité
- Security Overview
- Cloud SIEM
- Code Security
- Cloud Security Management
- Application Security Management
- Workload Protection
- Sensitive Data Scanner
- AI Observability
- Log Management
- Pipelines d'observabilité
- Log Management
- CloudPrem
- Administration
Manage Data Collection
Cette page n'est pas encore disponible en français, sa traduction est en cours.
Si vous avez des questions ou des retours sur notre projet de traduction actuel, n'hésitez pas à nous contacter.
Si vous avez des questions ou des retours sur notre projet de traduction actuel, n'hésitez pas à nous contacter.
Overview
Error Tracking provides fine-grained control of which errors to ingest, helping you reduce noise and avoid unexpected costs.
You can define what data is included in Error Tracking in two ways:
You can configure both rules and rate limits on the Error Tracking > Settings page.
Rules
Rules allow you to select which errors are ingested into Error Tracking. They apply to both billable and non-billable errors.
Each rule consists of:
- A scope: an inclusion filter, which contains a search query, such as
service:my-web-store. - Optionally, one or more nested exclusion filters to further refine the rule and ignore some of the matching events. For example, an exclusion filter might use the
env:stagingquery to exclude staging errors.
An event is included if it matches a rule’s inclusion filter and does not match any of that rule’s exclusion filters. Rules can be toggled on or off.
Events are checked against rules in order. Evaluation stops at the first matching active rule, and subsequent rules are ignored.
Note: Error events that get accepted by a rule might still be excluded from Error Tracking if they lack the required attributes.
How rules are evaluated
The order of your rules determines which rule an event matches. For example, with these two rules:
| Rule | Inclusion filter | Exclusion filter |
|---|---|---|
| 1 | env:prod | service:internal-tools |
| 2 | env:staging | (none) |
| Event | Outcome |
|---|---|
env:prod service:checkout | Rule 1, no exclusion → included |
env:prod service:internal-tools | Rule 1, exclusion matches → excluded |
env:staging service:payments | Rule 2 → included |
env:dev service:checkout | No match → default rule applies |
Example: multiple exclusion filters
Example: multiple exclusion filters
Given a list of rules:
Rule 1:
env:prod- Exclusion filter 1-1:
service:api - Exclusion filter 1-2:
status:warn
- Exclusion filter 1-1:
Rule 2:
service:webRule 3 (disabled):
team:securityRule 4:
service:foo
The processing flow is as follows:
| Event | Outcome |
|---|---|
env:prod service:my-service status:warn | Rule 1, exclusion filter 1-2 matches → excluded |
env:staging service:web | Rule 2 → included |
Default rules
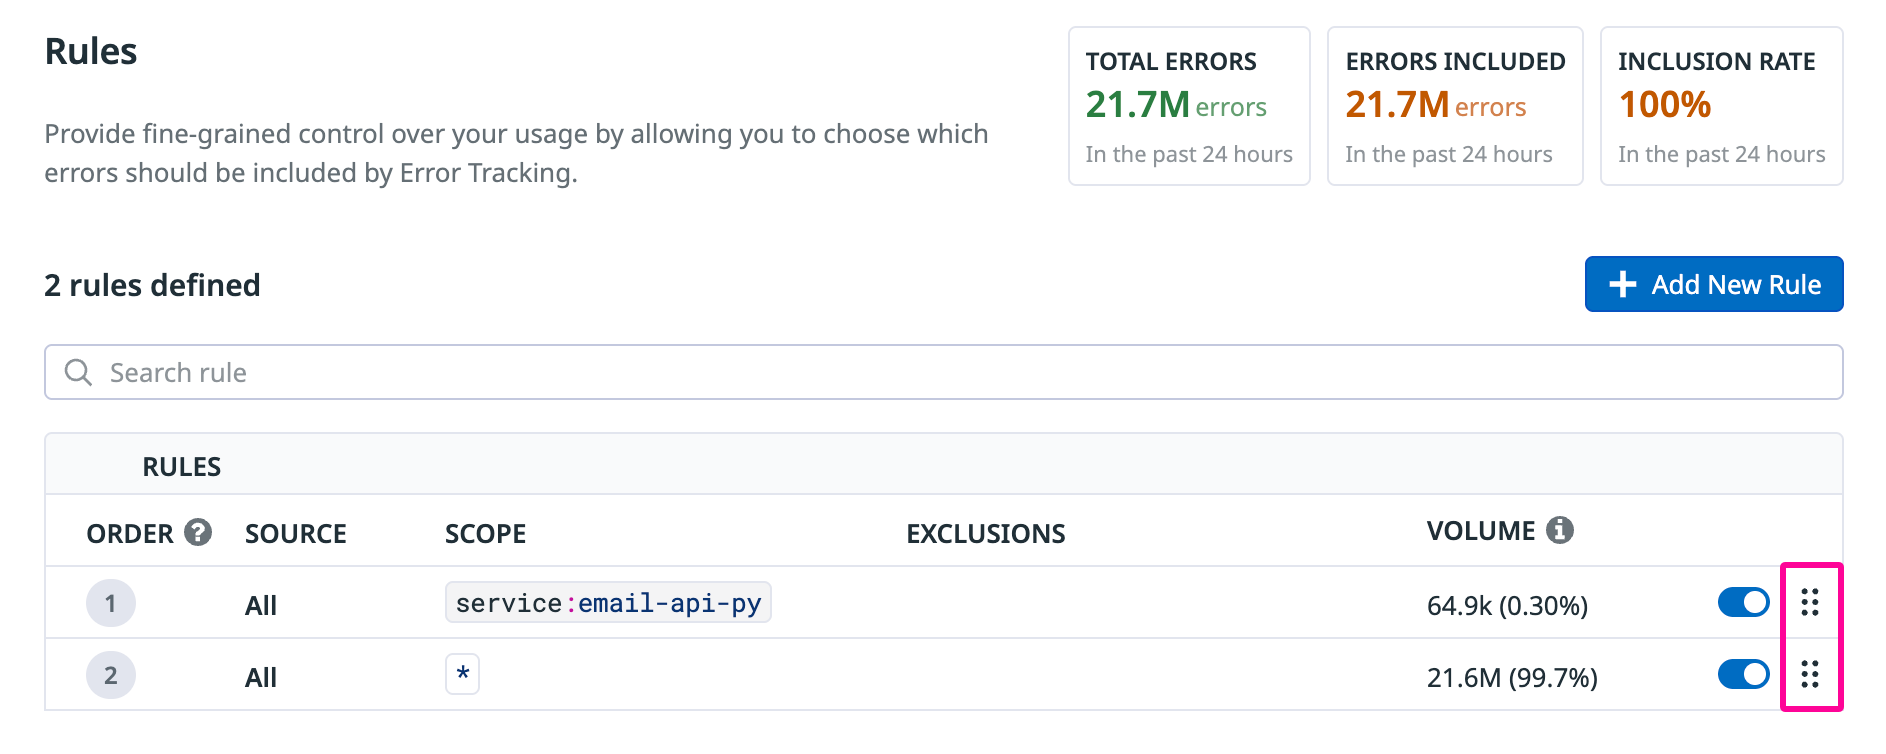
By default, Error Tracking includes an * inclusion filter with no exclusion filters. This catch-all means any event that does not match your other rules is still ingested. To restrict ingestion to specific sources, add exclusion filters to the default rule, or remove it and replace it with explicit inclusion rules.
Add a rule
To add a rule (inclusion filter):
- Navigate to Error Tracking Settings.
- Click Add New Rule.
- Choose the Error Tracking source the rule should be applied to.
- Enter a search query in the Define scope field.
- Optionally, Add Exclusion filters and a description to the rule.
- Click Save Changes
- Optionally, reorder the rules to change their evaluation order. Click and drag the six-dot icon on a given rule to move the rule up or down in the list.
Rate limits
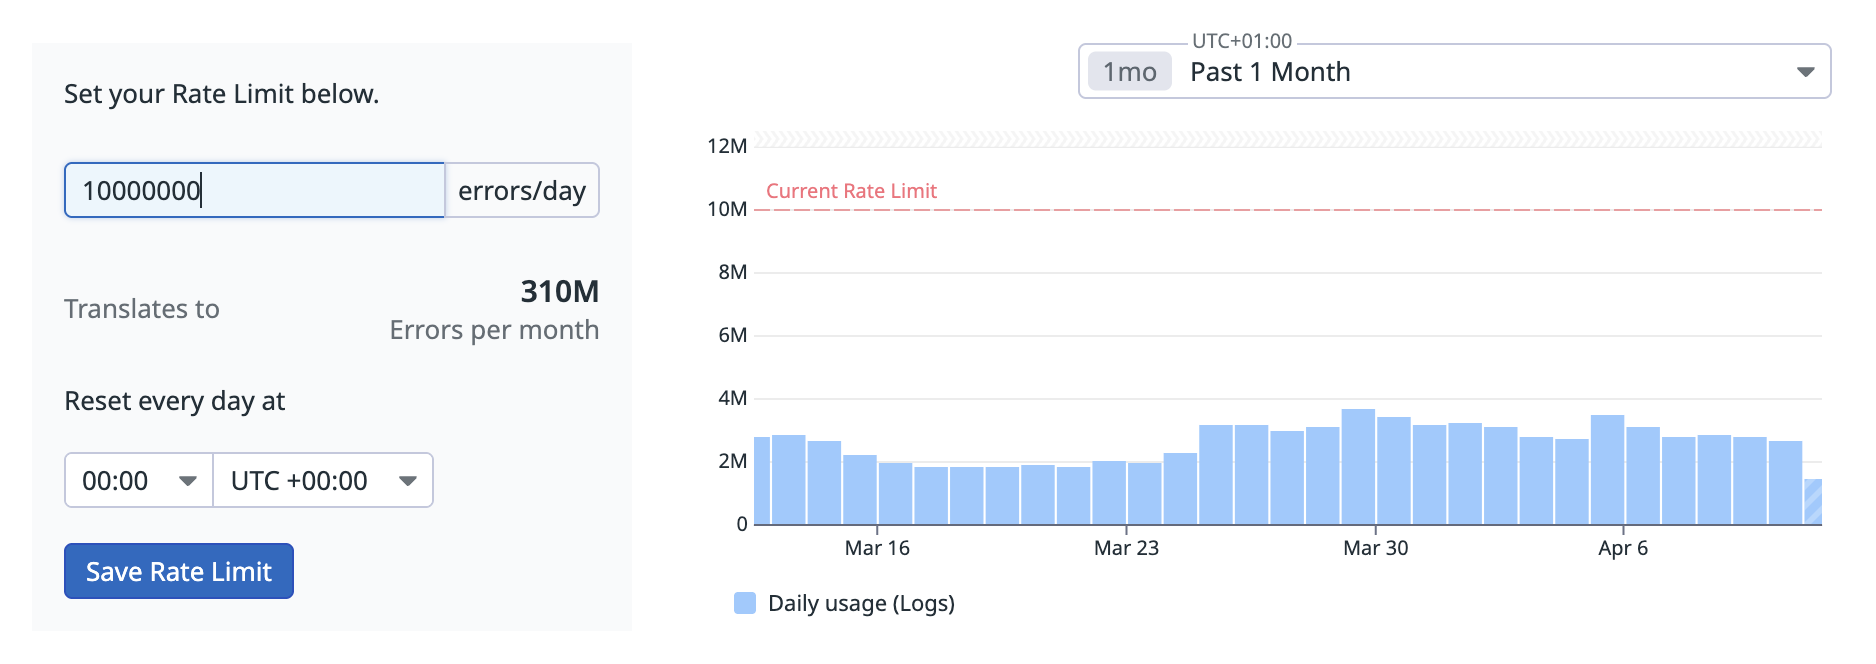
Rate limits allow you to control the number of billable errors included in Error Tracking per day. This cap applies to all errors that match the filters of a rule.
After the daily cap is reached, ingestion stops until the next day. You can modify or remove the cap at any time.
Set a rate limit
To set a rate limit:
- Navigate to Error Tracking > Settings.
- Click Rate Limits.
- Edit the errors/day field.
- Click Save Rate Limit.
A Rate limit applied event is generated when you reach the rate limit. See the Event Management documentation for details on viewing and using events.
Monitoring usage
You can monitor your Error Tracking on Logs usage by setting up monitors and alerts for the datadog.estimated_usage.error_tracking.logs.events metric, which tracks the number of ingested error logs.
This metric is available by default at no additional cost, and its data is retained for 15 months.
Dynamic Sampling
Because Error Tracking billing is based on the number of errors, large increases in the errors for a single issue can quickly consume your Error Tracking budget. Dynamic Sampling protects you by establishing a threshold for the error rate per issue based on your daily rate limit and historical error volumes, sampling errors when that threshold is reached. Dynamic Sampling automatically deactivates when the error rate of your issue decreases below the given threshold.
Setup
Dynamic Sampling is automatically enabled with Error Tracking with a default intake threshold based on your daily rate limit and historical volume.
For best results, set up a daily rate limit on the Error Tracking Rate Limits page: Click Edit Rate Limit and enter a new value.
Disable Dynamic Sampling
Dynamic Sampling can be disabled on the Error Tracking Settings page.
Monitor Dynamic Sampling
A Dynamic Sampling activated event is generated when Dynamic Sampling is applied to an issue. See the Event Management documentation for details on viewing and using events.
Investigation and mitigation steps
When Dynamic Sampling is applied, the following steps are recommended:
- Check which issue is consuming your quota. The issue to which Dynamic Sampling is applied is linked in the event generated in Event Management.
- If you’d like to collect additional samples for this issue, raise your daily quota on the Error Tracking Rate Limits page.
- If you’d like to avoid collecting samples for this issue in the future, consider creating an exclusion filter to prevent additional events from being ingested into Error Tracking.
Further Reading
Documentation, liens et articles supplémentaires utiles:


