upstash.db.totaldatasize
(gauge) | The size of total data that you stored.
Shown as unit |
upstash.db.missrate
(rate) | Miss rate of read requests.
Shown as miss |
upstash.db.hitrate
(rate) | Hit rate of read requests.
Shown as hit |
upstash.db.writelatencyp99
(gauge) | Write latency details p99 in ms.
Shown as millisecond |
upstash.db.readlatencyp99
(gauge) | Read latency details p99 in ms.
Shown as millisecond |
upstash.db.dailybandwidth
(gauge) | Daily bandwidth usage.
Shown as unit |
upstash.db.monthlycost
(gauge) | Monthly cost of database.
Shown as unit |
upstash.db.dailyprocessedcommands
(gauge) | Number of daily processed commands.
Shown as unit |
upstash.db.dailywritecommands
(gauge) | Number of daily write commands.
Shown as unit |
upstash.db.dailyreadcommands
(gauge) | Number of daily read commands.
Shown as unit |
upstash.db.throughput
(gauge) | Database throughput metric.
Shown as unit |
upstash.db.readpersecond
(gauge) | Read per second metric.
Shown as unit |
upstash.db.writepersecond
(gauge) | Write per second metric.
Shown as unit |
upstash.db.keyspace
(gauge) | Database keyspace metric.
Shown as unit |
upstash.db.connections
(gauge) | Database connection count.
Shown as connection |
upstash.db.restconnections
(gauge) | Database rest connection count.
Shown as connection |
upstash.kafkacluster.daily_storage
(gauge) | [Deprecated] The size of total data that you stored.
Shown as unit |
upstash.kafkacluster.total_throughput
(gauge) | [Deprecated] Kafka Cluster Total throughput metric.
Shown as unit |
upstash.kafkacluster.consume_throughput
(gauge) | [Deprecated] Kafka Cluster Consume throughput metric.
Shown as unit |
upstash.kafkacluster.produce_throughput
(gauge) | [Deprecated] Kafka Cluster Produce throughput metric.
Shown as unit |
upstash.kafkacluster.monthly_cost
(gauge) | [Deprecated] Number of monthly cost per Kafka Cluster.
Shown as unit |
upstash.kafkacluster.consumed_daily_messages
(gauge) | [Deprecated] Number of daily consumed messages per Kafka Cluster.
Shown as unit |
upstash.kafkacluster.produced_daily_messages
(gauge) | [Deprecated] Number of daily produced messages to Kafka Cluster.
Shown as unit |
upstash.kafkacluster.consumed_monthly_messages
(gauge) | [Deprecated] Number of monthly consumed messages per Kafka Cluster.
Shown as unit |
upstash.kafkacluster.produced_monthly_messages
(gauge) | [Deprecated] Number of monthly produced messages to Kafka Cluster.
Shown as unit |
upstash.kafkacluster.replication
(gauge) | [Deprecated] Replication count of certain Kafka Cluster.
Shown as unit |
upstash.kafkacluster.topic_count
(gauge) | [Deprecated] Topic count of certain Kafka Cluster.
Shown as unit |
upstash.kafkacluster.partitions_count
(gauge) | [Deprecated] Partition count of Kafka Cluster.
Shown as unit |
upstash.topic.daily_produced
(gauge) | [Deprecated] The size of total data that you stored.
Shown as unit |
upstash.topic.daily_consumed
(gauge) | [Deprecated] The size of total data consumed by certain Kafka topic.
Shown as unit |
upstash.topic.daily_bytes
(gauge) | [Deprecated] The amount of byte transmitted by certain Kafka topics.
Shown as unit |
upstash.topic.monthly_produced
(gauge) | [Deprecated] The amount of byte produced by certain Kafka topics.
Shown as unit |
upstash.topic.monthly_consumed
(gauge) | [Deprecated] The amount of byte consumed by certain Kafka topics.
Shown as unit |
upstash.topic.monthly_bytes
(gauge) | [Deprecated] The amount of byte transmitted for certain Kafka topics.
Shown as unit |
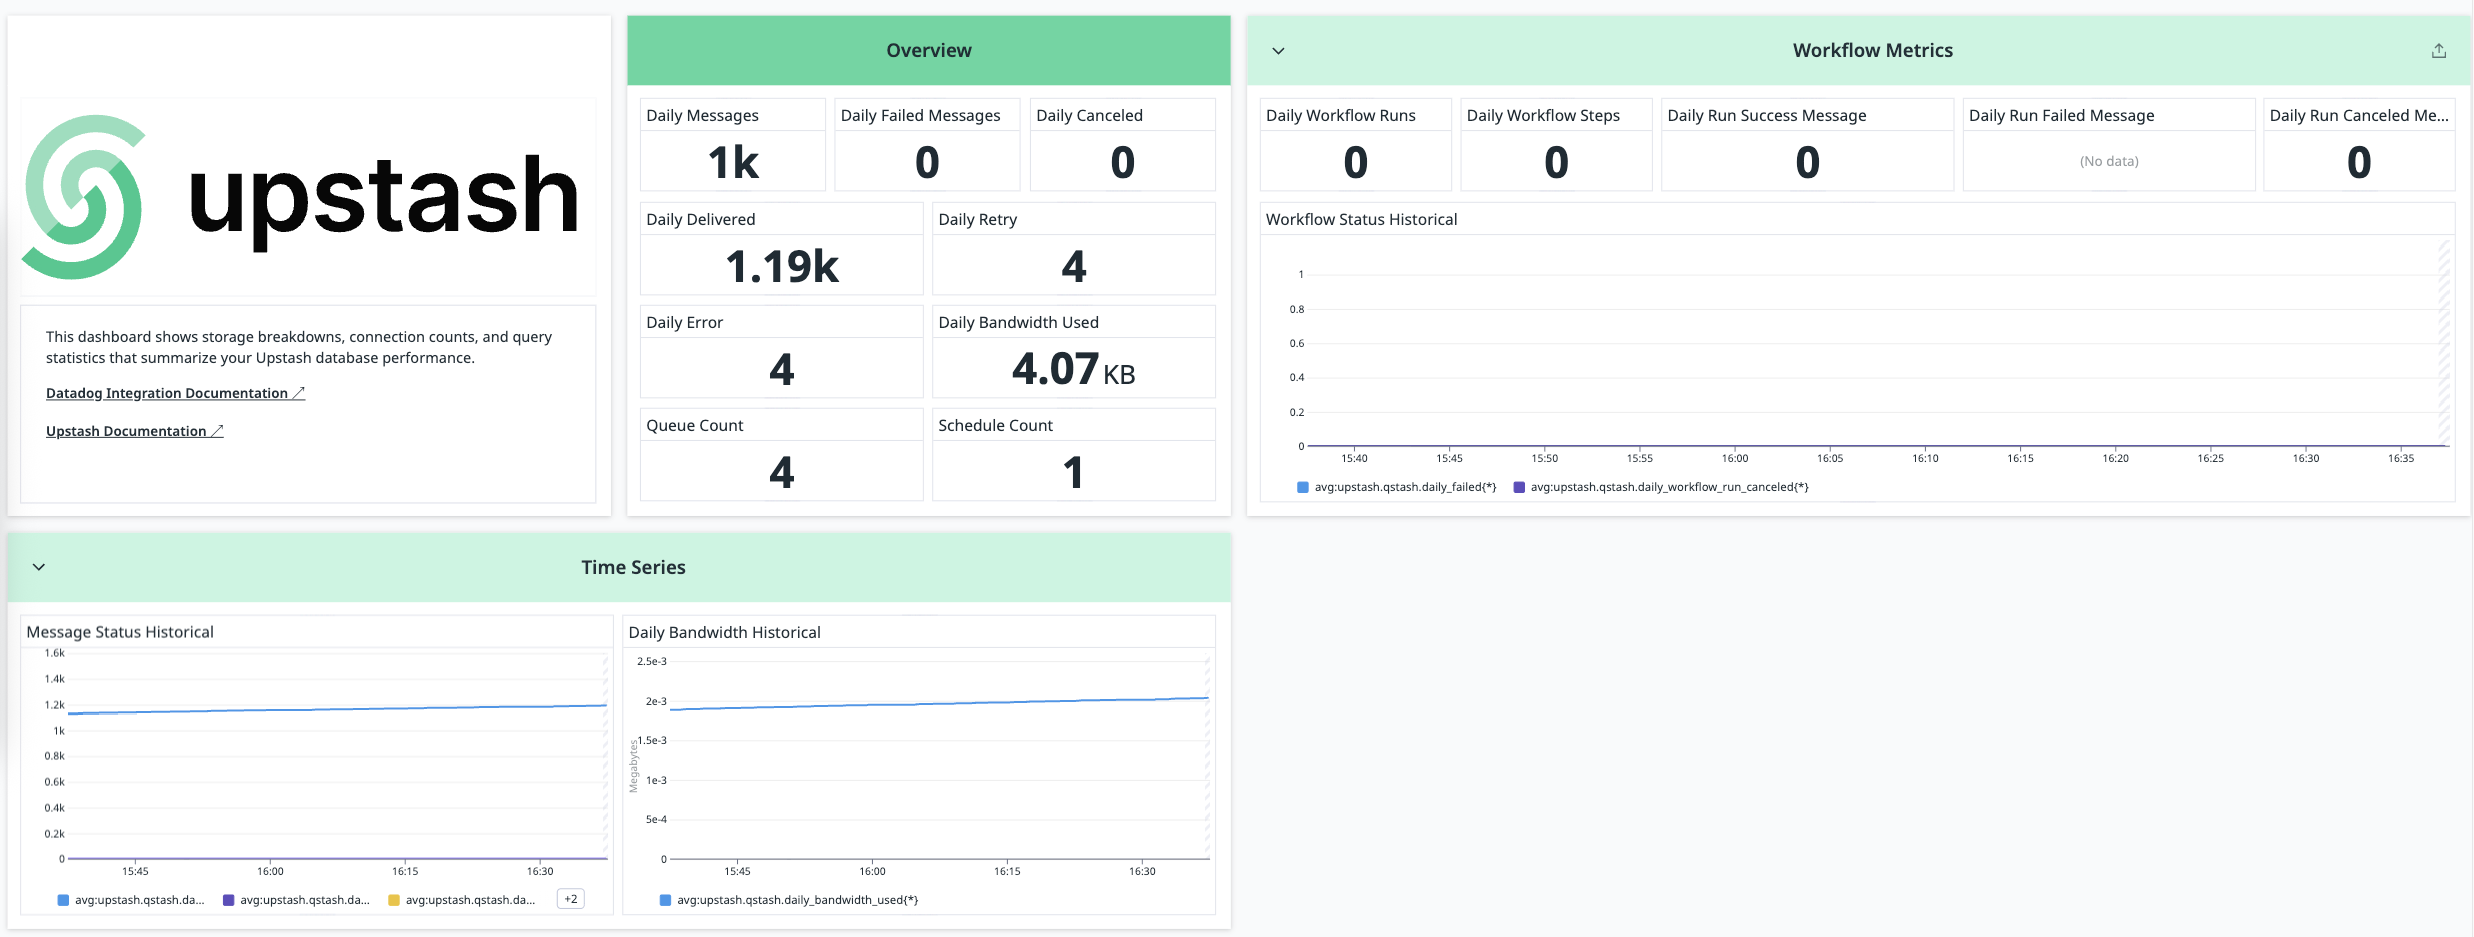
upstash.qstash.daily_messages
(gauge) | Number of daily requests.
Shown as unit |
upstash.qstash.daily_delivered
(gauge) | Number of daily delivered messages.
Shown as unit |
upstash.qstash.daily_canceled
(gauge) | Number of daily canceled messages.
Shown as unit |
upstash.qstash.daily_error
(gauge) | Number of daily error messages.
Shown as unit |
upstash.qstash.daily_retry
(gauge) | Number of daily retries.
Shown as unit |
upstash.qstash.daily_failed
(gauge) | Number of daily failed messages.
Shown as unit |
upstash.qstash.daily_workflow_runs
(gauge) | Number of daily workflow runs.
Shown as unit |
upstash.qstash.daily_workflow_steps
(gauge) | Number of daily workflow steps.
Shown as unit |
upstash.qstash.daily_workflow_run_success
(gauge) | Number of daily successful workflow runs.
Shown as unit |
upstash.qstash.daily_workflow_run_canceled
(gauge) | Number of daily canceled workflow runs.
Shown as unit |
upstash.qstash.daily_workflow_run_failed
(gauge) | Number of daily failed workflow runs.
Shown as unit |
upstash.qstash.daily_bandwidth_used
(gauge) | Daily bandwidth usage.
Shown as unit |
upstash.qstash.schedule_count
(gauge) | Number of active schedules.
Shown as unit |
upstash.qstash.topic_count
(gauge) | Number of active topics.
Shown as unit |
upstash.qstash.queue_count
(gauge) | Number of active queues.
Shown as unit |
upstash.qstash.dlq_message_count
(gauge) | Number of messages in DLQ.
Shown as unit |
upstash.metadata.metric_publish
(gauge) | The healthcheck metrics for upstash integration.
Shown as unit |