- Principales informations
- Getting Started
- Agent
- API
- Tracing
- Conteneurs
- Dashboards
- Database Monitoring
- Datadog
- Site Datadog
- DevSecOps
- Incident Management
- Intégrations
- Internal Developer Portal
- Logs
- Monitors
- OpenTelemetry
- Profileur
- Session Replay
- Security
- Serverless for AWS Lambda
- Software Delivery
- Surveillance Synthetic
- Tags
- Workflow Automation
- Learning Center
- Support
- Glossary
- Standard Attributes
- Guides
- Agent
- Intégrations
- Développeurs
- OpenTelemetry
- Administrator's Guide
- API
- Partners
- Application mobile
- DDSQL Reference
- CoScreen
- CoTerm
- Remote Configuration
- Cloudcraft
- In The App
- Dashboards
- Notebooks
- DDSQL Editor
- Reference Tables
- Sheets
- Alertes
- Watchdog
- Métriques
- Bits AI
- Internal Developer Portal
- Error Tracking
- Change Tracking
- Service Management
- Actions & Remediations
- Infrastructure
- Cloudcraft
- Resource Catalog
- Universal Service Monitoring
- Hosts
- Conteneurs
- Processes
- Sans serveur
- Surveillance réseau
- Cloud Cost
- Application Performance
- APM
- Termes et concepts de l'APM
- Sending Traces to Datadog
- APM Metrics Collection
- Trace Pipeline Configuration
- Connect Traces with Other Telemetry
- Trace Explorer
- Recommendations
- Code Origin for Spans
- Observabilité des services
- Endpoint Observability
- Dynamic Instrumentation
- Live Debugger
- Suivi des erreurs
- Sécurité des données
- Guides
- Dépannage
- Profileur en continu
- Database Monitoring
- Agent Integration Overhead
- Setup Architectures
- Configuration de Postgres
- Configuration de MySQL
- Configuration de SQL Server
- Setting Up Oracle
- Setting Up Amazon DocumentDB
- Setting Up MongoDB
- Connecting DBM and Traces
- Données collectées
- Exploring Database Hosts
- Explorer les métriques de requête
- Explorer des échantillons de requêtes
- Exploring Database Schemas
- Exploring Recommendations
- Dépannage
- Guides
- Data Streams Monitoring
- Data Jobs Monitoring
- Data Observability
- Digital Experience
- RUM et Session Replay
- Surveillance Synthetic
- Continuous Testing
- Product Analytics
- Software Delivery
- CI Visibility
- CD Visibility
- Deployment Gates
- Test Visibility
- Code Coverage
- Quality Gates
- DORA Metrics
- Feature Flags
- Securité
- Security Overview
- Cloud SIEM
- Code Security
- Cloud Security Management
- Application Security Management
- Workload Protection
- Sensitive Data Scanner
- AI Observability
- Log Management
- Pipelines d'observabilité
- Log Management
- CloudPrem
- Administration
suricata
Supported OS
Intégration2.2.0
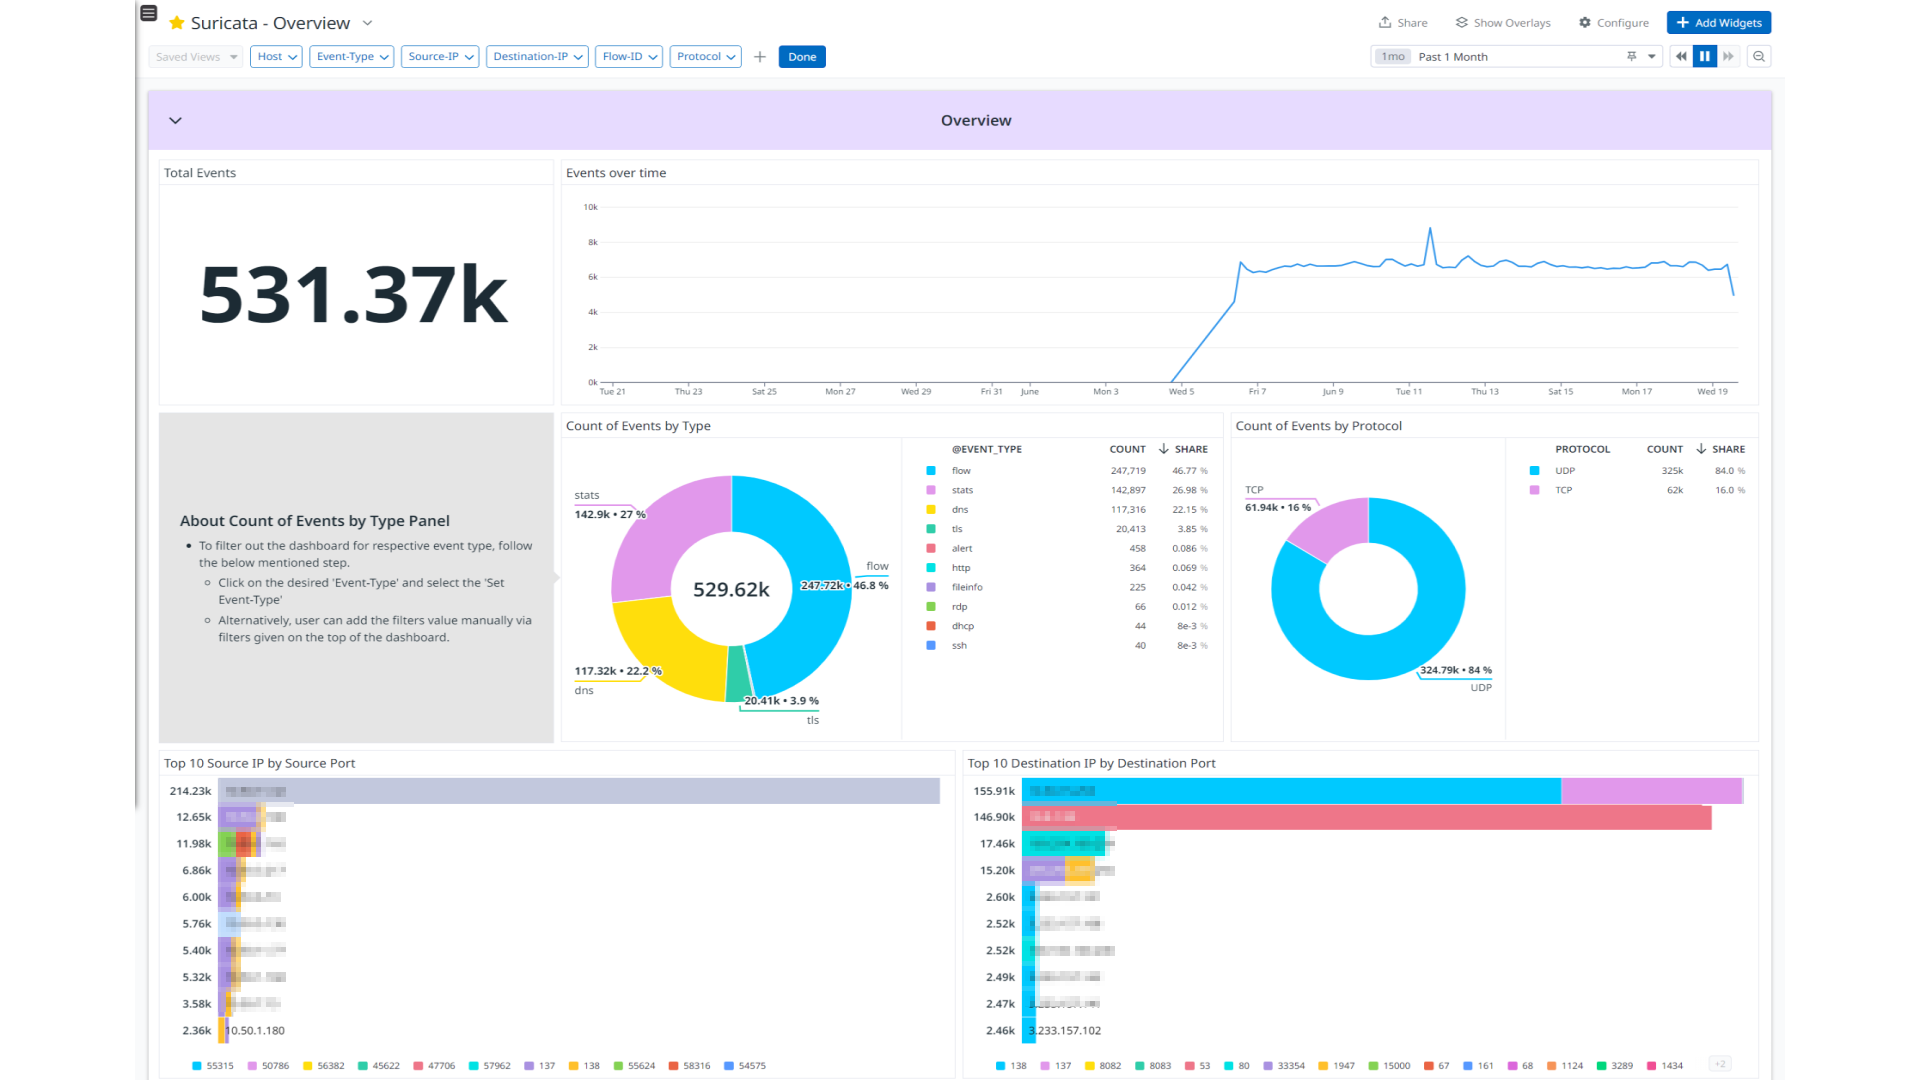
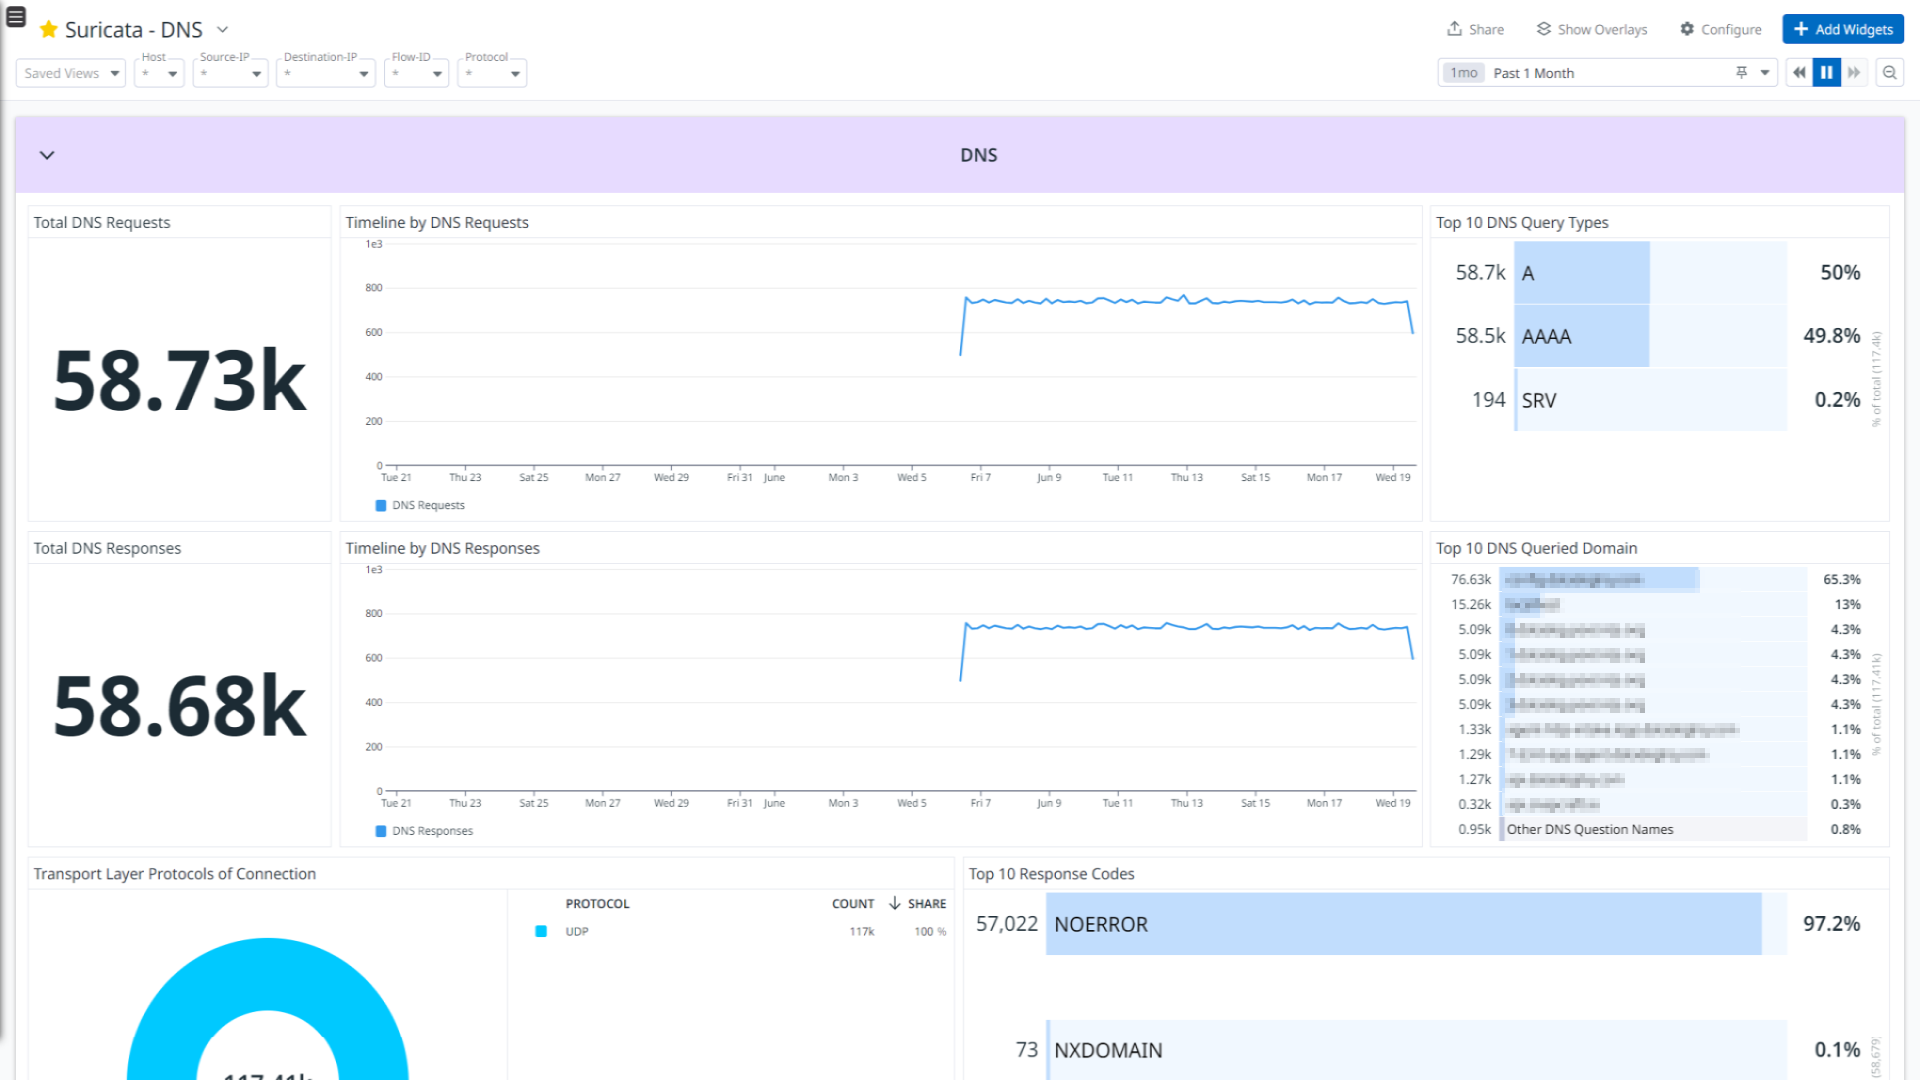
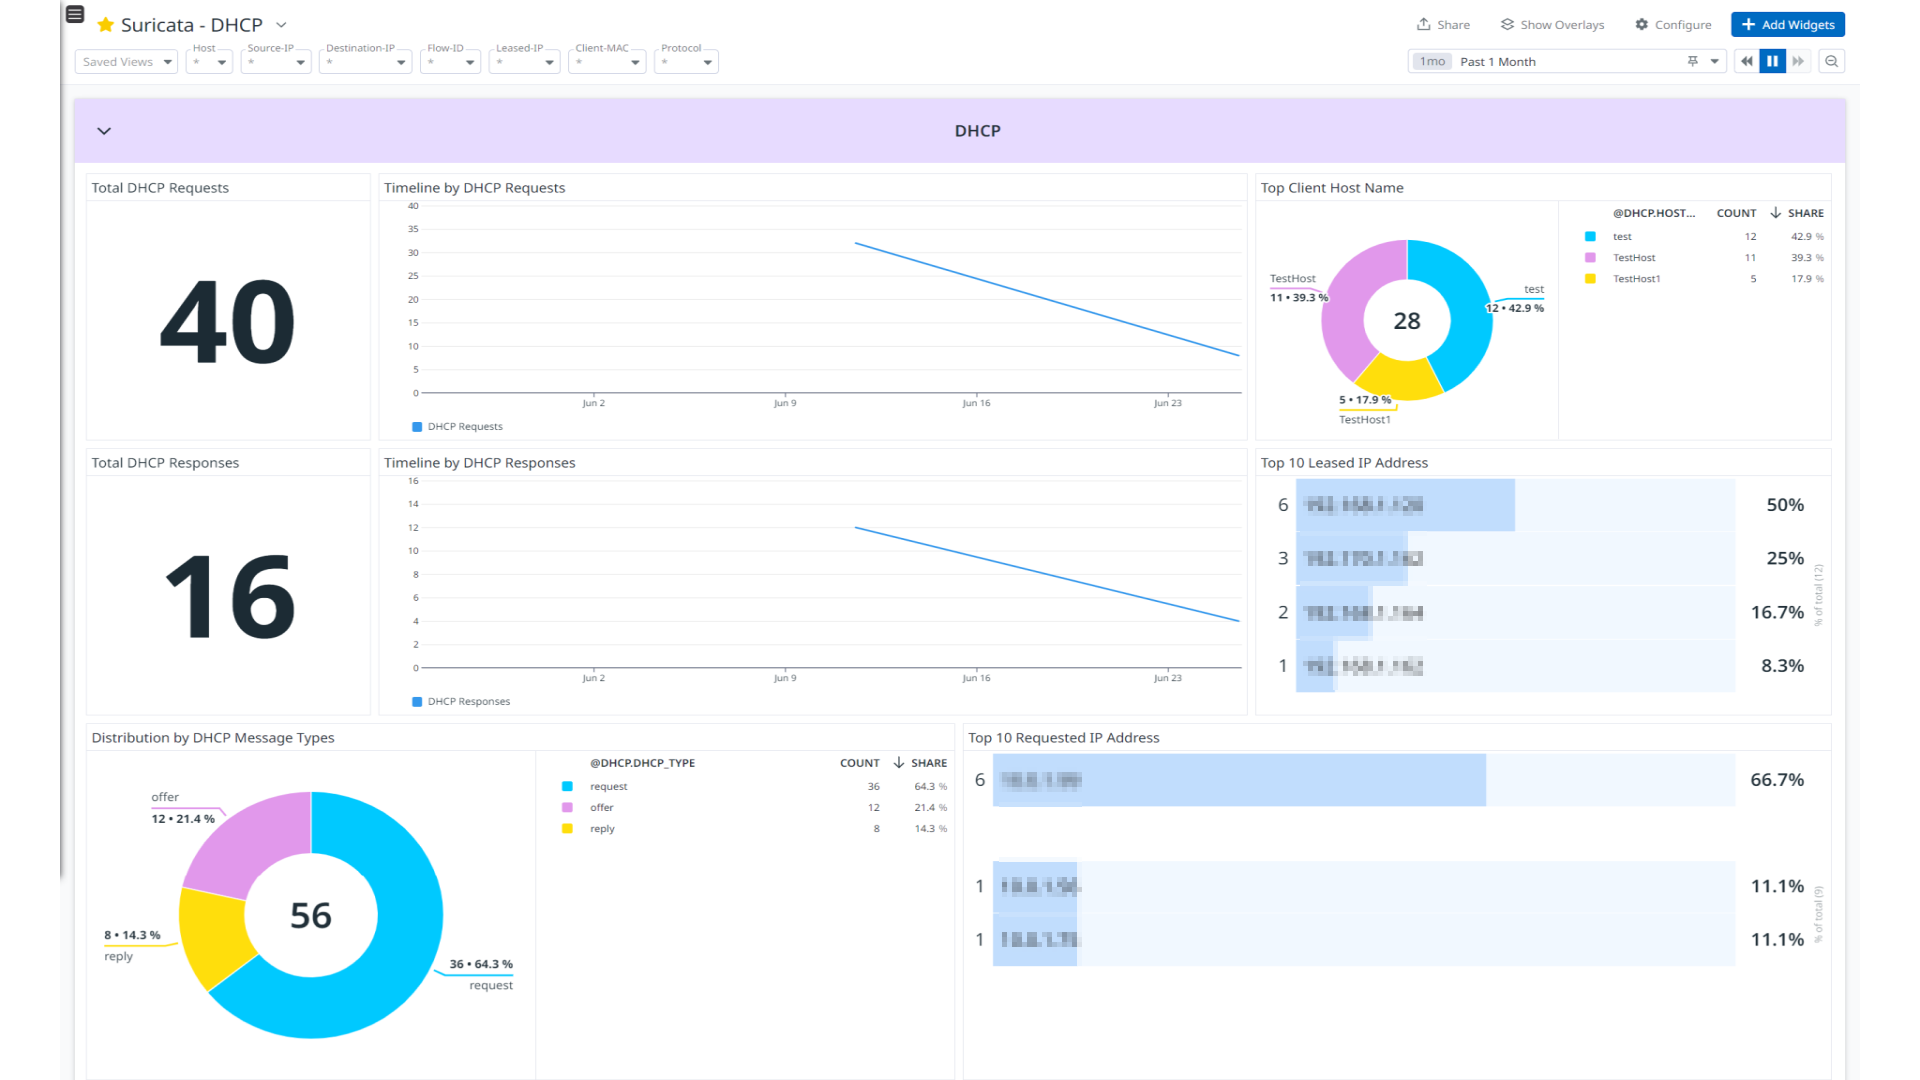

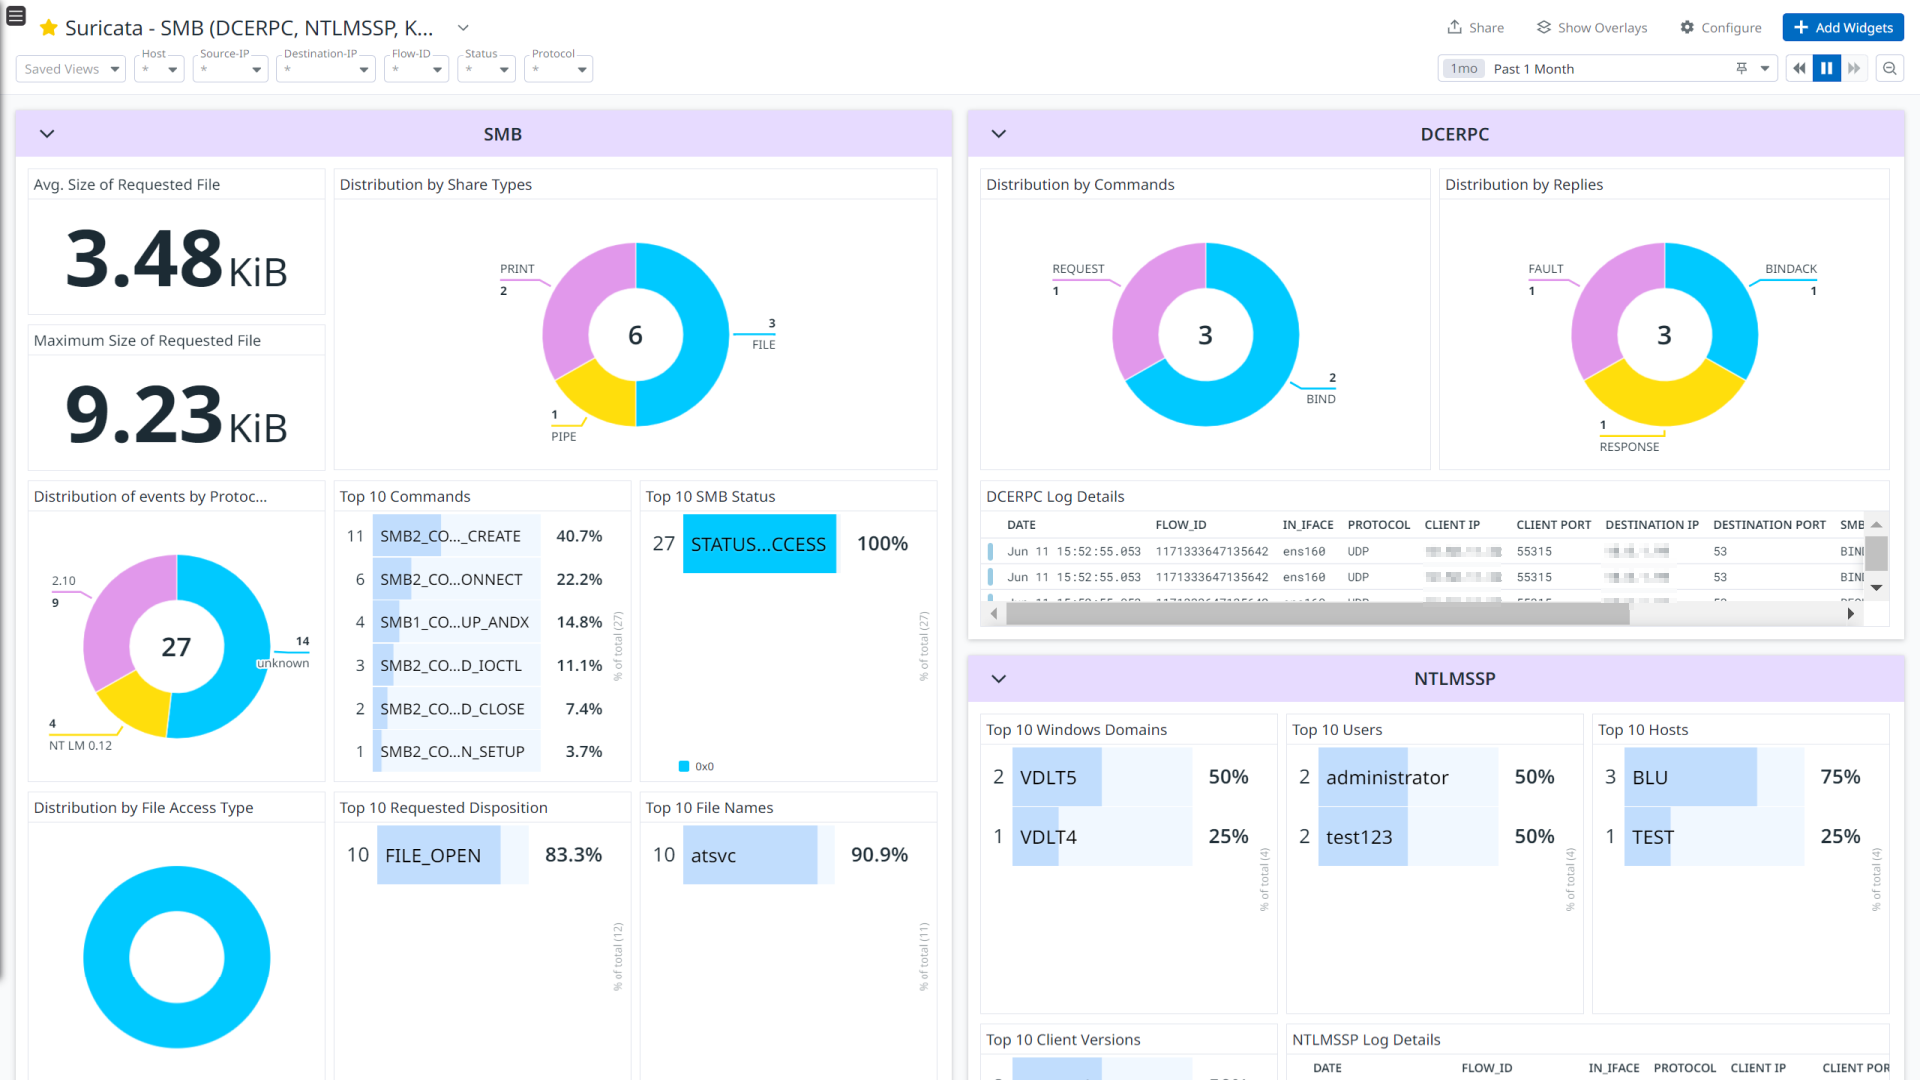
Suricata - Overview
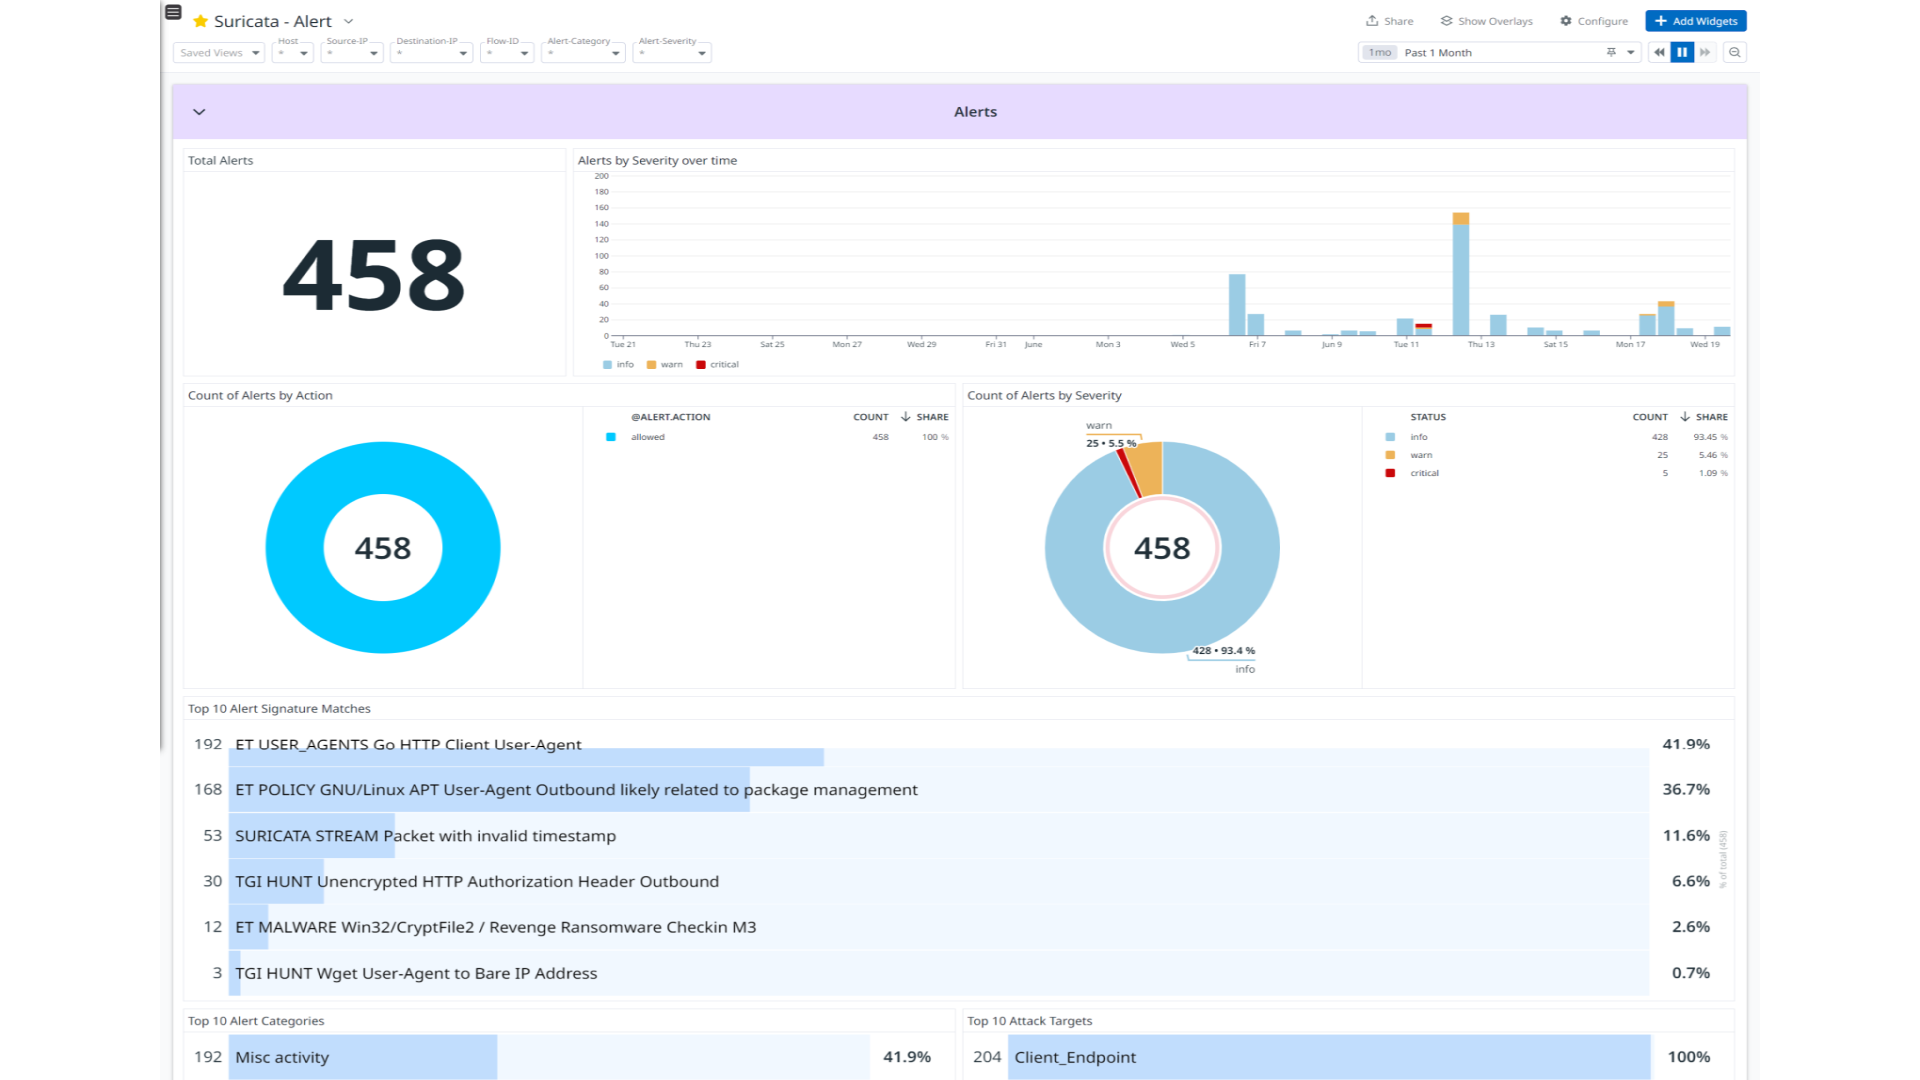
Suricata - Alert
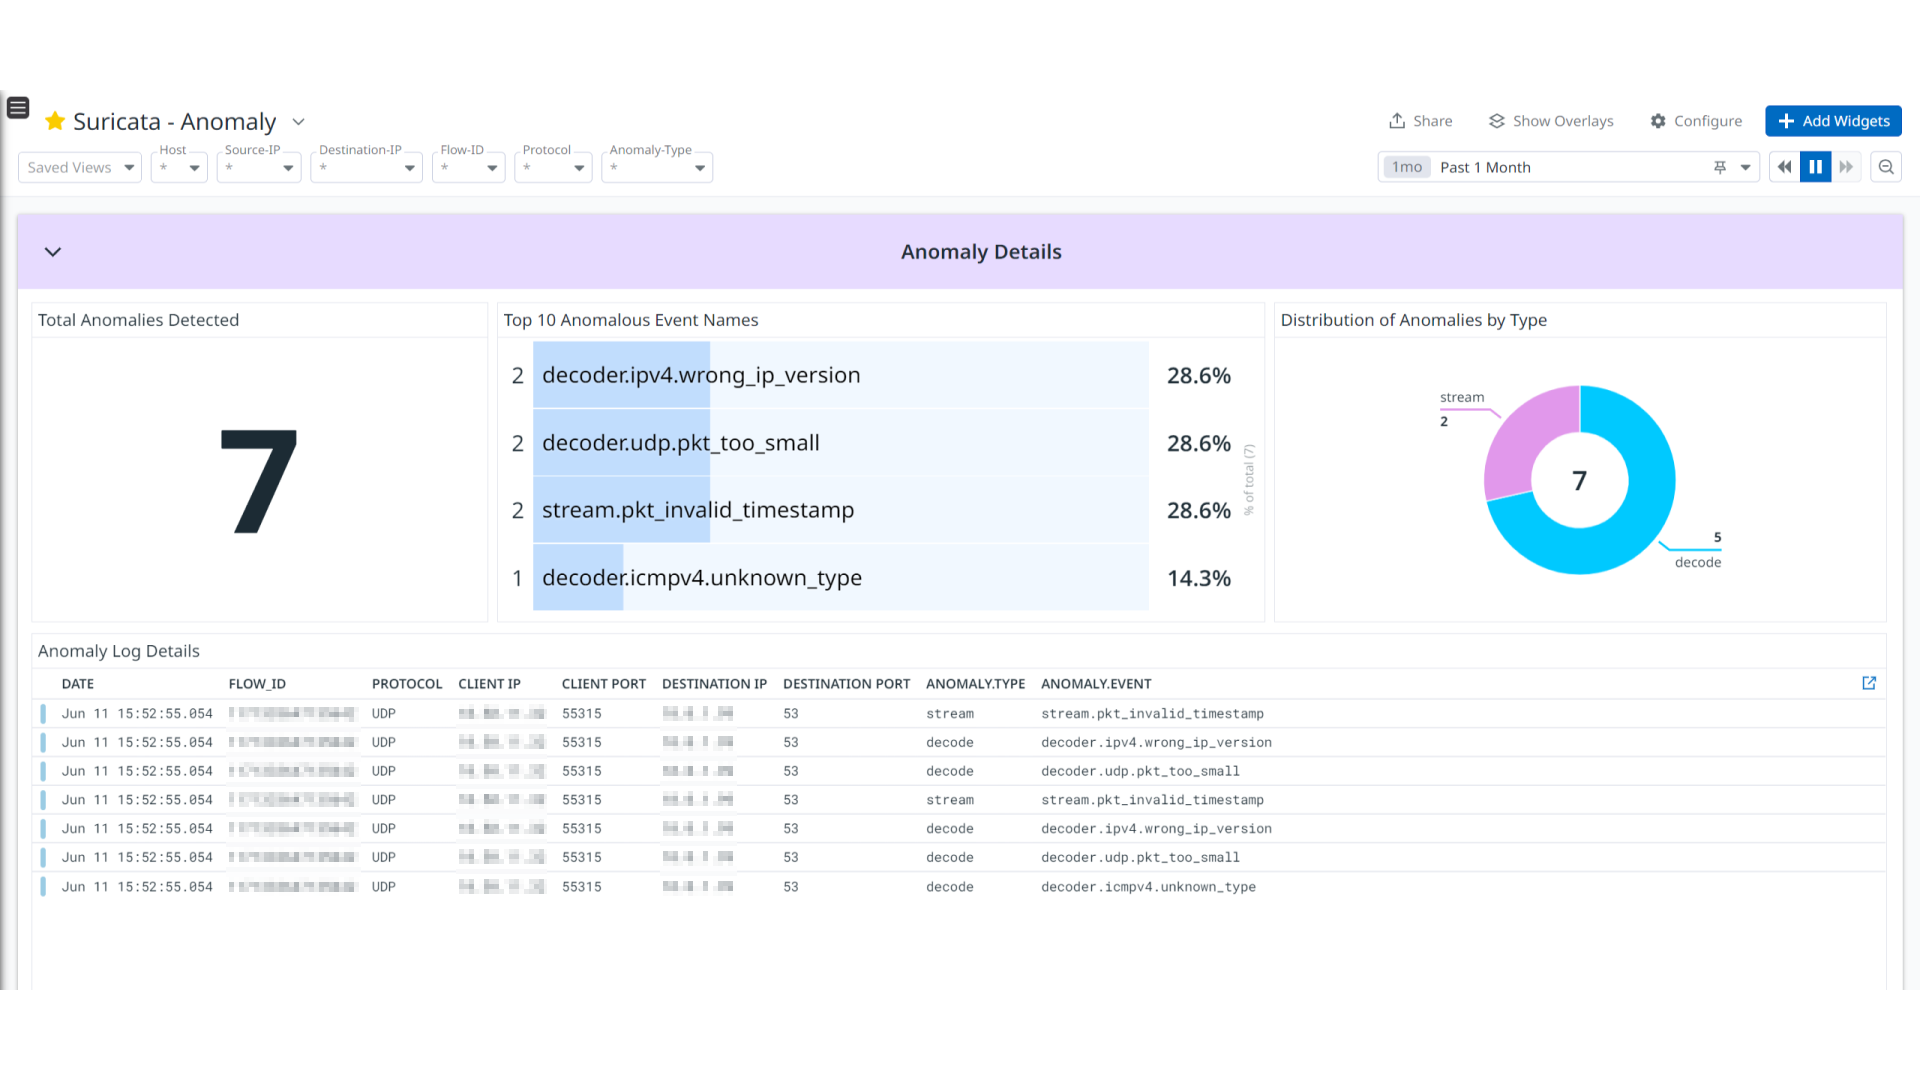
Suricata - Anomaly
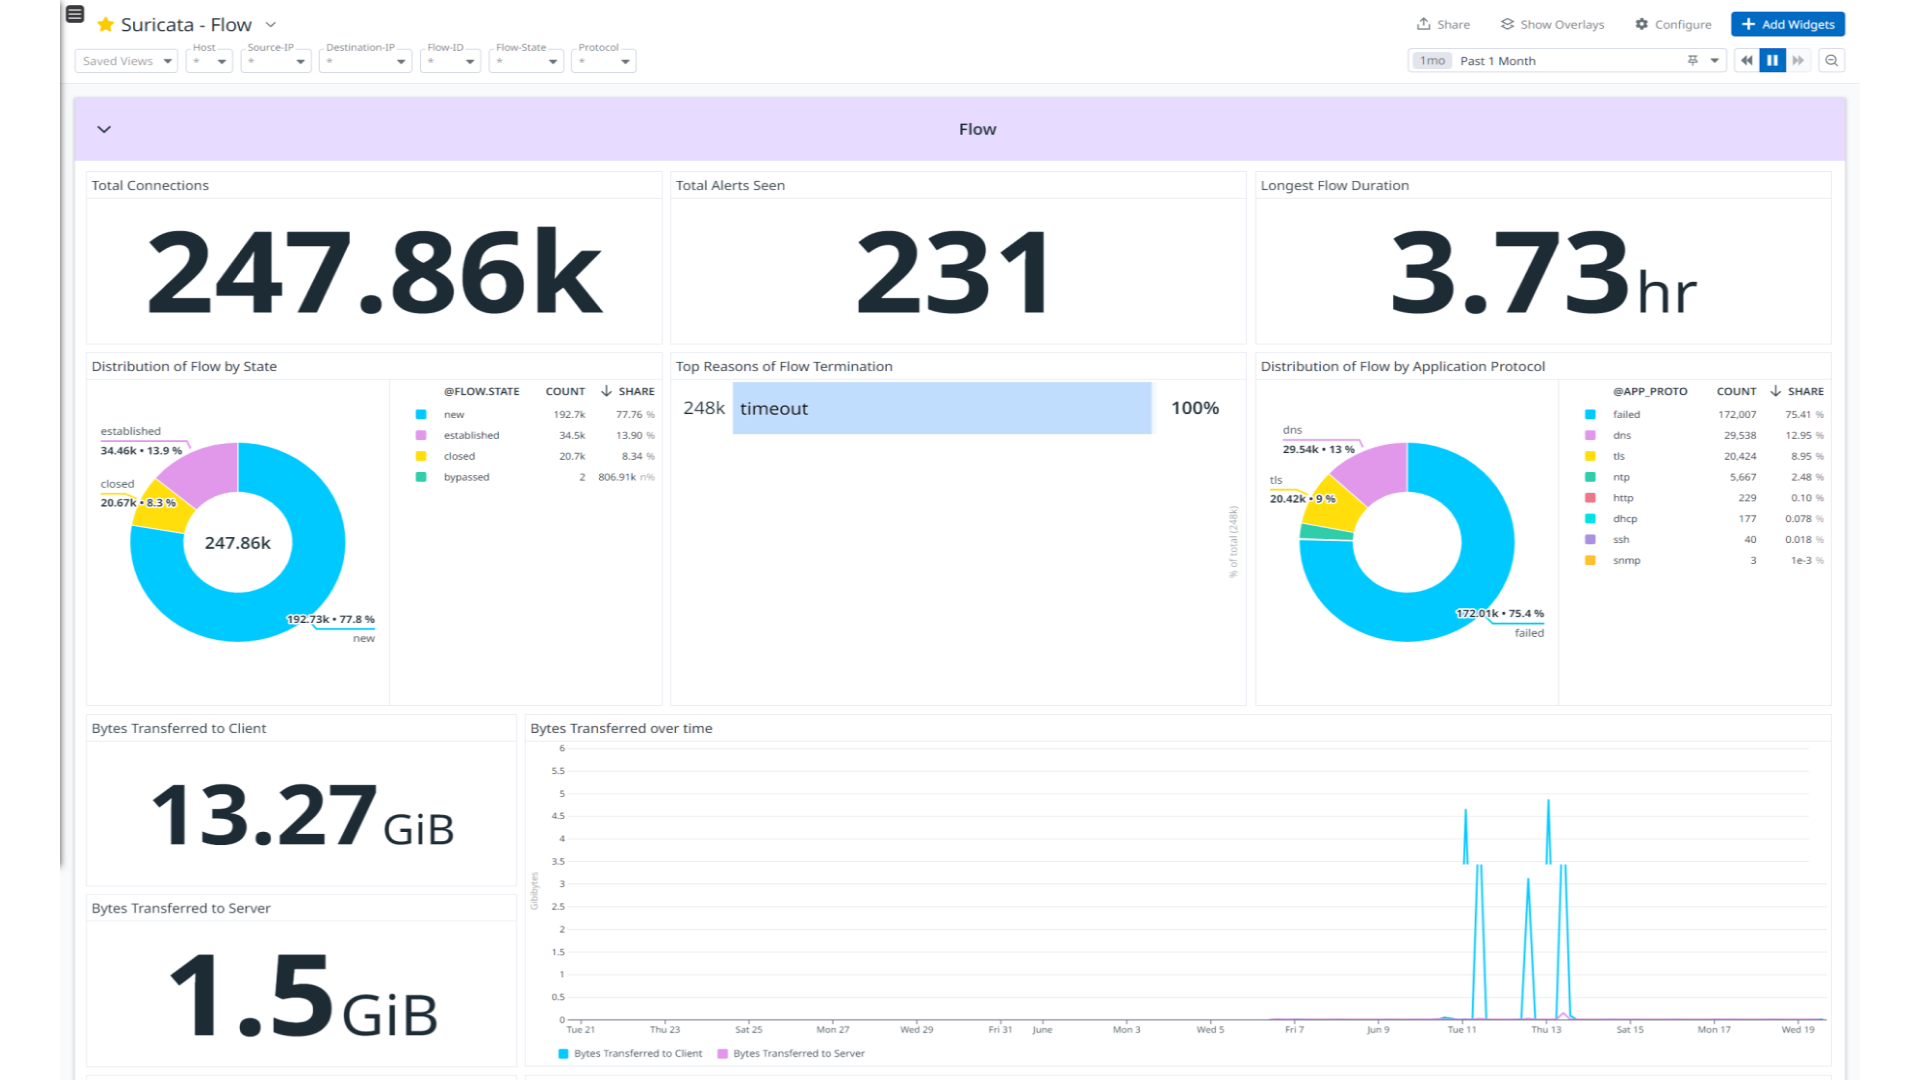
Suricata - Flow
Suricata - DNS
Suricata - DHCP
Suricata - Network Protocols
Suricata - SMB (DCERPC, NTLMSSP, Kerberos)
Cette page n'est pas encore disponible en français, sa traduction est en cours.
Si vous avez des questions ou des retours sur notre projet de traduction actuel, n'hésitez pas à nous contacter.
Si vous avez des questions ou des retours sur notre projet de traduction actuel, n'hésitez pas à nous contacter.
Overview
Suricata is a high performance, open source network analysis and threat detection software used by most private and public organizations, and embedded by major vendors to protect their assets.
This integration provides enrichment and visualization for Alert, Anomaly, HTTP, DNS, FTP, FTP_DATA, TLS, TFTP, SMB, SSH, Flow, RDP, DHCP, and ARP log types. It helps to visualize detailed insights into Alerts, Anomaly, network connections, DNS, and DHCP activity, as well as detailed network protocol analysis in the integration’s out-of-the-box dashboards.
Minimum Agent version: 7.57.0
Setup
Installation
To install the Suricata integration, run the following Agent installation command and follow the steps below. For more information, see the Integration Management documentation.
Note: This step is not necessary for Agent versions >= 7.57.0.
For Linux, run:
sudo -u dd-agent -- datadog-agent integration install datadog-suricata==1.0.0
Configuration
Log collection
Collecting logs is disabled by default in the Datadog Agent. Enable it in the
datadog.yamlfile:logs_enabled: trueAdd this configuration block to your
suricata.d/conf.yamlfile to start collecting your Suricata logs.See the sample suricata.d/conf.yaml for available configuration options.
logs: - type: file path: /var/log/suricata/eve.json service: suricata source: suricataNote: Make sure you have
eve-logoutput logging enabled in thesuricata.yamlfile of the Suricata application, and that you’ve address the following points:- In the
suricata.yamlfile, keepfiletypeparameter asregularineve-logconfigurations. - The default path of Suricata’s output files is
/var/log/suricata, and the default filename iseve.json. If you have changed the default path and filename, update thepathparameter in yourconf.yamlfile accordingly.
- In the
Validation
Run the Agent’s status subcommand and look for suricata under the Checks section.
Data Collected
Logs
The Suricata integration collects the following log types.
| Format | Event Types |
|---|---|
| JSON | alert, anomaly, http, dns, ftp, ftp_data, tls. tftp, smb, ssh, flow, rdp, dhcp, arp |
Metrics
The Suricata integration does not include any metrics.
Events
The Suricata integration does not include any events.
Service Checks
The Suricata integration does not include any service checks.
Troubleshooting
If you see a Permission denied error while monitoring the log files, give the dd-agent user read permission on them.
sudo chown -R dd-agent:dd-agent /var/log/suricata/eve.json
For any further assistance, contact Datadog support.
