- Principales informations
- Getting Started
- Datadog
- Site Datadog
- DevSecOps
- Serverless for AWS Lambda
- Agent
- Intégrations
- Conteneurs
- Dashboards
- Monitors
- Logs
- Tracing
- Profileur
- Tags
- API
- Service Catalog
- Session Replay
- Continuous Testing
- Surveillance Synthetic
- Incident Management
- Database Monitoring
- Cloud Security Management
- Cloud SIEM
- Application Security Management
- Workflow Automation
- CI Visibility
- Test Visibility
- Intelligent Test Runner
- Code Analysis
- Learning Center
- Support
- Glossary
- Standard Attributes
- Guides
- Agent
- Intégrations
- OpenTelemetry
- Développeurs
- Authorization
- DogStatsD
- Checks custom
- Intégrations
- Create an Agent-based Integration
- Create an API Integration
- Create a Log Pipeline
- Integration Assets Reference
- Build a Marketplace Offering
- Create a Tile
- Create an Integration Dashboard
- Create a Recommended Monitor
- Create a Cloud SIEM Detection Rule
- OAuth for Integrations
- Install Agent Integration Developer Tool
- Checks de service
- IDE Plugins
- Communauté
- Guides
- Administrator's Guide
- API
- Application mobile
- CoScreen
- Cloudcraft
- In The App
- Dashboards
- Notebooks
- DDSQL Editor
- Alertes
- Infrastructure
- Métriques
- Watchdog
- Bits AI
- Service Catalog
- API Catalog
- Error Tracking
- Service Management
- Infrastructure
- Universal Service Monitoring
- Conteneurs
- Sans serveur
- Surveillance réseau
- Cloud Cost
- Application Performance
- APM
- Profileur en continu
- Database Monitoring
- Agent Integration Overhead
- Setup Architectures
- Configuration de Postgres
- Configuration de MySQL
- Configuration de SQL Server
- Setting Up Oracle
- Setting Up MongoDB
- Connecting DBM and Traces
- Données collectées
- Exploring Database Hosts
- Explorer les métriques de requête
- Explorer des échantillons de requêtes
- Dépannage
- Guides
- Data Streams Monitoring
- Data Jobs Monitoring
- Digital Experience
- RUM et Session Replay
- Product Analytics
- Surveillance Synthetic
- Continuous Testing
- Software Delivery
- CI Visibility
- CD Visibility
- Test Visibility
- Exécuteur de tests intelligent
- Code Analysis
- Quality Gates
- DORA Metrics
- Securité
- Security Overview
- Cloud SIEM
- Cloud Security Management
- Application Security Management
- AI Observability
- Log Management
- Pipelines d'observabilité
- Log Management
- Administration
LoadRunner Professional
Supported OS


Controller Design Tab
Controller Run Tab
Analysis Summary Report
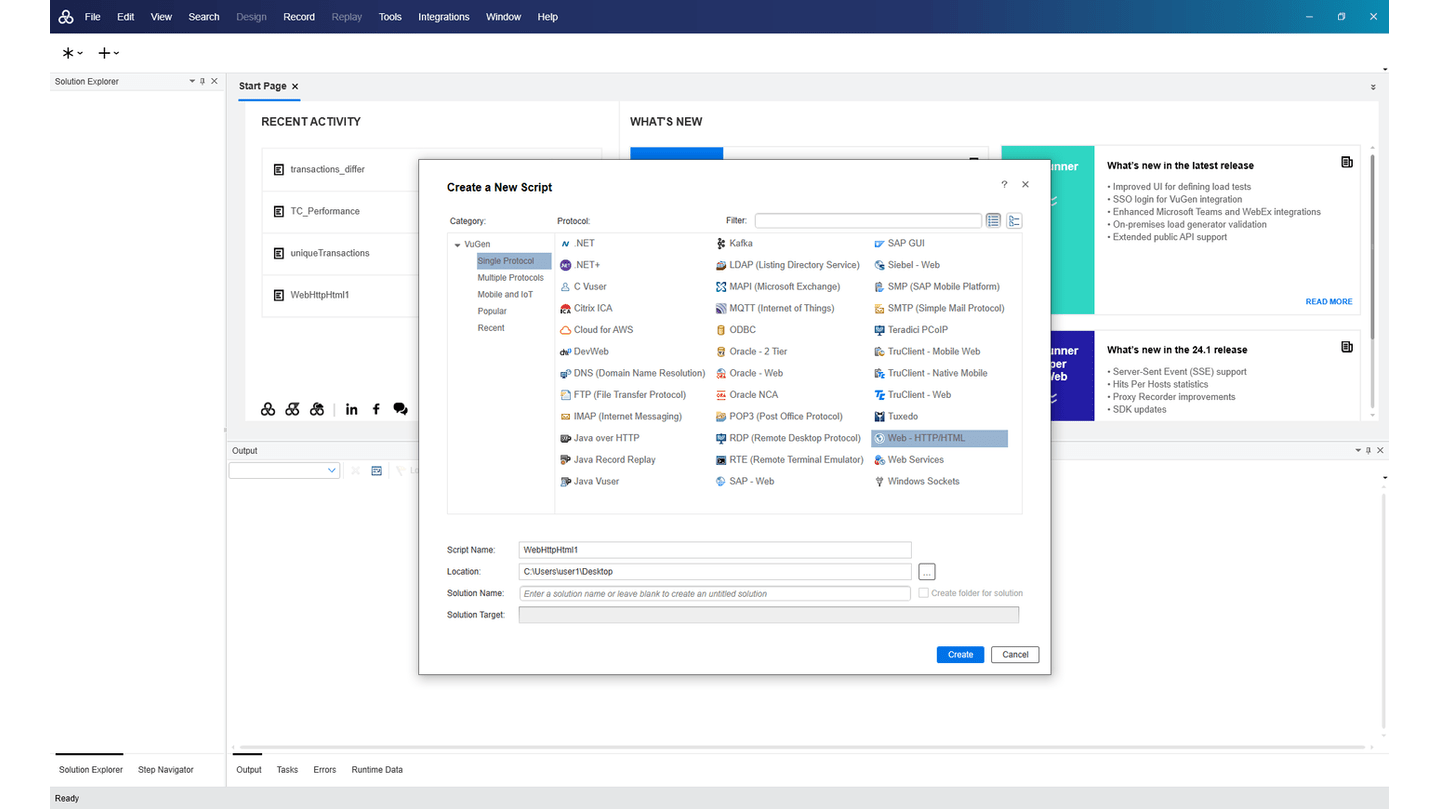
Vugen New Script
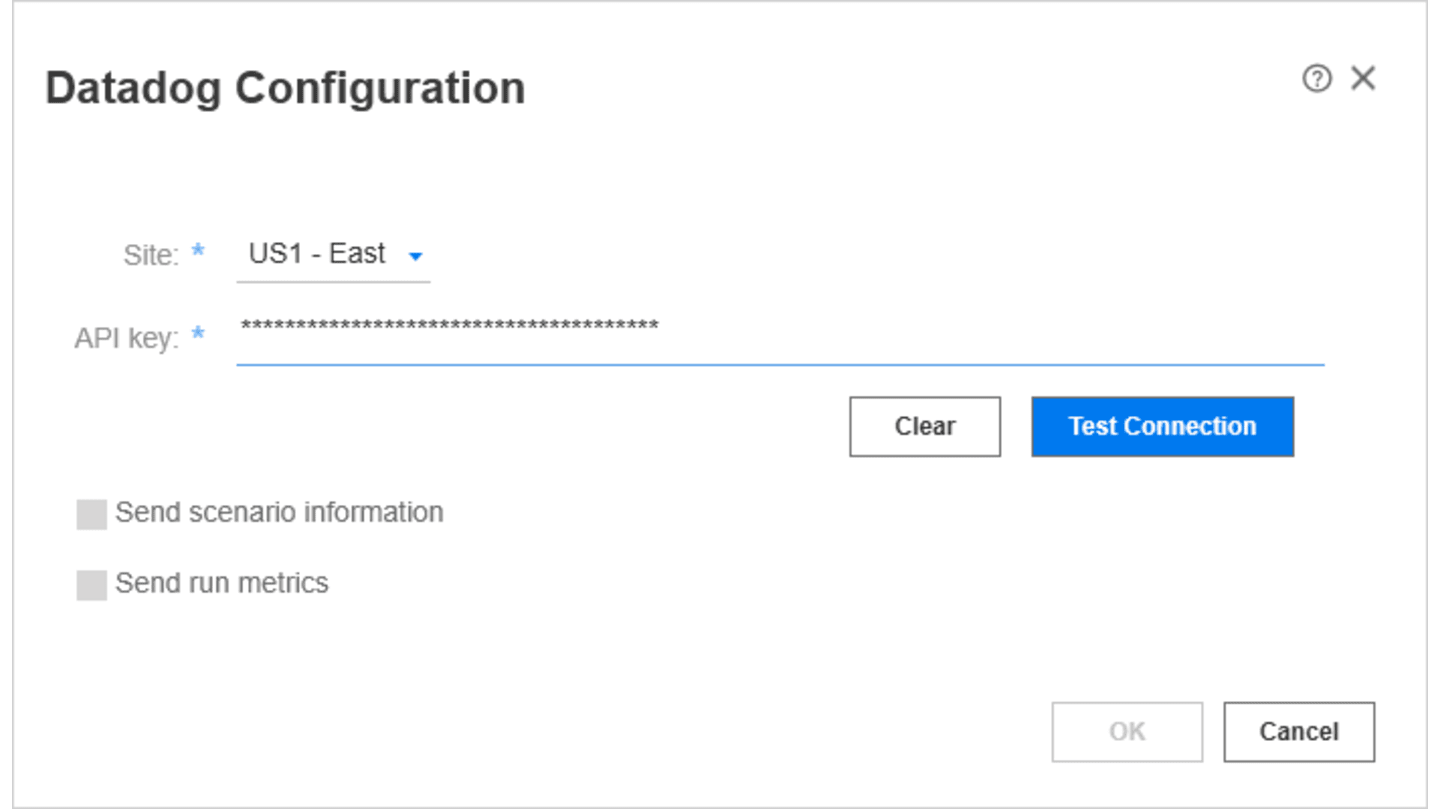
Datadog Configuration Window
Cette page n'est pas encore disponible en français, sa traduction est en cours.
Si vous avez des questions ou des retours sur notre projet de traduction actuel, n'hésitez pas à nous contacter.
Si vous avez des questions ou des retours sur notre projet de traduction actuel, n'hésitez pas à nous contacter.
Overview
OpenText LoadRunner Professional is a load testing solution that enables you to test the performance of diverse application types to identify and resolve issues before applications go live.
LoadRunner Controller is a tool for creating and controlling LoadRunner Professional scenarios. A scenario defines the events that occur during each testing session. It controls the number of users to emulate (virtual users, or Vusers), the actions they perform, and the machines on which they run their emulations. You use scenarios to create load tests to check the reliability and strength of your servers.
With this integration, Controller pushes real-time metrics and data from scenario runs to Datadog.
| Send scenario information | Send information about the scenario run, such as the start and stop time, duration and included scripts in the form of logs. |
| Send run metrics | Send metrics from the scenario run, such as Vuser status and transaction response times. |
Setup
Configure LoadRunner Controller to push data to Datadog. You can choose whether to send scenario information, run metrics, or both. Once configured, this integration provides a Datadog dashboard to view the data in pre-configured widgets.
- Open Controller.
- In the Controller toolbar, select Tools > Datadog Configuration.
- In the Site field, select your Datadog site.
- In the API key field, enter the API key generated by Datadog.
- Click Test Connection.
- Once the connection is successful, choose whether to send scenario information, run metrics, or both to Datadog.
- If you enable Controller to send scenario information, the included log pipeline with this integration automatically processes your logs and adds relevant tags. For more specifics on the pipeline, navigate to Logs > Pipelines in Datadog.
- In Datadog, the LoadRunner Professional Dashboard will automatically be installed with the integration. The dashboard includes widgets that display run metrics and scenario information (depending on the data that Controller is configured to send).
Once Controller has been configured to push data to Datadog, the data is pushed each time you run a scenario in Controller. To disable Controller from pushing data to Datadog, select Tools > Datadog Configuration and clear the fields in the Datadog Configuration dialog box.

Data Collected
Metrics
| loadrunner.vusers.running (gauge) | Number of vusers currently running. |
| loadrunner.vusers.ready (gauge) | Number of vusers ready to run. |
| loadrunner.vusers.finished (gauge) | Number of vusers that have finished running. |
| loadrunner.vusers.error (gauge) | Number of vusers that have failed with error. |
| loadrunner.total.transactions.passed.per.sec (gauge) | Total transactions passed per second for the LoadRunner Controller. Shown as transaction |
| loadrunner.transaction.response_time (gauge) | Specific transaction response time. Shown as second |
| loadrunner.transaction.passed (gauge) | Number of successful executions of the transaction. Shown as transaction |
| loadrunner.transaction.failed (gauge) | Number of failed executions of the transaction. Shown as transaction |
| loadrunner.transaction.stopped (gauge) | Number of stopped executions of the transaction. Shown as transaction |
Service Checks
LoadRunner Professional does not include any service checks.
Events
LoadRunner Professional does not include any events.
Troubleshooting
Need help? See LoadRunner Professional docs or contact Datadog support.
