- Principales informations
- Getting Started
- Agent
- API
- Tracing
- Conteneurs
- Dashboards
- Database Monitoring
- Datadog
- Site Datadog
- DevSecOps
- Incident Management
- Intégrations
- Internal Developer Portal
- Logs
- Monitors
- OpenTelemetry
- Profileur
- Session Replay
- Security
- Serverless for AWS Lambda
- Software Delivery
- Surveillance Synthetic
- Tags
- Workflow Automation
- Learning Center
- Support
- Glossary
- Standard Attributes
- Guides
- Agent
- Intégrations
- Développeurs
- OpenTelemetry
- Administrator's Guide
- API
- Partners
- Application mobile
- DDSQL Reference
- CoScreen
- CoTerm
- Remote Configuration
- Cloudcraft
- In The App
- Dashboards
- Notebooks
- DDSQL Editor
- Reference Tables
- Sheets
- Alertes
- Watchdog
- Métriques
- Bits AI
- Internal Developer Portal
- Error Tracking
- Change Tracking
- Service Management
- Actions & Remediations
- Infrastructure
- Cloudcraft
- Resource Catalog
- Universal Service Monitoring
- Hosts
- Conteneurs
- Processes
- Sans serveur
- Surveillance réseau
- Cloud Cost
- Application Performance
- APM
- Termes et concepts de l'APM
- Sending Traces to Datadog
- APM Metrics Collection
- Trace Pipeline Configuration
- Connect Traces with Other Telemetry
- Trace Explorer
- Recommendations
- Code Origin for Spans
- Observabilité des services
- Endpoint Observability
- Dynamic Instrumentation
- Live Debugger
- Suivi des erreurs
- Sécurité des données
- Guides
- Dépannage
- Profileur en continu
- Database Monitoring
- Agent Integration Overhead
- Setup Architectures
- Configuration de Postgres
- Configuration de MySQL
- Configuration de SQL Server
- Setting Up Oracle
- Setting Up Amazon DocumentDB
- Setting Up MongoDB
- Connecting DBM and Traces
- Données collectées
- Exploring Database Hosts
- Explorer les métriques de requête
- Explorer des échantillons de requêtes
- Exploring Database Schemas
- Exploring Recommendations
- Dépannage
- Guides
- Data Streams Monitoring
- Data Jobs Monitoring
- Data Observability
- Digital Experience
- RUM et Session Replay
- Surveillance Synthetic
- Continuous Testing
- Product Analytics
- Software Delivery
- CI Visibility
- CD Visibility
- Deployment Gates
- Test Visibility
- Code Coverage
- Quality Gates
- DORA Metrics
- Feature Flags
- Securité
- Security Overview
- Cloud SIEM
- Code Security
- Cloud Security Management
- Application Security Management
- Workload Protection
- Sensitive Data Scanner
- AI Observability
- Log Management
- Pipelines d'observabilité
- Log Management
- CloudPrem
- Administration
Error Tracking
Cette page n'est pas encore disponible en français, sa traduction est en cours.
Si vous avez des questions ou des retours sur notre projet de traduction actuel, n'hésitez pas à nous contacter.
Si vous avez des questions ou des retours sur notre projet de traduction actuel, n'hésitez pas à nous contacter.
Overview
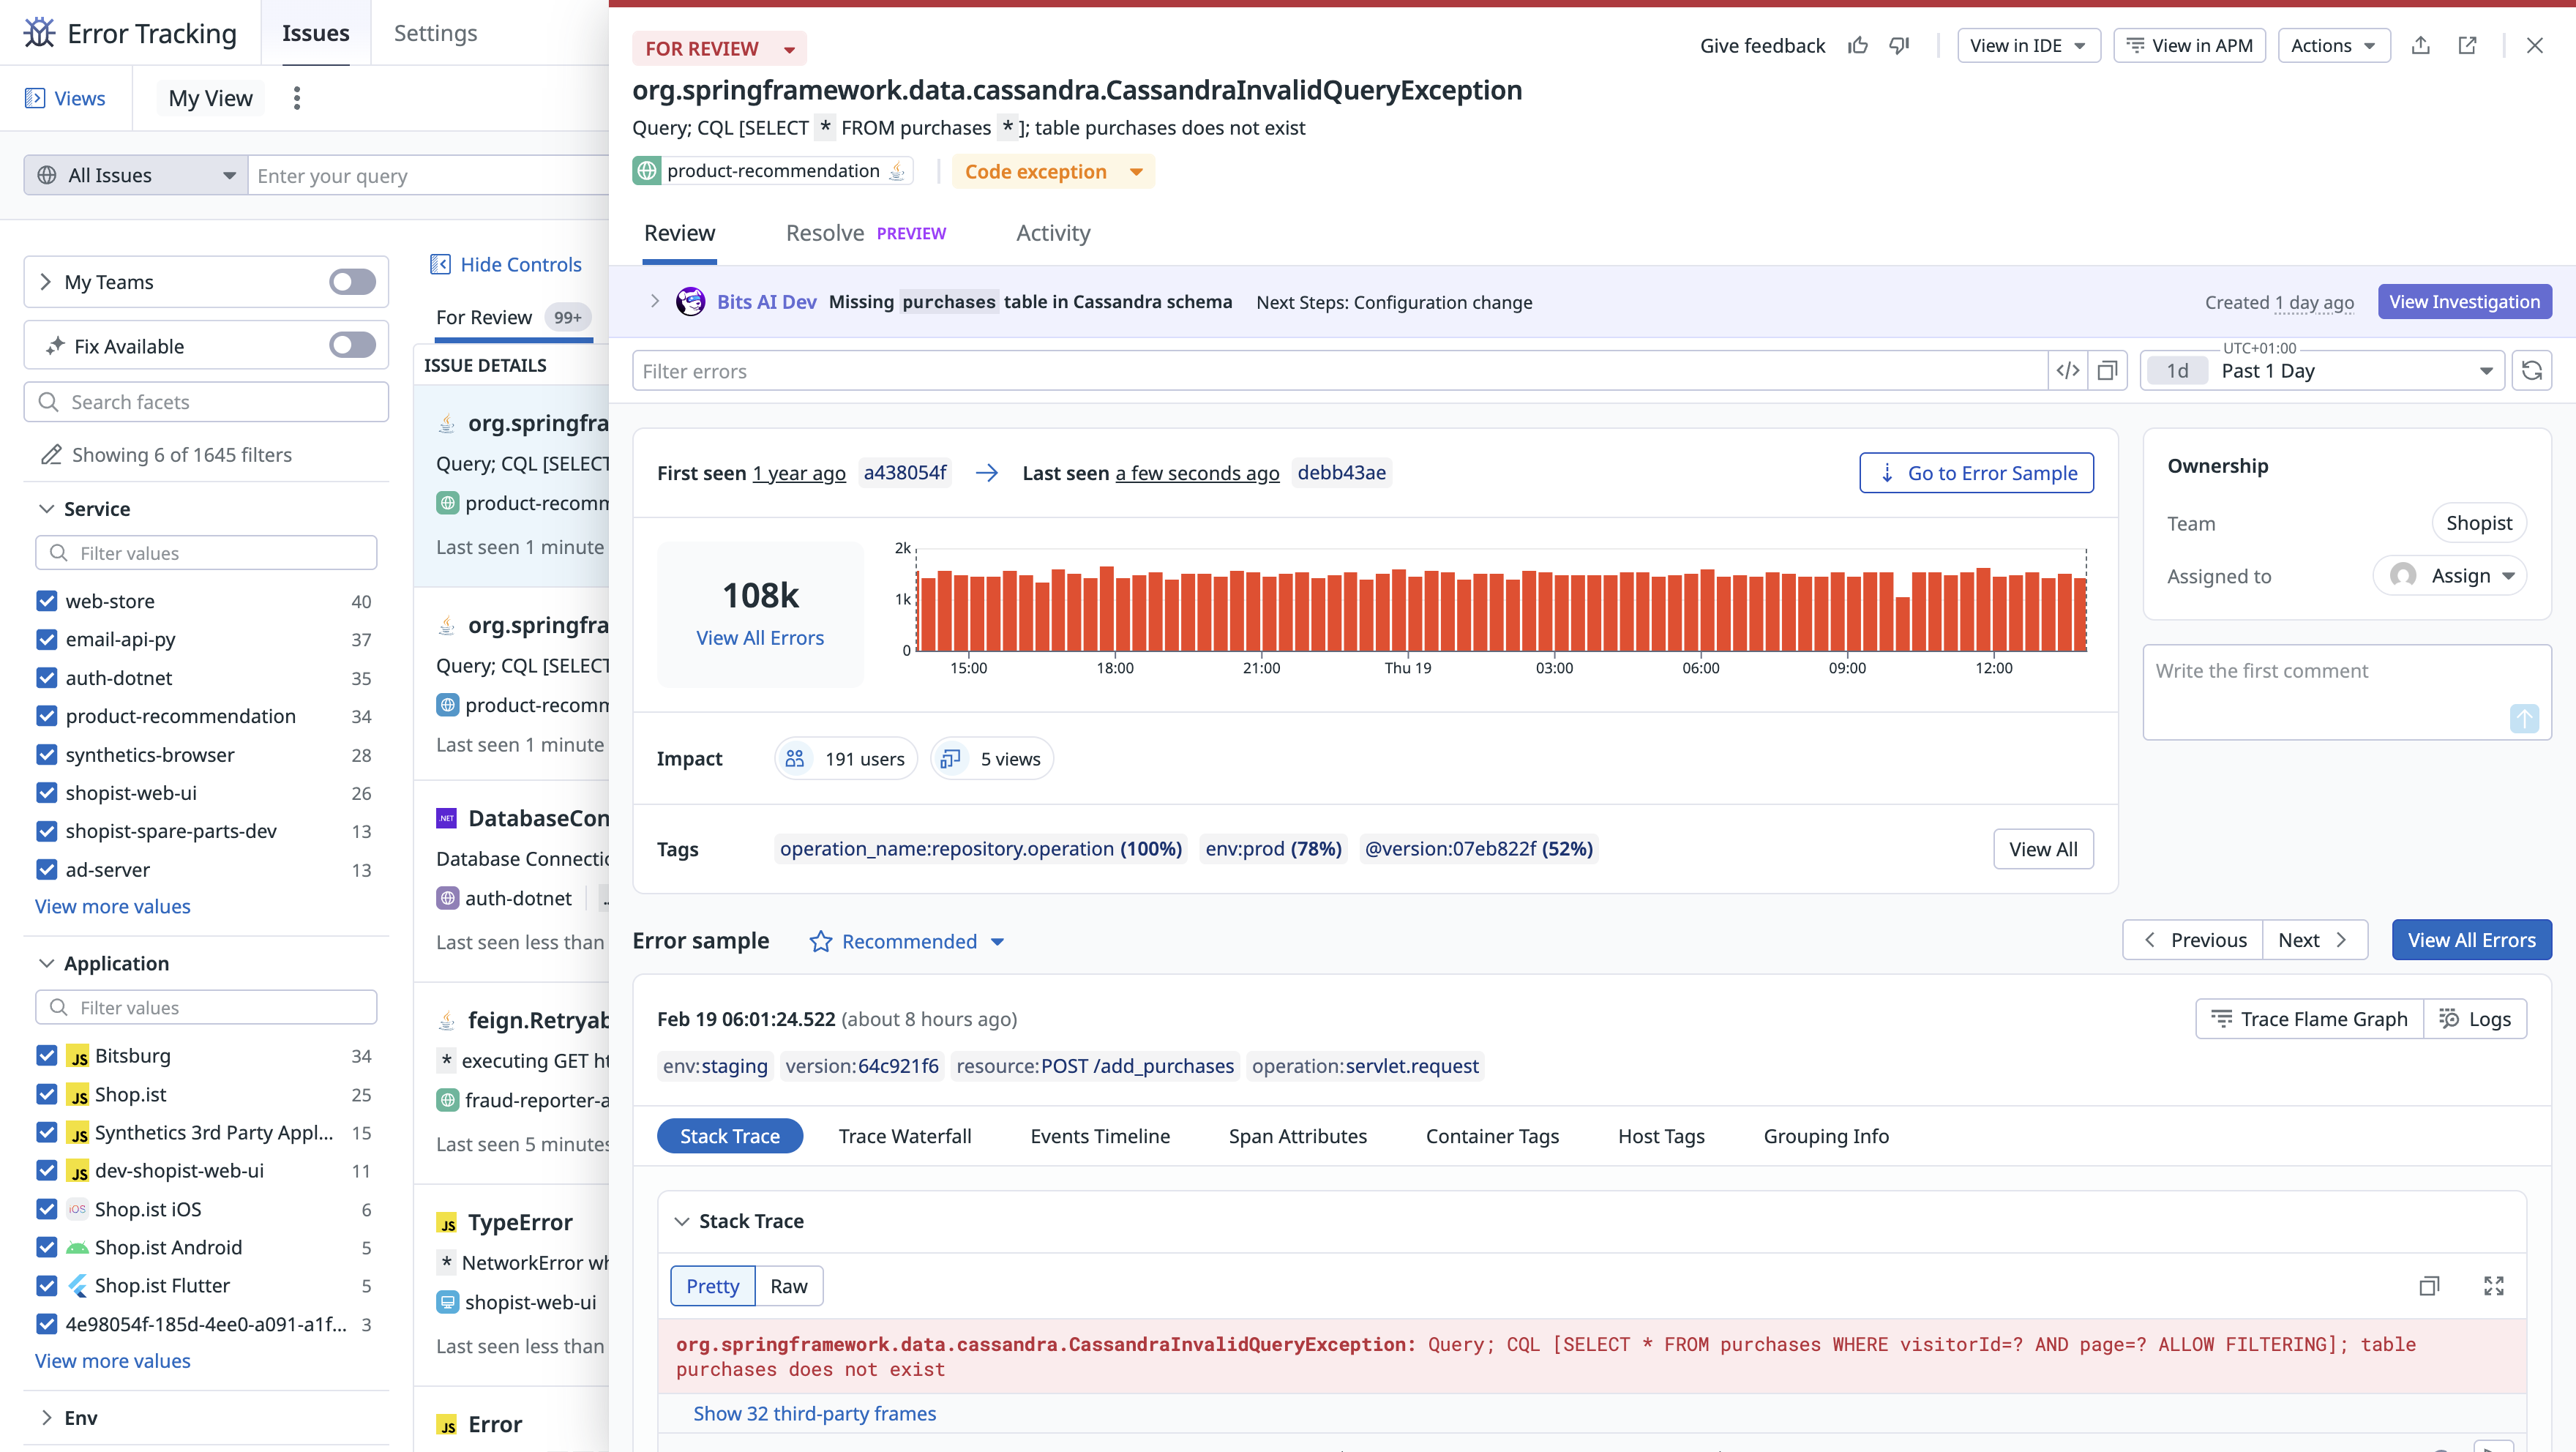
It is critical for your system’s health to consistently monitor the errors collected by Datadog. When there are many individual error events, it becomes hard to prioritize errors for troubleshooting.
Error Tracking simplifies debugging by grouping thousands of similar errors into a single issue. An issue is an aggregation of error data that provides insights such as
- How many users have been impacted
- When the error first occurred
- Which commit probably caused the error
Error Tracking enables you to:
- Track, triage, and debug fatal errors
- Group similar errors into issues, so that you can more easily identify important errors and reduce noise
- Set monitors on error tracking events, such as high error volume or new issues
- Follow issues over time to know when they first started, if they are still ongoing, and how often they occur
Additional features are available depending on the source of the error. See supported error sources.
For developers
Developers can triage and fix issues completely within IntelliJ IDEA, PyCharm, WebStorm, GoLand, PhpStorm, and RubyMine using the Error Tracking integration in the Datadog plugin for JetBrains IDEs. Ask your local AI agent to analyze and fix errors with a single click to provide the full error context.
Getting started
- Take a tour of key Error Tracking features in the Error Tracking Explorer documentation.
- Use the product-specific links in the next section to set up Error Tracking for a particular error source.
Setup
To get started with Datadog Error Tracking, choose one of the following setup options:
Supported error sources
Error Tracking captures and processes errors across your web, mobile, and backend applications. You can instrument your applications and services using the Browser SDK, Mobile SDK, or ingest errors from your Logs, Traces, and Real User Monitoring events.
Additional features are available depending on the source of the error. For example, in errors originating from an APM trace, the Exception Replay feature automatically captures production variable values.
For details, see the product-specific Error Tracking documentation:
Further reading
Documentation, liens et articles supplémentaires utiles:

