- Principales informations
- Getting Started
- Agent
- API
- Tracing
- Conteneurs
- Dashboards
- Database Monitoring
- Datadog
- Site Datadog
- DevSecOps
- Incident Management
- Intégrations
- Internal Developer Portal
- Logs
- Monitors
- OpenTelemetry
- Profileur
- Session Replay
- Security
- Serverless for AWS Lambda
- Software Delivery
- Surveillance Synthetic
- Tags
- Workflow Automation
- Learning Center
- Support
- Glossary
- Standard Attributes
- Guides
- Agent
- Intégrations
- Développeurs
- OpenTelemetry
- Administrator's Guide
- API
- Partners
- Application mobile
- DDSQL Reference
- CoScreen
- CoTerm
- Remote Configuration
- Cloudcraft
- In The App
- Dashboards
- Notebooks
- DDSQL Editor
- Reference Tables
- Sheets
- Alertes
- Watchdog
- Métriques
- Bits AI
- Internal Developer Portal
- Error Tracking
- Change Tracking
- Service Management
- Actions & Remediations
- Infrastructure
- Cloudcraft
- Resource Catalog
- Universal Service Monitoring
- Hosts
- Conteneurs
- Processes
- Sans serveur
- Surveillance réseau
- Cloud Cost
- Application Performance
- APM
- Termes et concepts de l'APM
- Sending Traces to Datadog
- APM Metrics Collection
- Trace Pipeline Configuration
- Connect Traces with Other Telemetry
- Trace Explorer
- Recommendations
- Code Origin for Spans
- Observabilité des services
- Endpoint Observability
- Dynamic Instrumentation
- Live Debugger
- Suivi des erreurs
- Sécurité des données
- Guides
- Dépannage
- Profileur en continu
- Database Monitoring
- Agent Integration Overhead
- Setup Architectures
- Configuration de Postgres
- Configuration de MySQL
- Configuration de SQL Server
- Setting Up Oracle
- Setting Up Amazon DocumentDB
- Setting Up MongoDB
- Connecting DBM and Traces
- Données collectées
- Exploring Database Hosts
- Explorer les métriques de requête
- Explorer des échantillons de requêtes
- Exploring Database Schemas
- Exploring Recommendations
- Dépannage
- Guides
- Data Streams Monitoring
- Data Jobs Monitoring
- Data Observability
- Digital Experience
- RUM et Session Replay
- Surveillance Synthetic
- Continuous Testing
- Product Analytics
- Software Delivery
- CI Visibility
- CD Visibility
- Deployment Gates
- Test Visibility
- Code Coverage
- Quality Gates
- DORA Metrics
- Feature Flags
- Securité
- Security Overview
- Cloud SIEM
- Code Security
- Cloud Security Management
- Application Security Management
- Workload Protection
- Sensitive Data Scanner
- AI Observability
- Log Management
- Pipelines d'observabilité
- Log Management
- CloudPrem
- Administration
Error Tracking
Cette page n'est pas encore disponible en français, sa traduction est en cours.
Si vous avez des questions ou des retours sur notre projet de traduction actuel, n'hésitez pas à nous contacter.
Si vous avez des questions ou des retours sur notre projet de traduction actuel, n'hésitez pas à nous contacter.
Overview
The Error Tracking integration in the Datadog plugin for JetBrains IDEs helps you find and fix runtime errors from production, without leaving your IDE.
Source editor
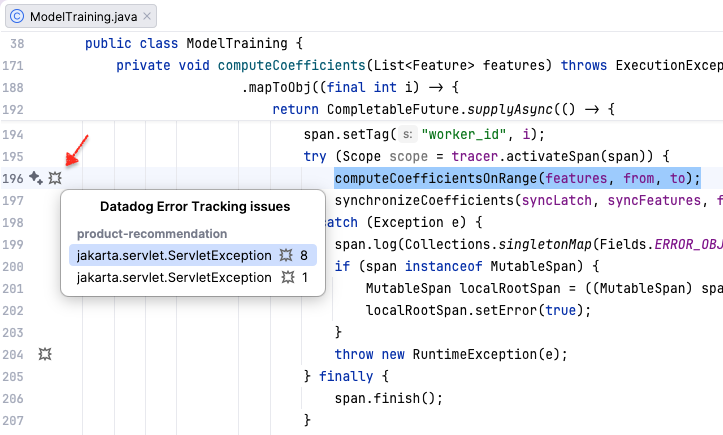
Errors are highlighted in the source editor with a distinctive icon in the gutter, for lines that appear in error stack frames (lines of code on the execution path that led to an observed runtime error). Click the icon to select an error and display it in the Datadog tool window.
Errors shown in the editor are filtered by controls on the Error Tracking tab, described in the next section.
Error Tracking tab
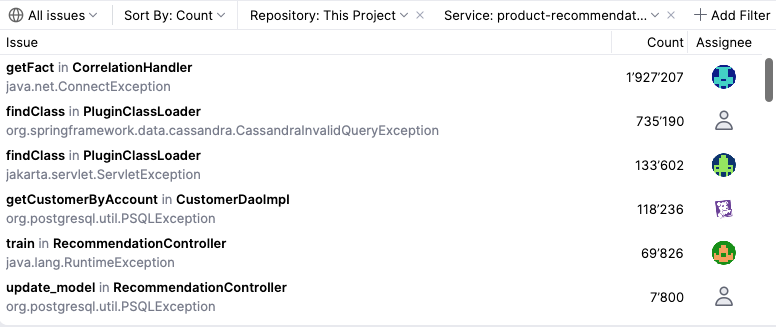
Use the Error Tracking tab in the tool window to filter, sort and inspect errors, view stack traces, navigate to relevant locations in your source code, attempt fixes with your local agent, or navigate to Datadog to continue your investigations.
Additional information shown in this view includes the count, service, first-seen and last-seen timestamps.
Sorting and filtering
Set filters to show errors that are relevant to you:
- Issue type - The source of issues (backend, browser, or mobile)
- Team - Issues for selected teams
- Assignee - Issues assigned to selected users
- Status - Issues for selected statuses, from
For Review,Reviewed,Resolved,Ignored,Excluded - Repository - Issues linked to the repository for the current project
- Service - Issues for selected services
- Environment - Issues for selected environments
- Time frame - Issues that fall within the selected time frame (the last-seen timestamp is on or after the start of the time frame)
Errors can be sorted by:
- Relevance (highest to lowest) - A score based on recency, number of occurrences, and other factors
- Recency (newest to oldest) - Based on first-seen
- Count (highest to lowest) - The number of error occurrences
Issue list
Errors are displayed in a list on the left-side of the tool window, with the type, service, filename, error count and assignee listed.
Select an issue to display its details on the right-side of the tool window.
Issue details
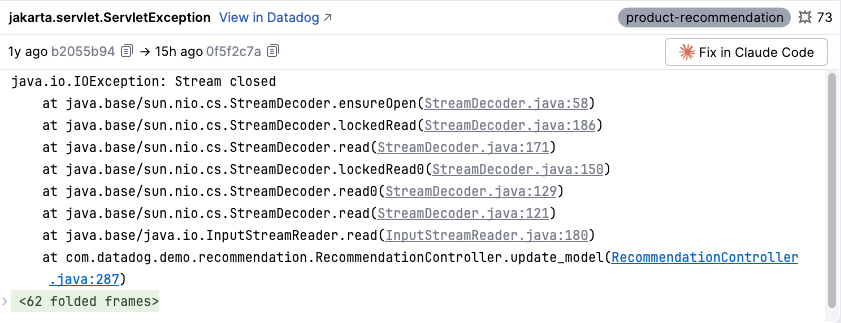
The issue details pane shows detailed information about the selected error, including the error description, the service, the count, first-seen and last-seen information, and a stack trace.
Click the View in Datadog link to open the selected issue in Datadog.
Click on a file and line link in the stack trace to navigate to the code.
Fix With AI
When a local agent is detected (you have the Claude Code, Gemini, or Codex CLI installed locally), a Fix with Local Agent button will appear. Click this to open a new terminal and launch the local agent with a custom prompt from Datadog requesting the agent to fix the error.
Further reading
Documentation, liens et articles supplémentaires utiles:


