- Principales informations
- Getting Started
- Datadog
- Site Datadog
- DevSecOps
- Serverless for AWS Lambda
- Agent
- Intégrations
- Conteneurs
- Dashboards
- Monitors
- Logs
- Tracing
- Profileur
- Tags
- API
- Service Catalog
- Session Replay
- Continuous Testing
- Surveillance Synthetic
- Incident Management
- Database Monitoring
- Cloud Security Management
- Cloud SIEM
- Application Security Management
- Workflow Automation
- CI Visibility
- Test Visibility
- Intelligent Test Runner
- Code Analysis
- Learning Center
- Support
- Glossary
- Standard Attributes
- Guides
- Agent
- Intégrations
- OpenTelemetry
- Développeurs
- Authorization
- DogStatsD
- Checks custom
- Intégrations
- Create an Agent-based Integration
- Create an API Integration
- Create a Log Pipeline
- Integration Assets Reference
- Build a Marketplace Offering
- Create a Tile
- Create an Integration Dashboard
- Create a Recommended Monitor
- Create a Cloud SIEM Detection Rule
- OAuth for Integrations
- Install Agent Integration Developer Tool
- Checks de service
- IDE Plugins
- Communauté
- Guides
- Administrator's Guide
- API
- Application mobile
- CoScreen
- Cloudcraft
- In The App
- Dashboards
- Notebooks
- DDSQL Editor
- Alertes
- Infrastructure
- Métriques
- Watchdog
- Bits AI
- Service Catalog
- API Catalog
- Error Tracking
- Service Management
- Infrastructure
- Universal Service Monitoring
- Conteneurs
- Sans serveur
- Surveillance réseau
- Cloud Cost
- Application Performance
- APM
- Profileur en continu
- Database Monitoring
- Agent Integration Overhead
- Setup Architectures
- Configuration de Postgres
- Configuration de MySQL
- Configuration de SQL Server
- Setting Up Oracle
- Setting Up MongoDB
- Connecting DBM and Traces
- Données collectées
- Exploring Database Hosts
- Explorer les métriques de requête
- Explorer des échantillons de requêtes
- Dépannage
- Guides
- Data Streams Monitoring
- Data Jobs Monitoring
- Digital Experience
- RUM et Session Replay
- Product Analytics
- Surveillance Synthetic
- Continuous Testing
- Software Delivery
- CI Visibility
- CD Visibility
- Test Visibility
- Exécuteur de tests intelligent
- Code Analysis
- Quality Gates
- DORA Metrics
- Securité
- Security Overview
- Cloud SIEM
- Cloud Security Management
- Application Security Management
- AI Observability
- Log Management
- Pipelines d'observabilité
- Log Management
- Administration
Exploring Database Hosts
Cette page n'est pas encore disponible en français, sa traduction est en cours.
Si vous avez des questions ou des retours sur notre projet de traduction actuel, n'hésitez pas à nous contacter.
Si vous avez des questions ou des retours sur notre projet de traduction actuel, n'hésitez pas à nous contacter.
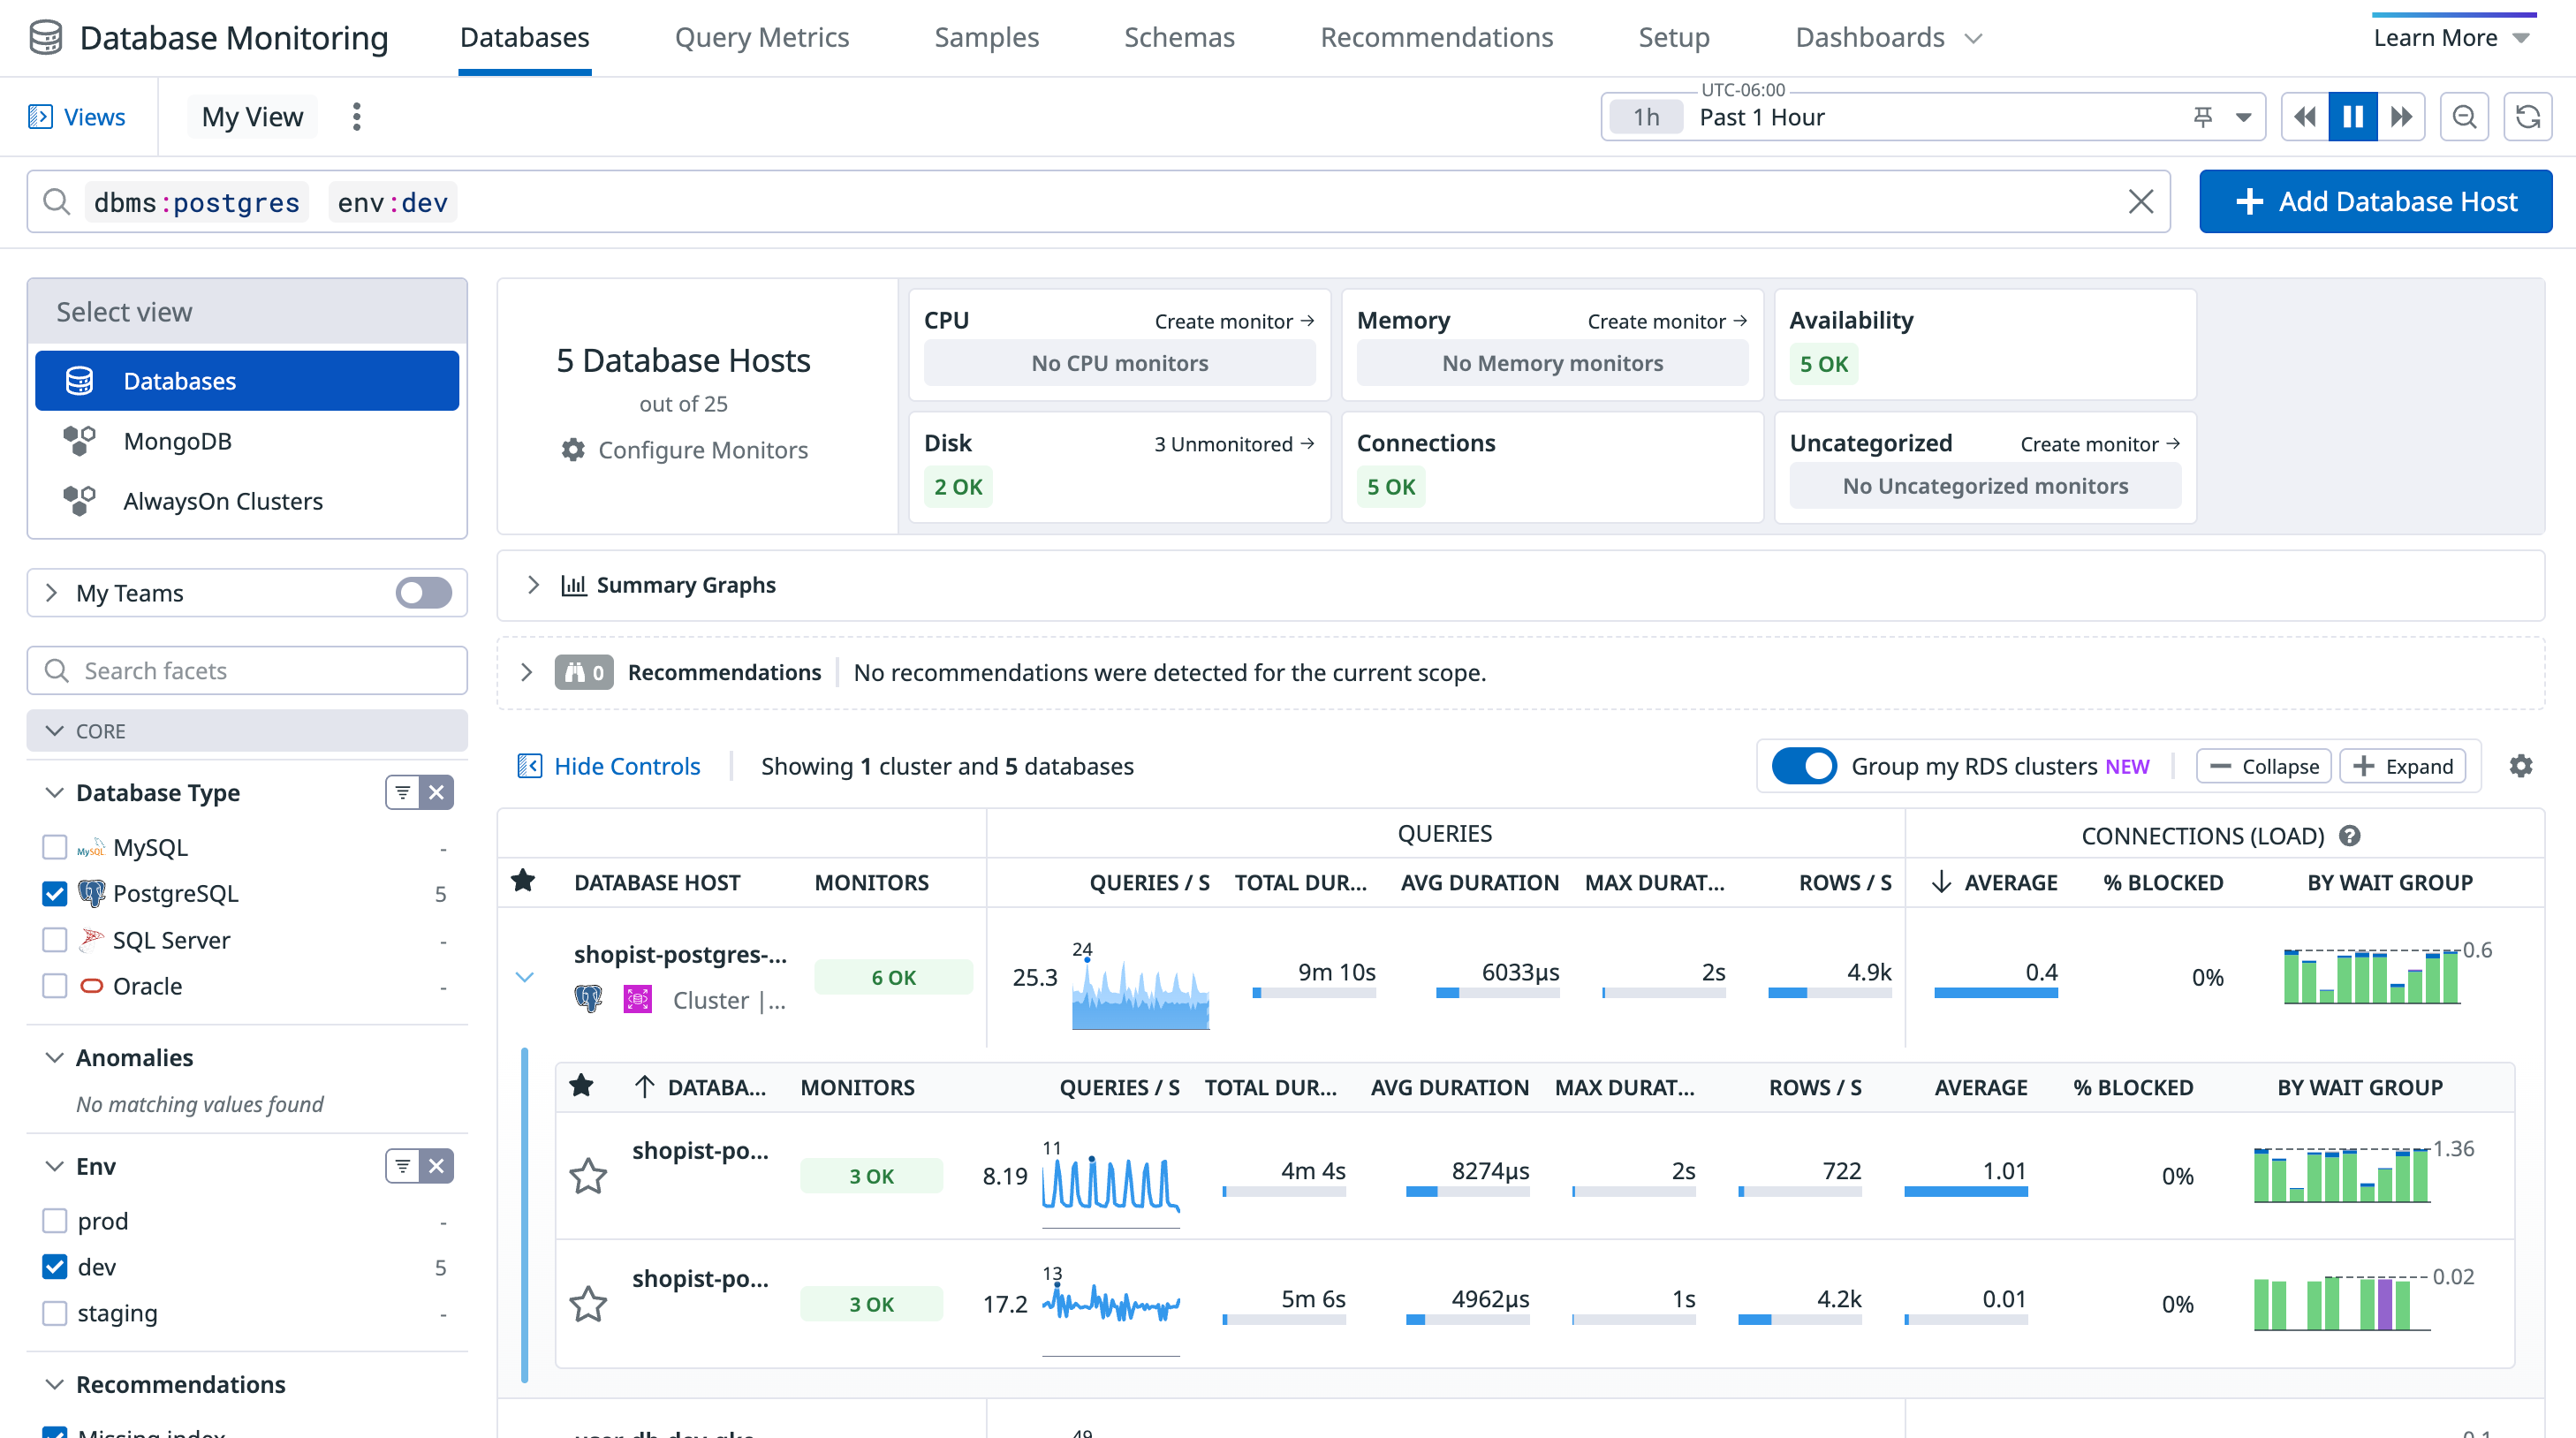
If you are using Amazon RDS with the RDS integration enabled, Datadog automatically receives the
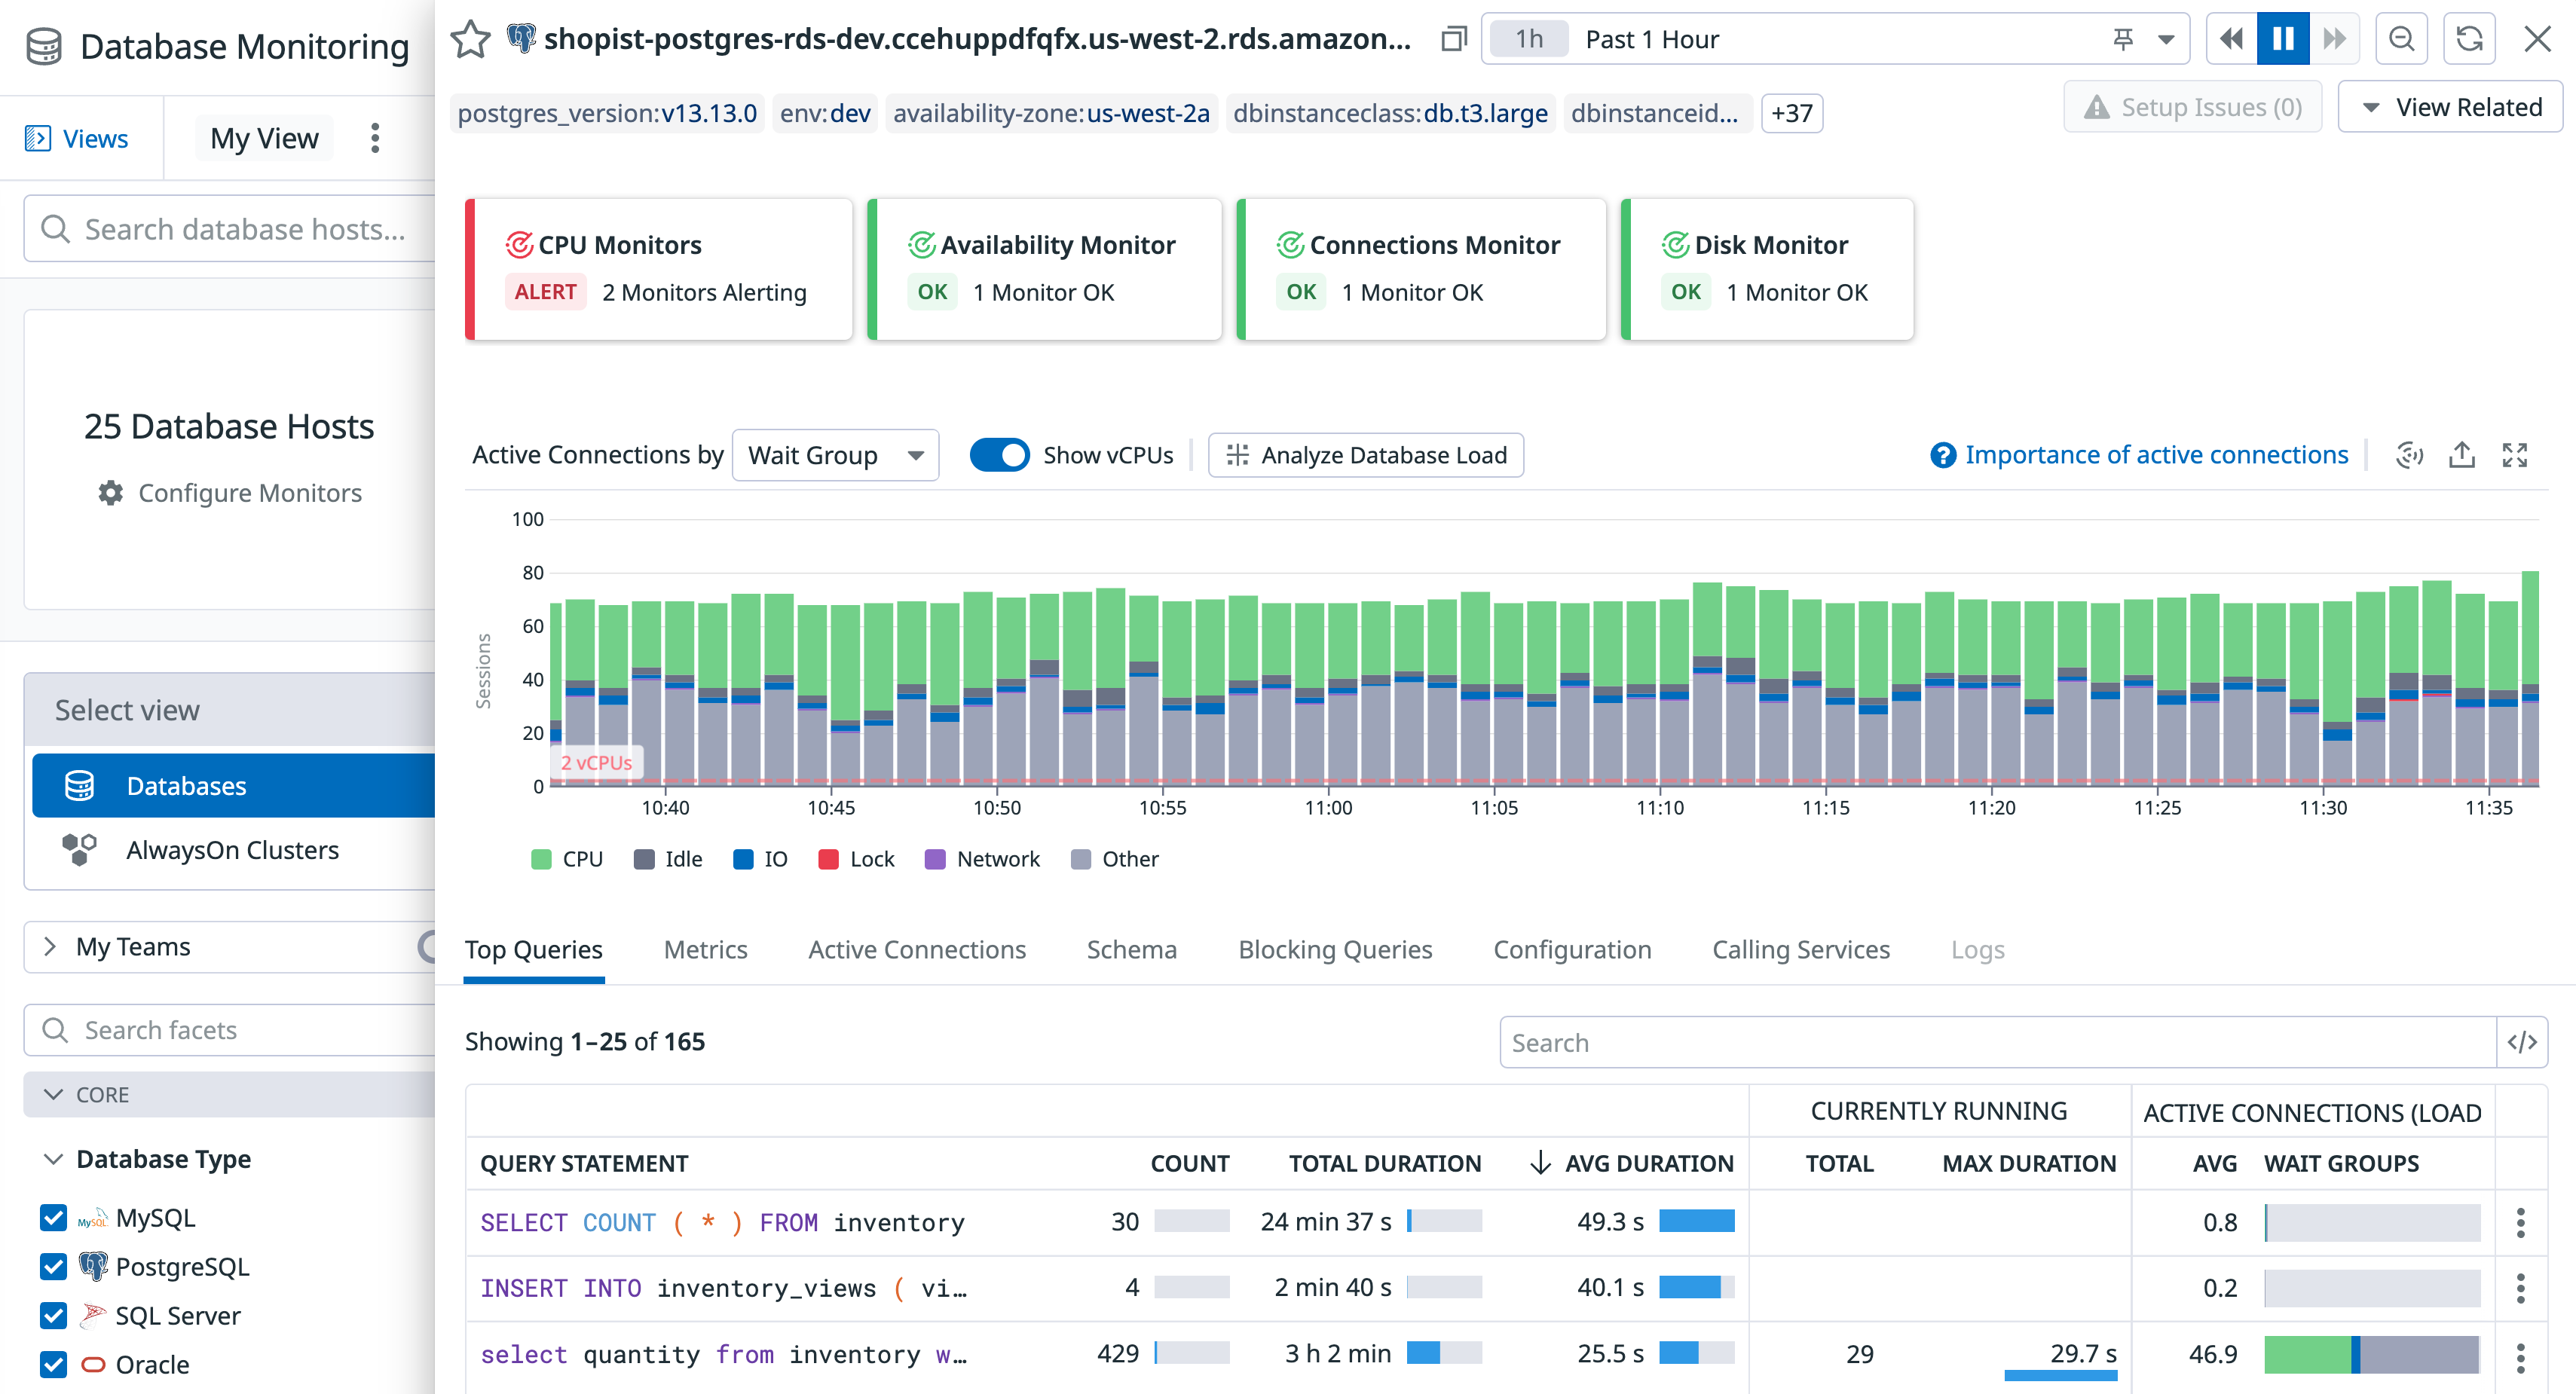
dbclusteridentifier tag from AWS. When this tag is present, a Group my RDS clusters toggle appears, grouping related RDS instances into clusters based on the identifier. No additional setup or manual tagging is required.On the Databases page, you can assess the health and activity of your database hosts. Sort and filter the list to prioritize hosts with triggered alerts, high query volume, and other criteria. Click on any host in the list to open a details panel:
In addition to a filterable graph of active connections for that host, the host details panel displays the following features.
| Postgres | SQL Server | MySQL | Oracle | |
|---|---|---|---|---|
| Top queries | ||||
| Stored procedures | ||||
| Metrics | ||||
| Active connections | ||||
| Schema | ||||
| Blocking queries | ||||
| Calling services | ||||
| Configuration details |
Top queries
On the Top Queries tab of the host details panel, you can sort the most common queries by maximum duration, average latency, and more.
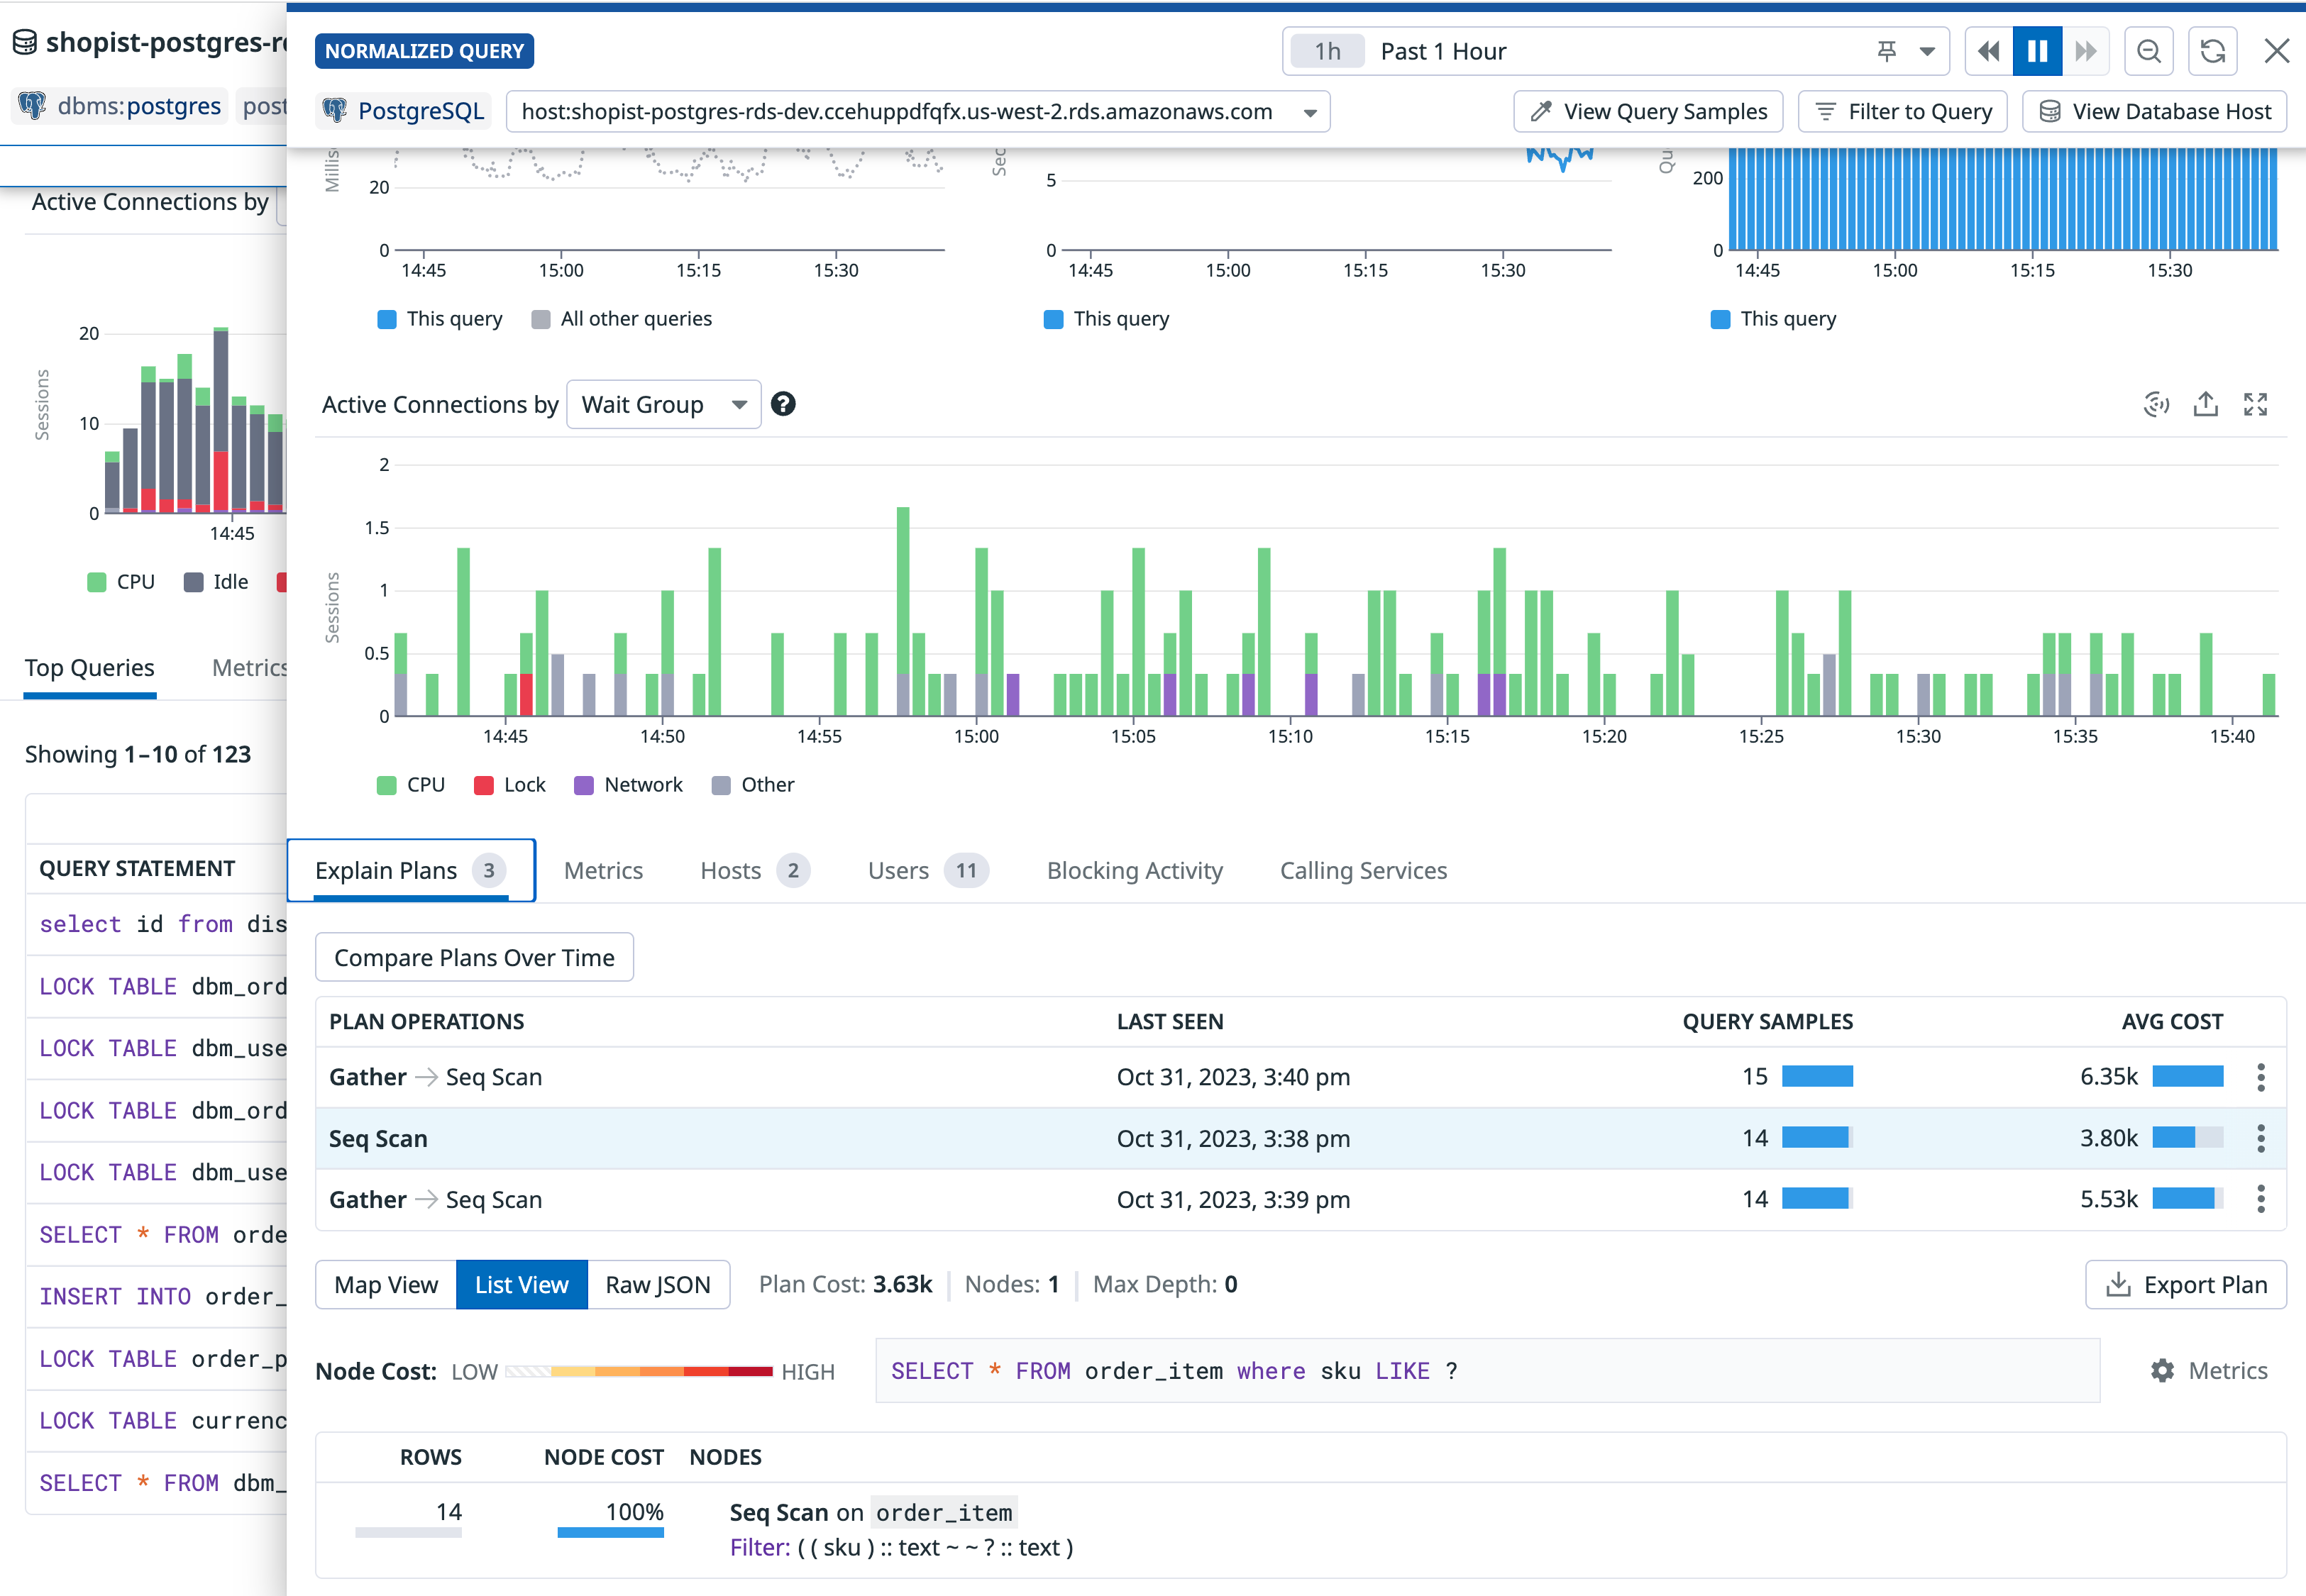
Click on any query statement to open a details panel that includes:
- query insights
- graphs for average latency and other key metrics
- explain plans
- blocking activity
- hosts that have run the query
- calling services
Stored procedures
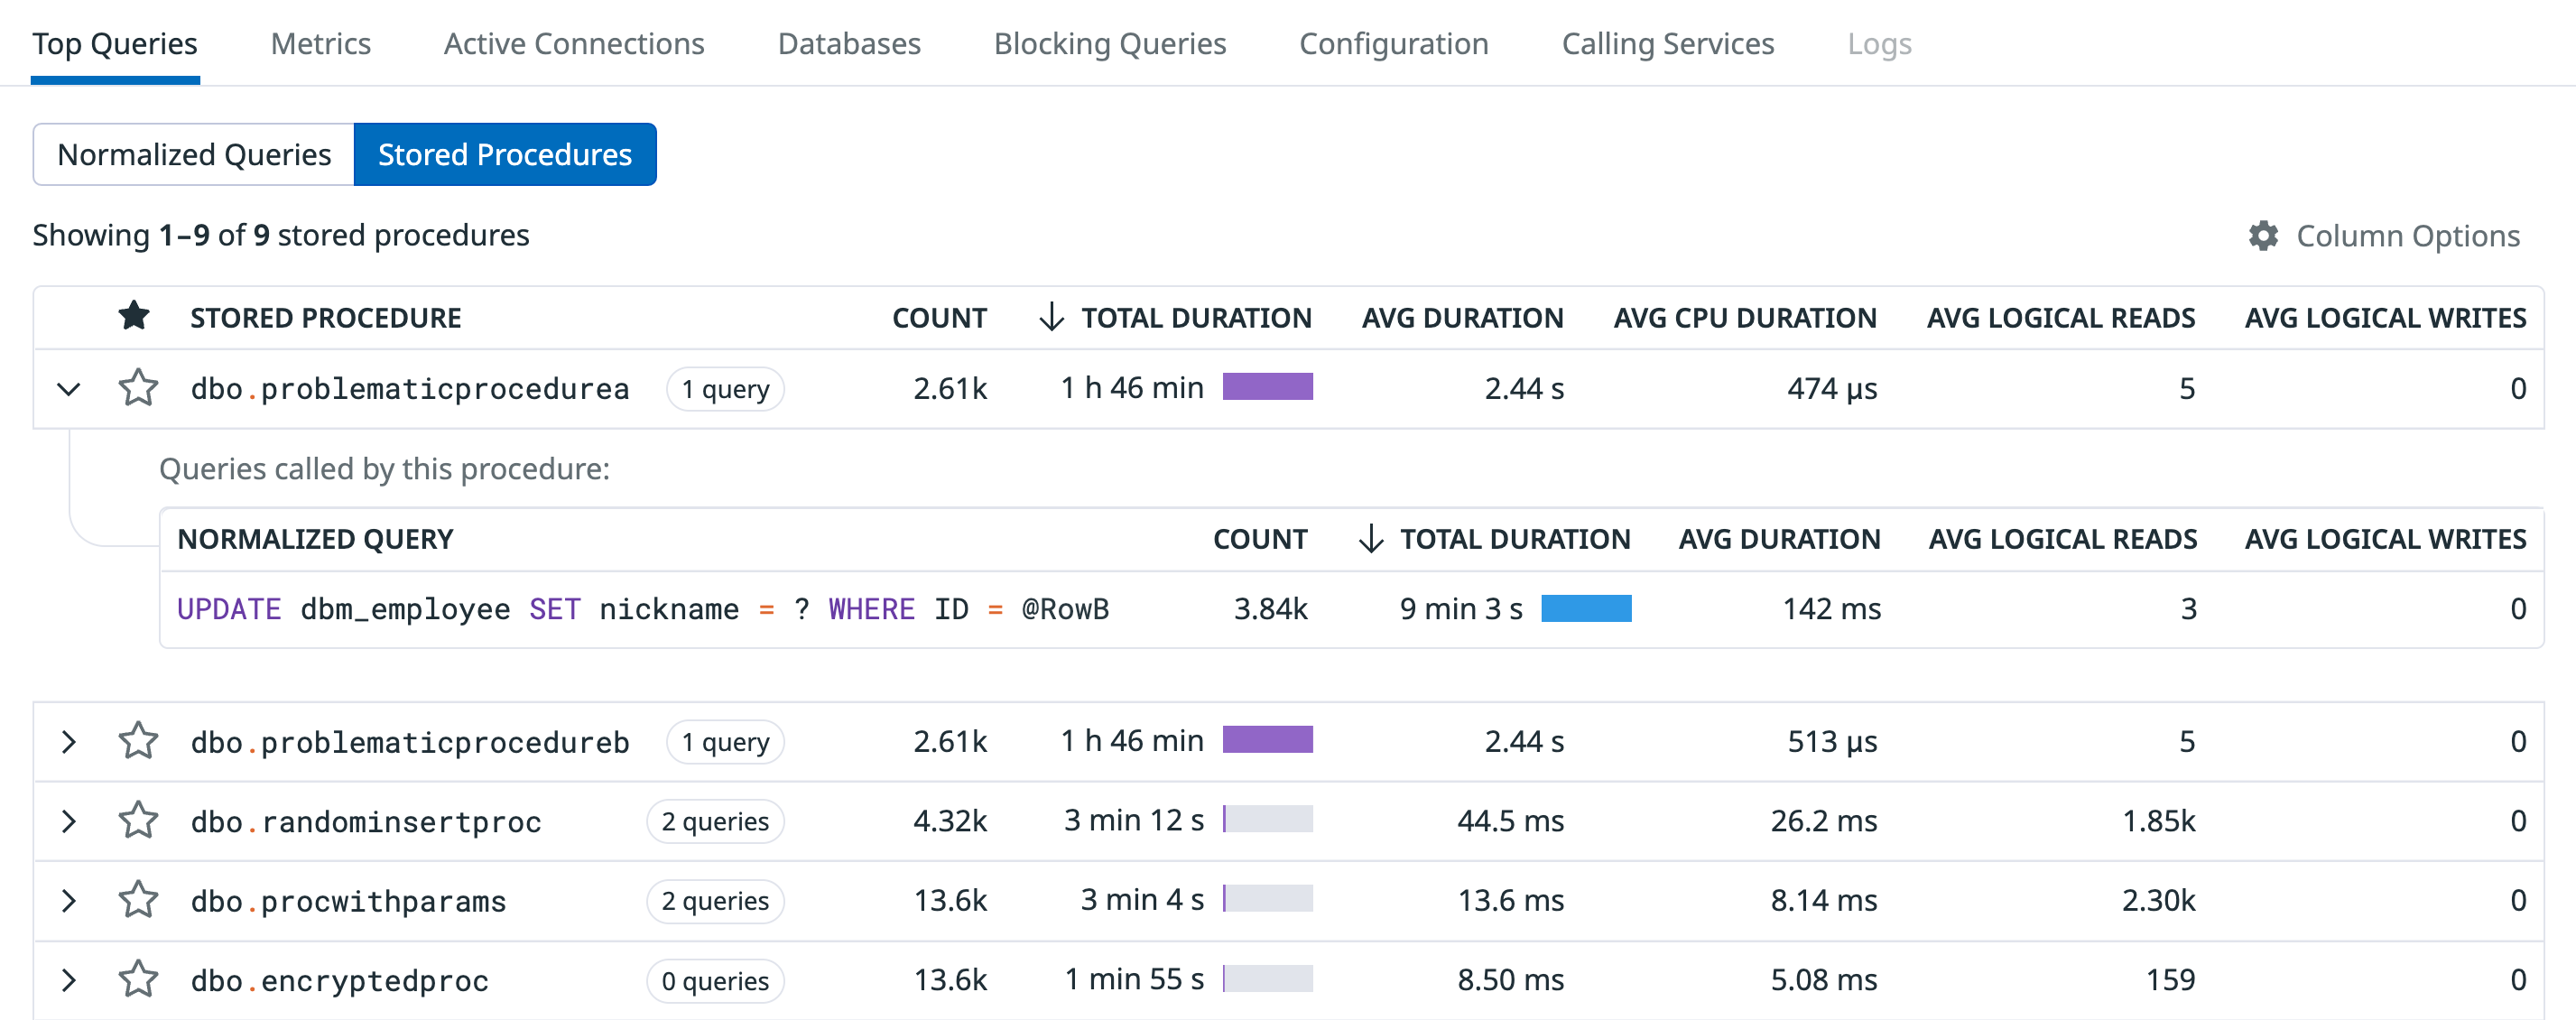
Where supported, the Top Queries tab includes a Stored Procedures section that lists each stored procedure by name, along with its average duration, logical reads count, logical writes count, and more. Expand a stored procedure to view its individual SQL queries, and click on a query to view its details panel.
Metrics
On the Metrics tab of the host details panel, you can view and filter metrics for system health, query activity, blocking operations, function performance, and other key areas.
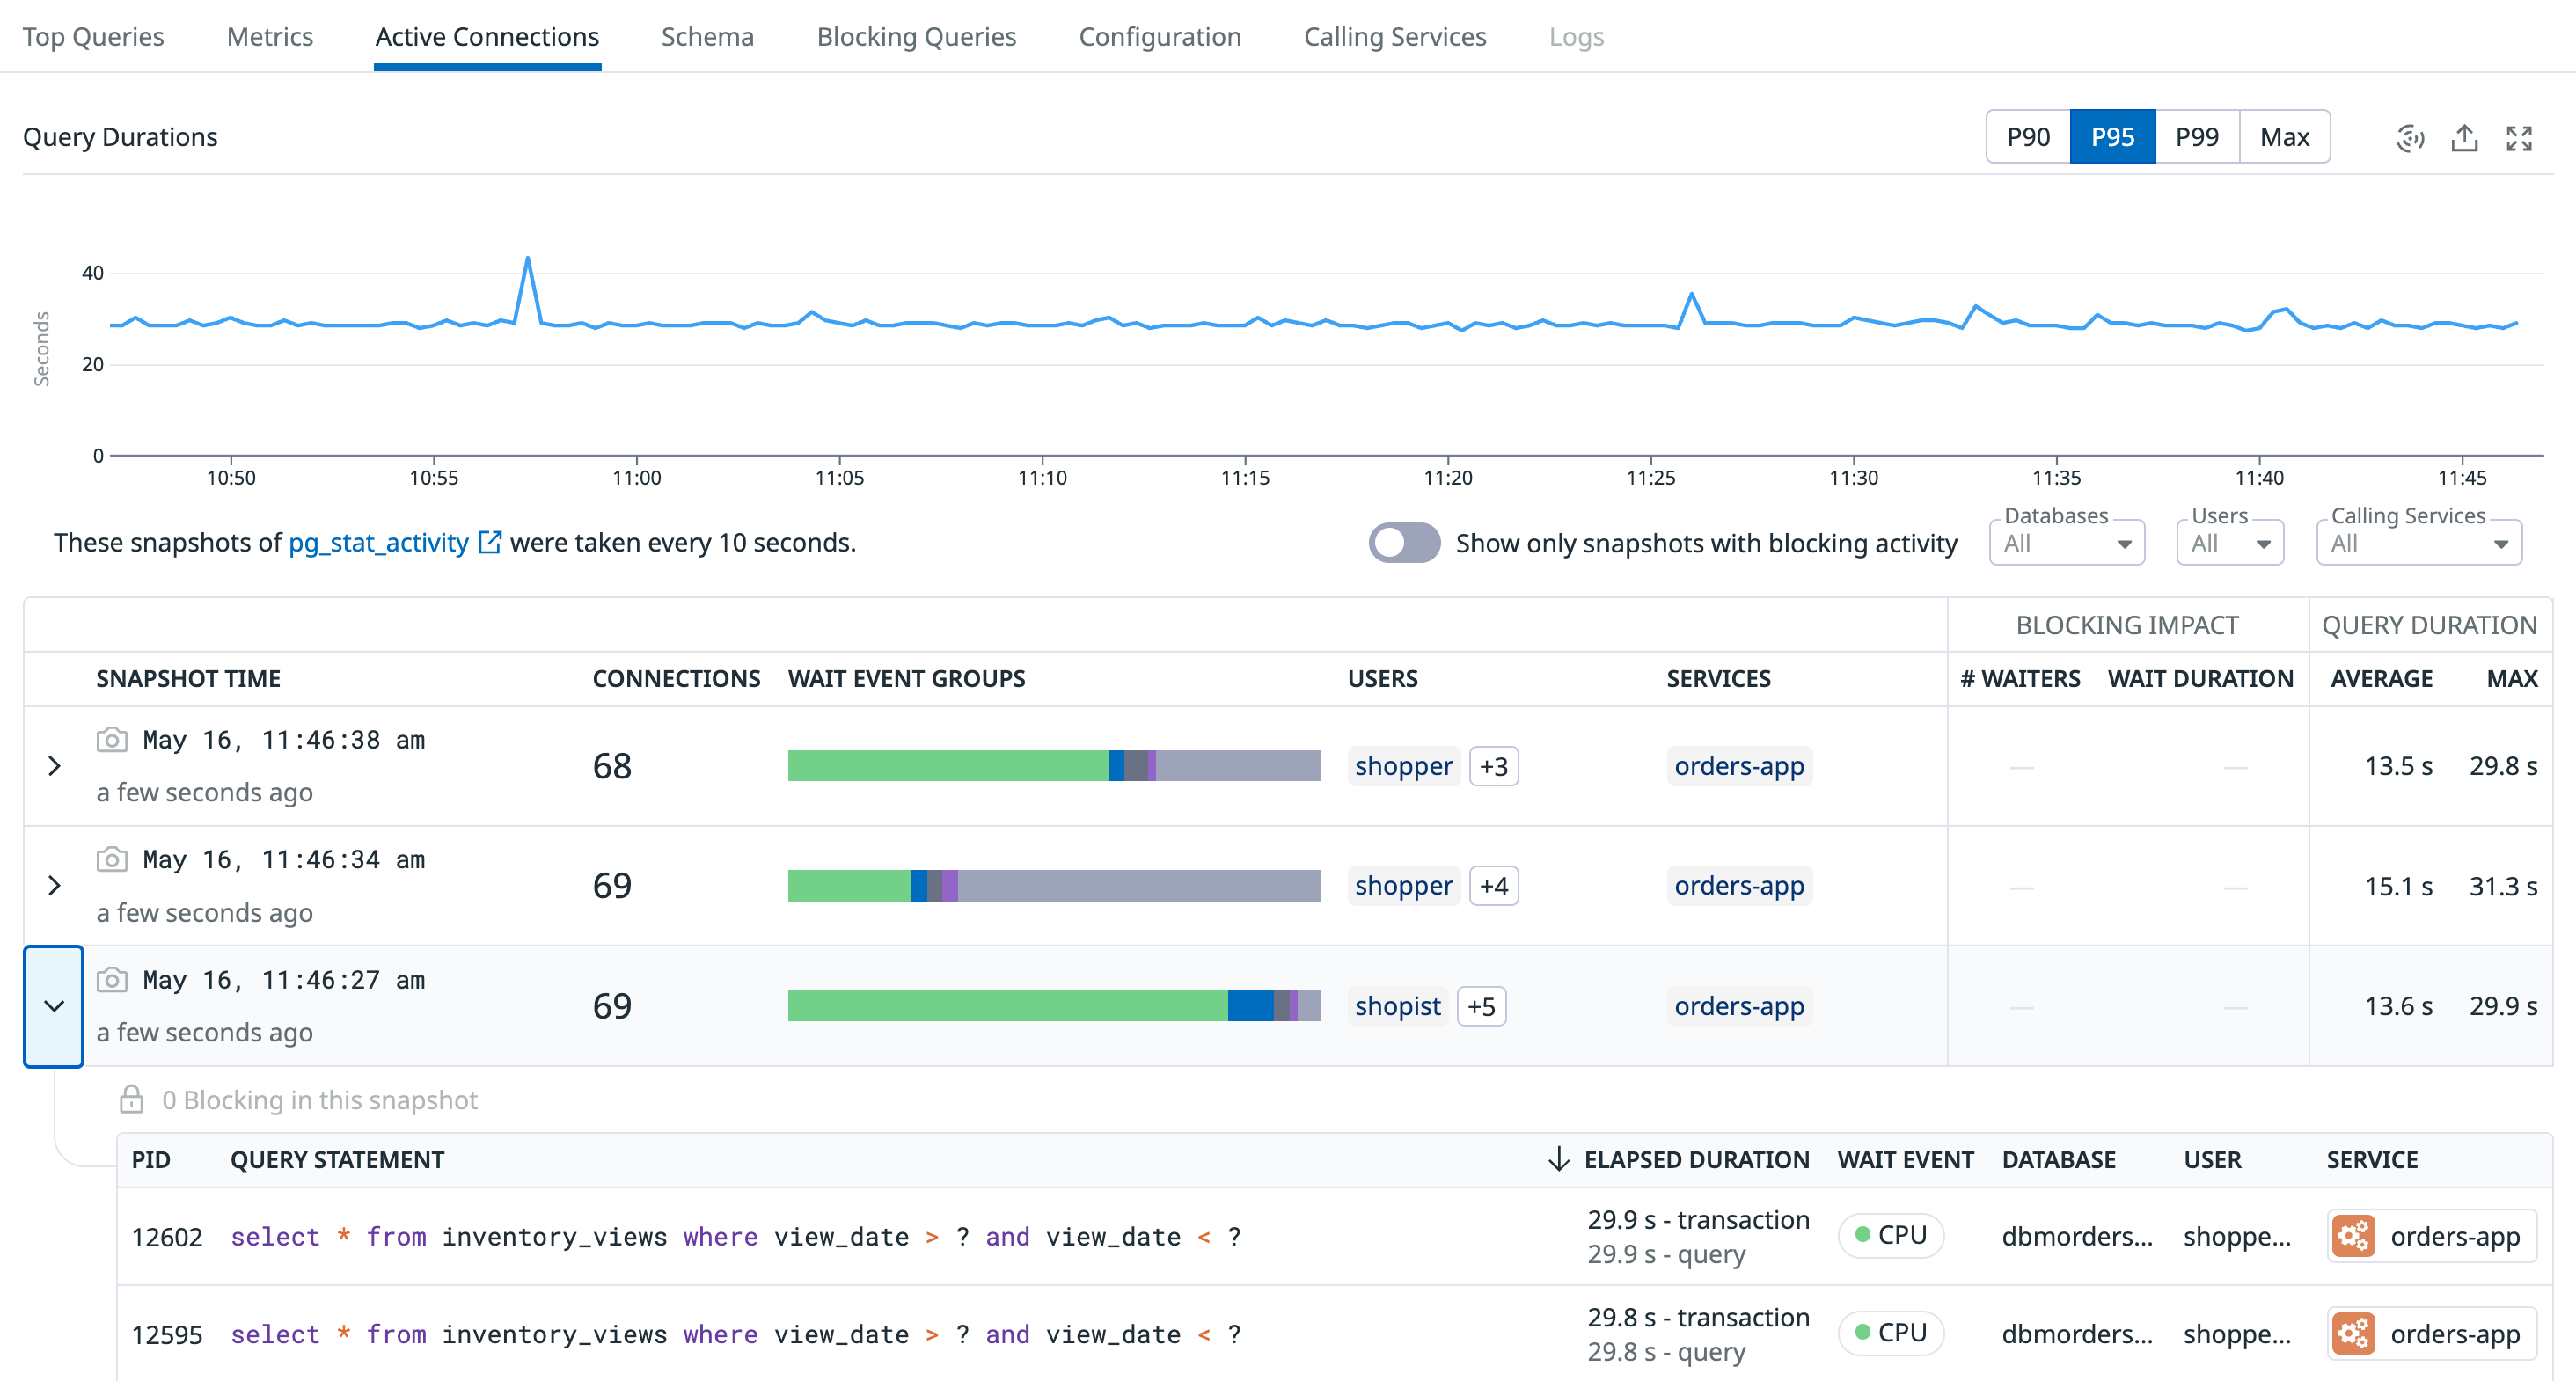
Active connections
The Active Connections tab of the host details panel displays the live queries being executed on the host. Click on a query statement to open a panel that includes event attributes, related traces, and other relevant details.
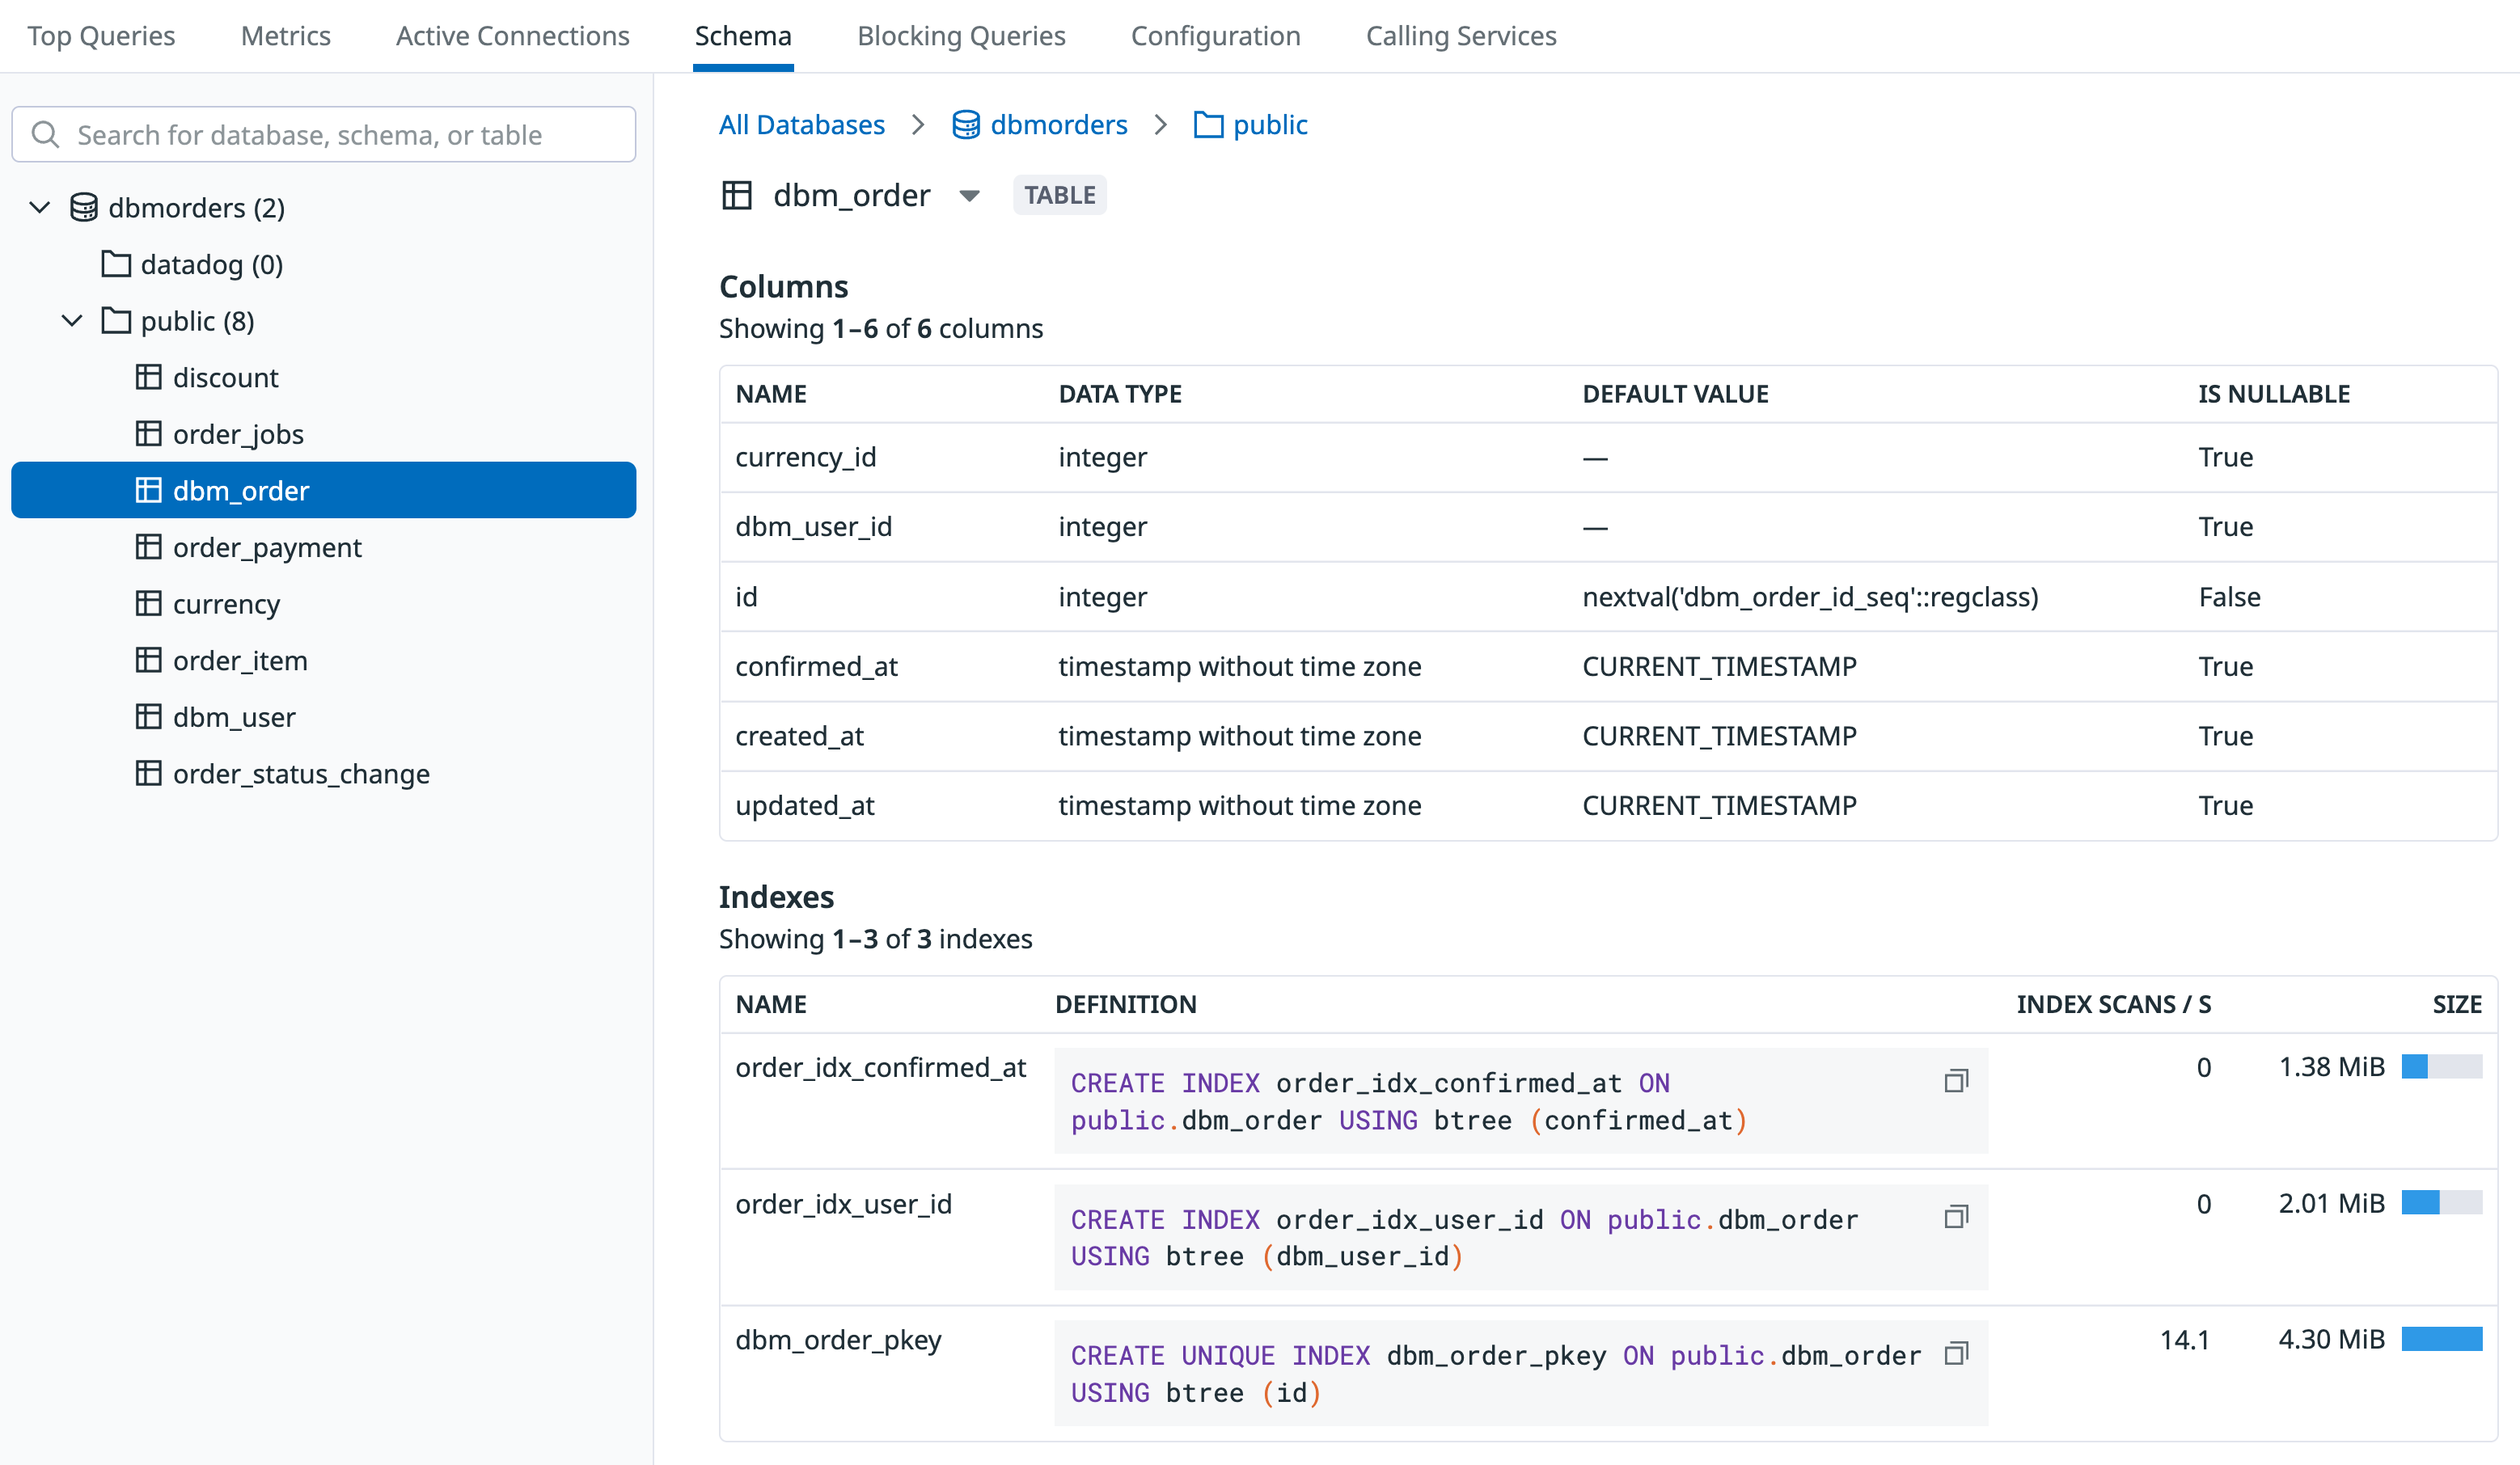
Schema
Use the Schema tab to explore database structures, tables, columns, data types, existing foreign keys, and indexing strategies for every database on a host.
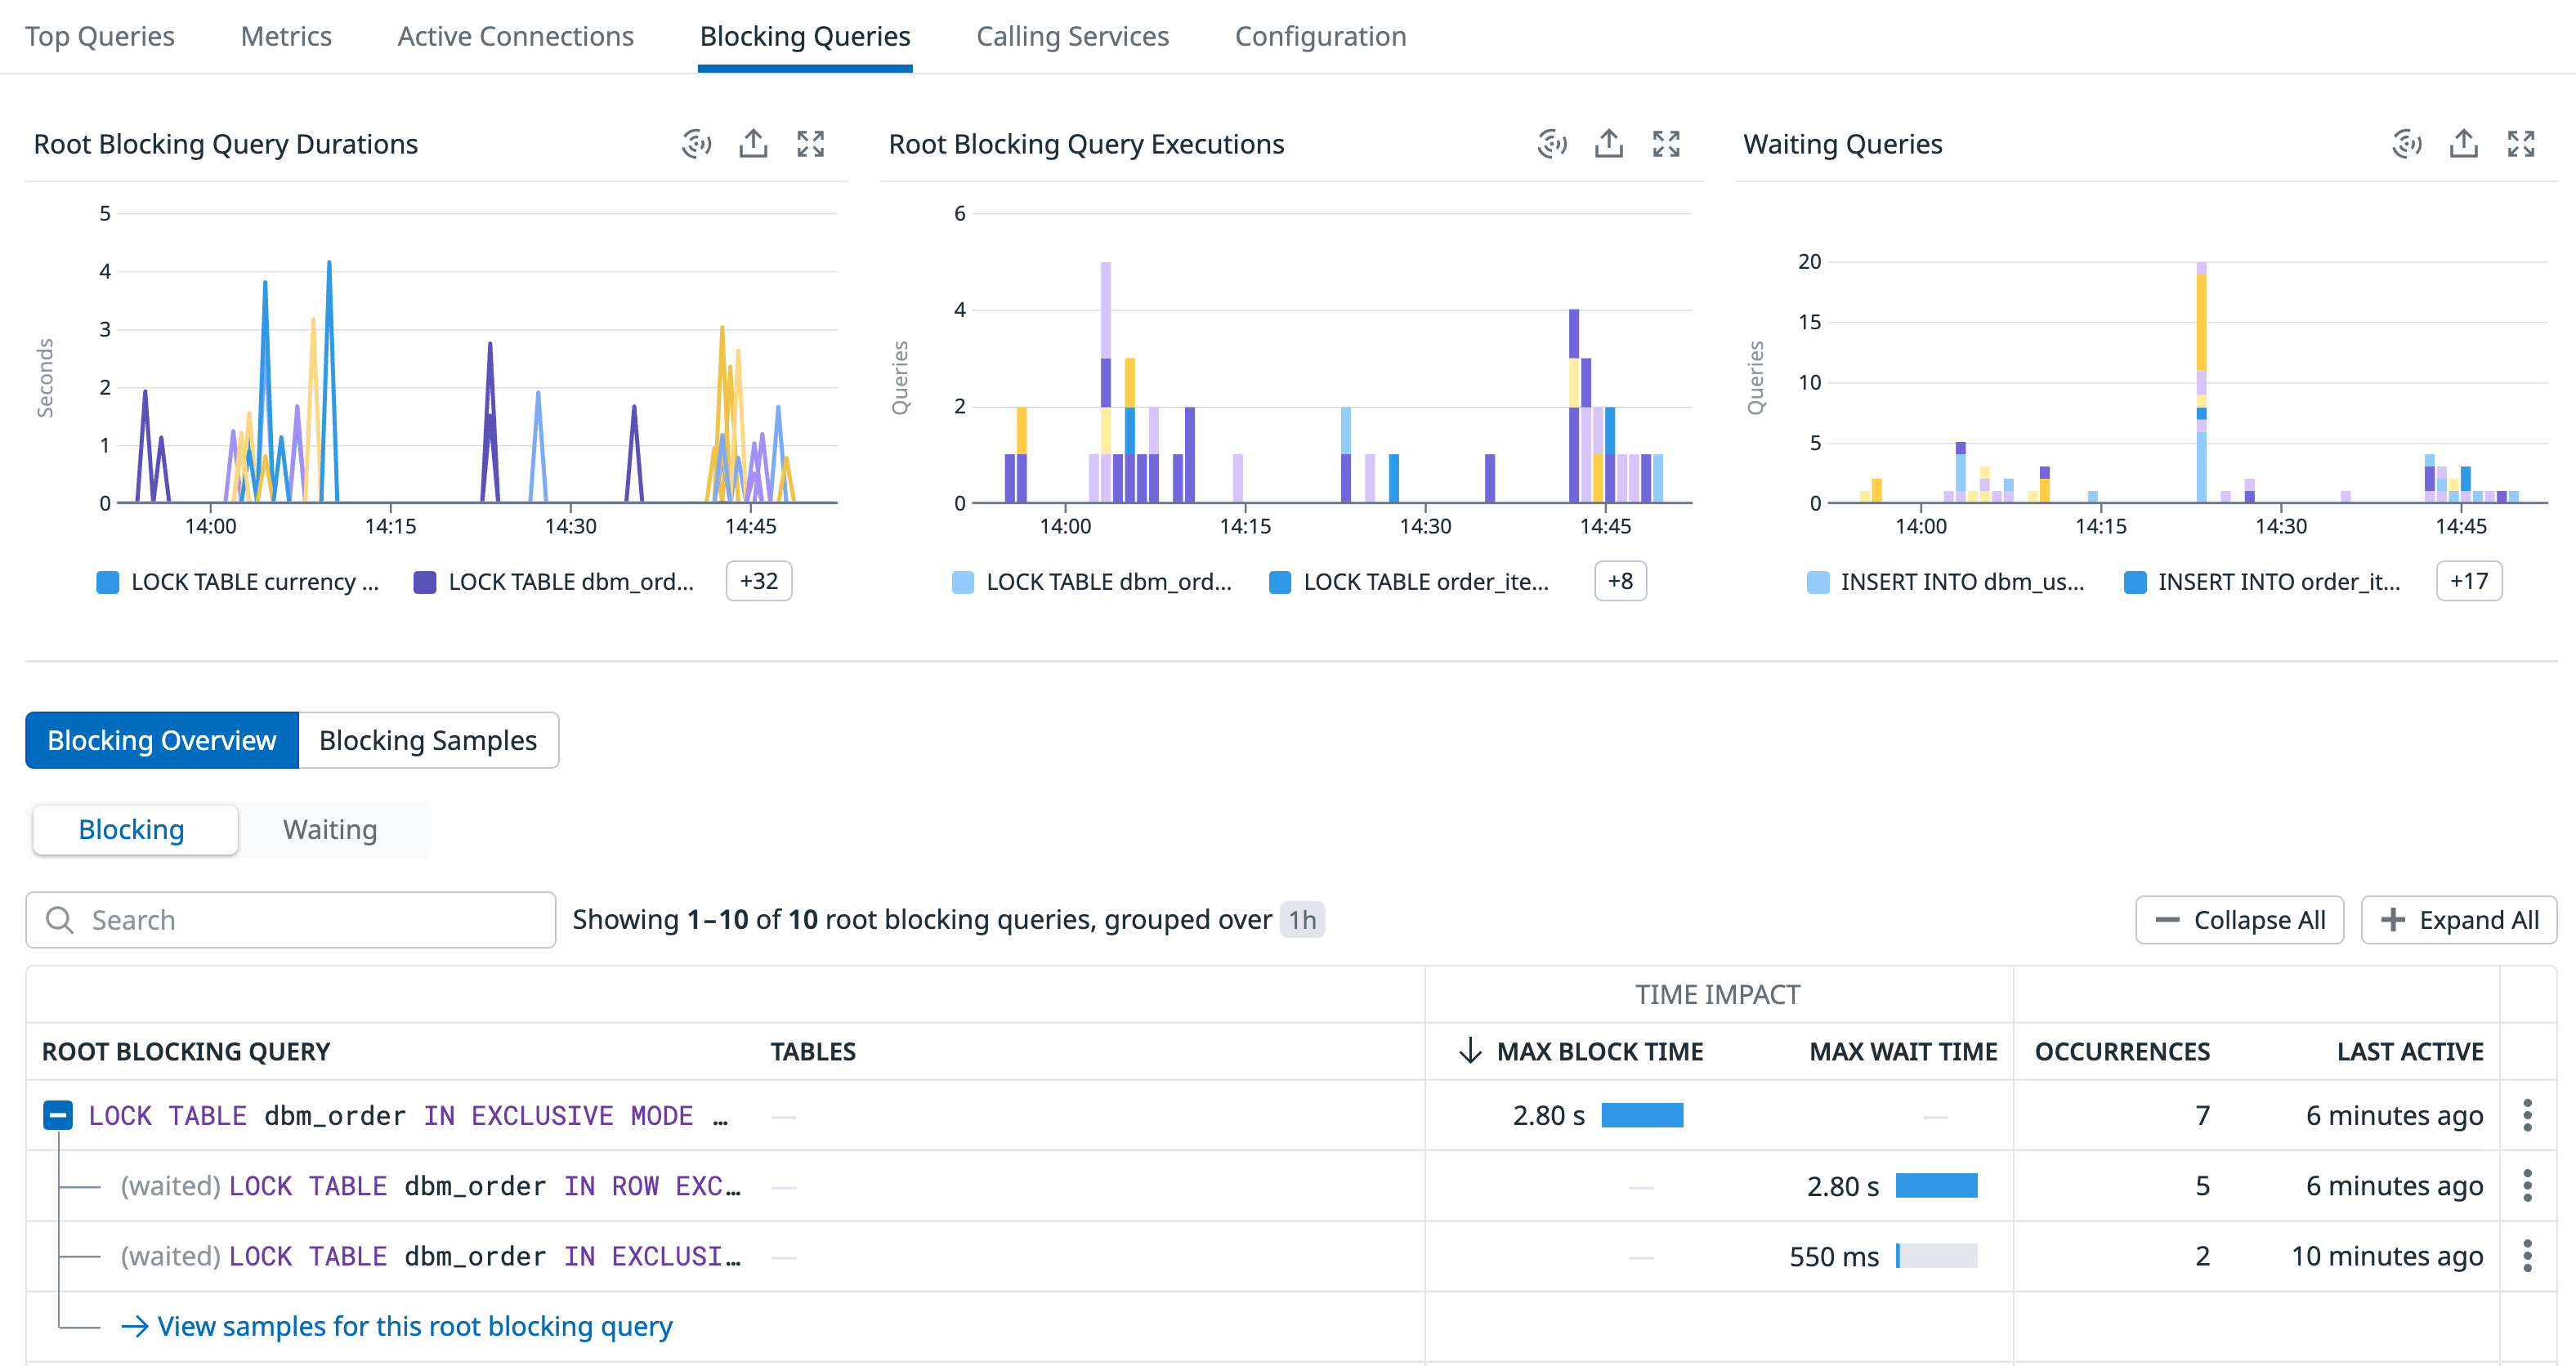
Blocking queries
On the Blocking Queries tab of host details panel, you can view visualizations for:
- blocking query durations
- blocking query executions
- the number of waiting queries
You can search and filter the queries or samples. Click any individual query row to view details.
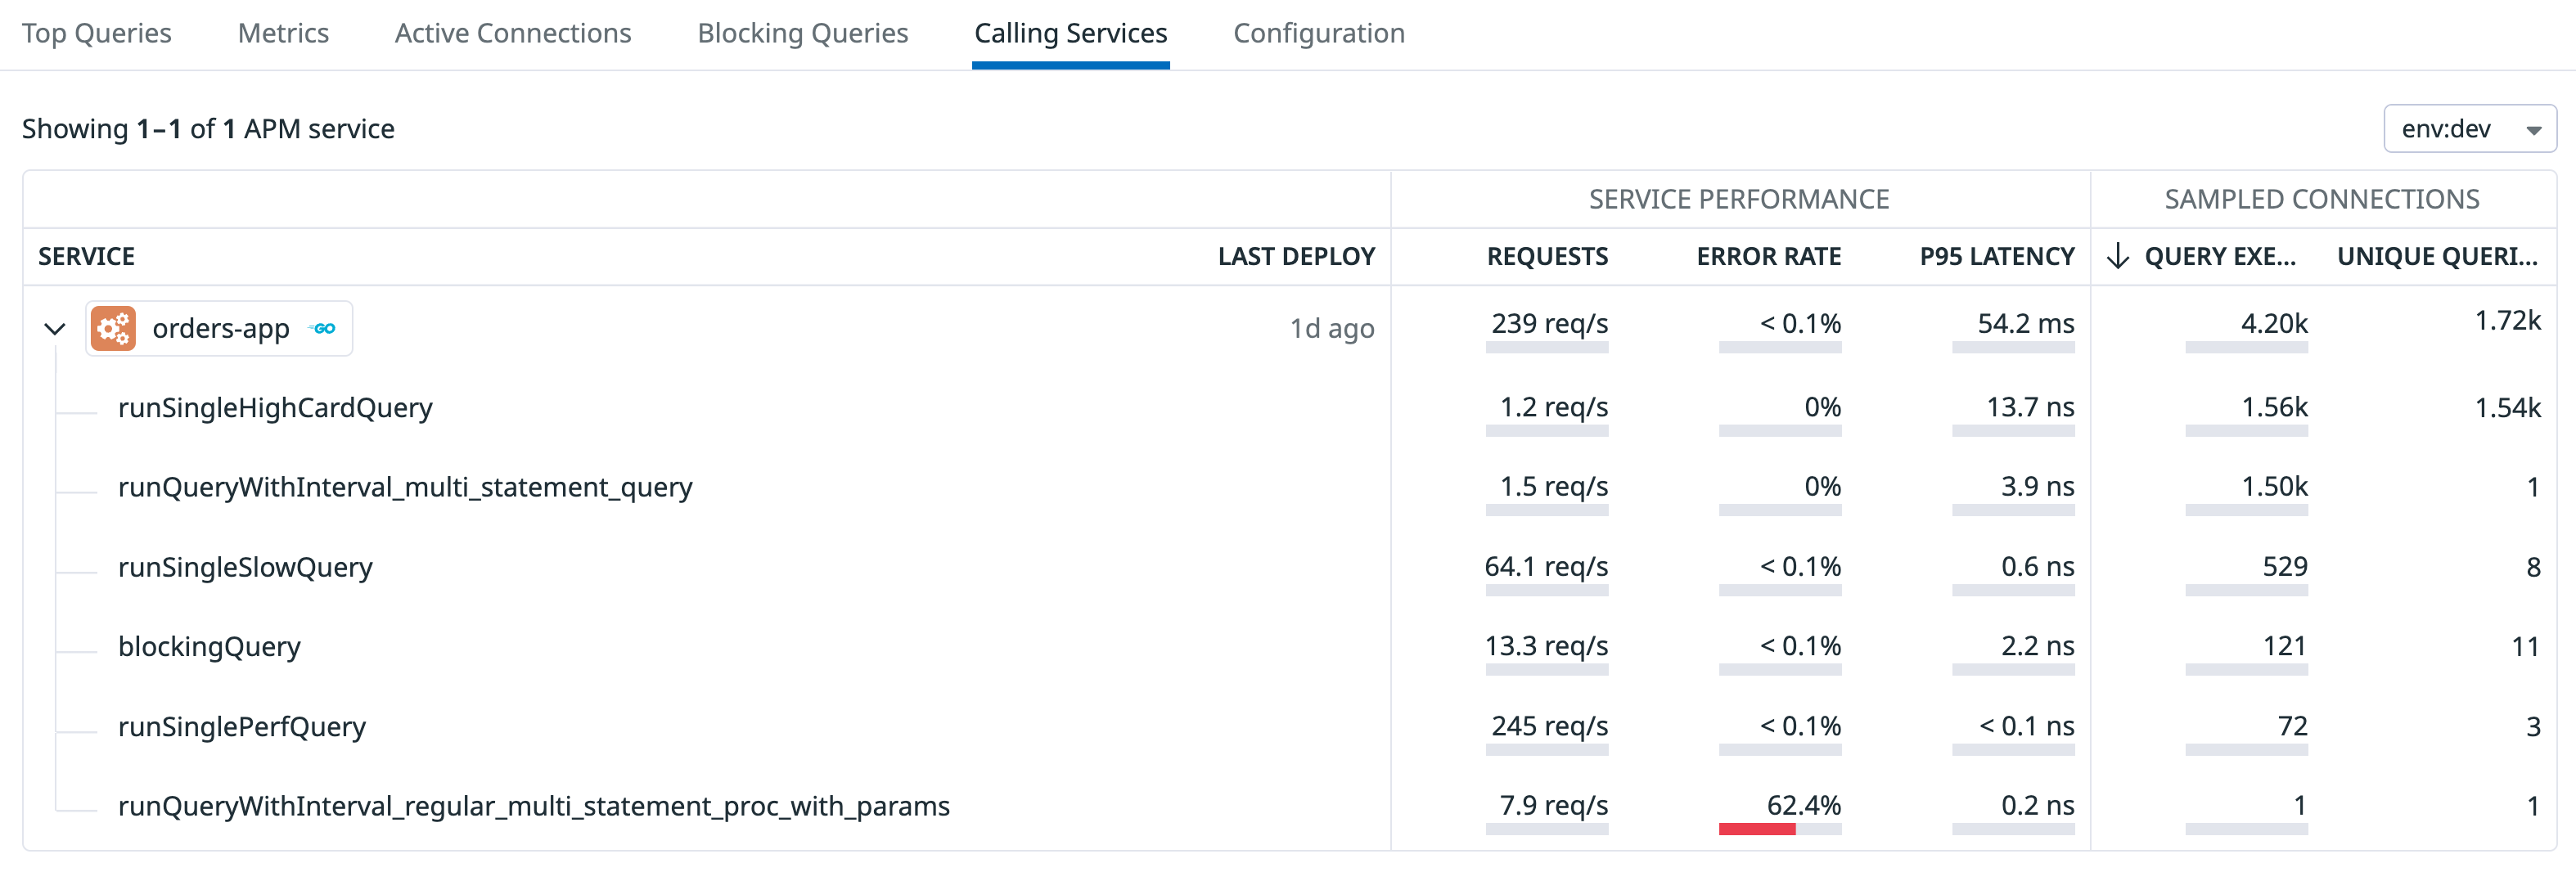
Calling services
On the Calling Services tab of the host details panel, you can view the list of services that have called the host. The displayed service information includes when the service was deployed, the number of requests made to the host per second, how many database queries were executed, and more.
Click any service row to view its APM dashboard.
Configuration details
The host must have
collect_settings enabled in its instance configuration for this feature to work properly.The Configuration tab of the host details panel provides a direct view into the host’s configuration parameters without compromising database security. Use it to identify misconfigured database parameters and adjust settings to optimize database performance.
