- Principales informations
- Getting Started
- Datadog
- Site Datadog
- DevSecOps
- Serverless for AWS Lambda
- Agent
- Intégrations
- Conteneurs
- Dashboards
- Monitors
- Logs
- Tracing
- Profileur
- Tags
- API
- Service Catalog
- Session Replay
- Continuous Testing
- Surveillance Synthetic
- Incident Management
- Database Monitoring
- Cloud Security Management
- Cloud SIEM
- Application Security Management
- Workflow Automation
- CI Visibility
- Test Visibility
- Intelligent Test Runner
- Code Analysis
- Learning Center
- Support
- Glossary
- Standard Attributes
- Guides
- Agent
- Intégrations
- OpenTelemetry
- Développeurs
- Authorization
- DogStatsD
- Checks custom
- Intégrations
- Create an Agent-based Integration
- Create an API Integration
- Create a Log Pipeline
- Integration Assets Reference
- Build a Marketplace Offering
- Create a Tile
- Create an Integration Dashboard
- Create a Recommended Monitor
- Create a Cloud SIEM Detection Rule
- OAuth for Integrations
- Install Agent Integration Developer Tool
- Checks de service
- IDE Plugins
- Communauté
- Guides
- Administrator's Guide
- API
- Application mobile
- CoScreen
- Cloudcraft
- In The App
- Dashboards
- Notebooks
- DDSQL Editor
- Alertes
- Infrastructure
- Métriques
- Watchdog
- Bits AI
- Service Catalog
- API Catalog
- Error Tracking
- Service Management
- Infrastructure
- Universal Service Monitoring
- Conteneurs
- Sans serveur
- Surveillance réseau
- Cloud Cost
- Application Performance
- APM
- Profileur en continu
- Database Monitoring
- Agent Integration Overhead
- Setup Architectures
- Configuration de Postgres
- Configuration de MySQL
- Configuration de SQL Server
- Setting Up Oracle
- Setting Up MongoDB
- Connecting DBM and Traces
- Données collectées
- Exploring Database Hosts
- Explorer les métriques de requête
- Explorer des échantillons de requêtes
- Dépannage
- Guides
- Data Streams Monitoring
- Data Jobs Monitoring
- Digital Experience
- RUM et Session Replay
- Product Analytics
- Surveillance Synthetic
- Continuous Testing
- Software Delivery
- CI Visibility
- CD Visibility
- Test Visibility
- Exécuteur de tests intelligent
- Code Analysis
- Quality Gates
- DORA Metrics
- Securité
- Security Overview
- Cloud SIEM
- Cloud Security Management
- Application Security Management
- AI Observability
- Log Management
- Pipelines d'observabilité
- Log Management
- Administration
Funnel Widget
Cette page n'est pas encore disponible en français, sa traduction est en cours.
Si vous avez des questions ou des retours sur notre projet de traduction actuel, n'hésitez pas à nous contacter.
Si vous avez des questions ou des retours sur notre projet de traduction actuel, n'hésitez pas à nous contacter.
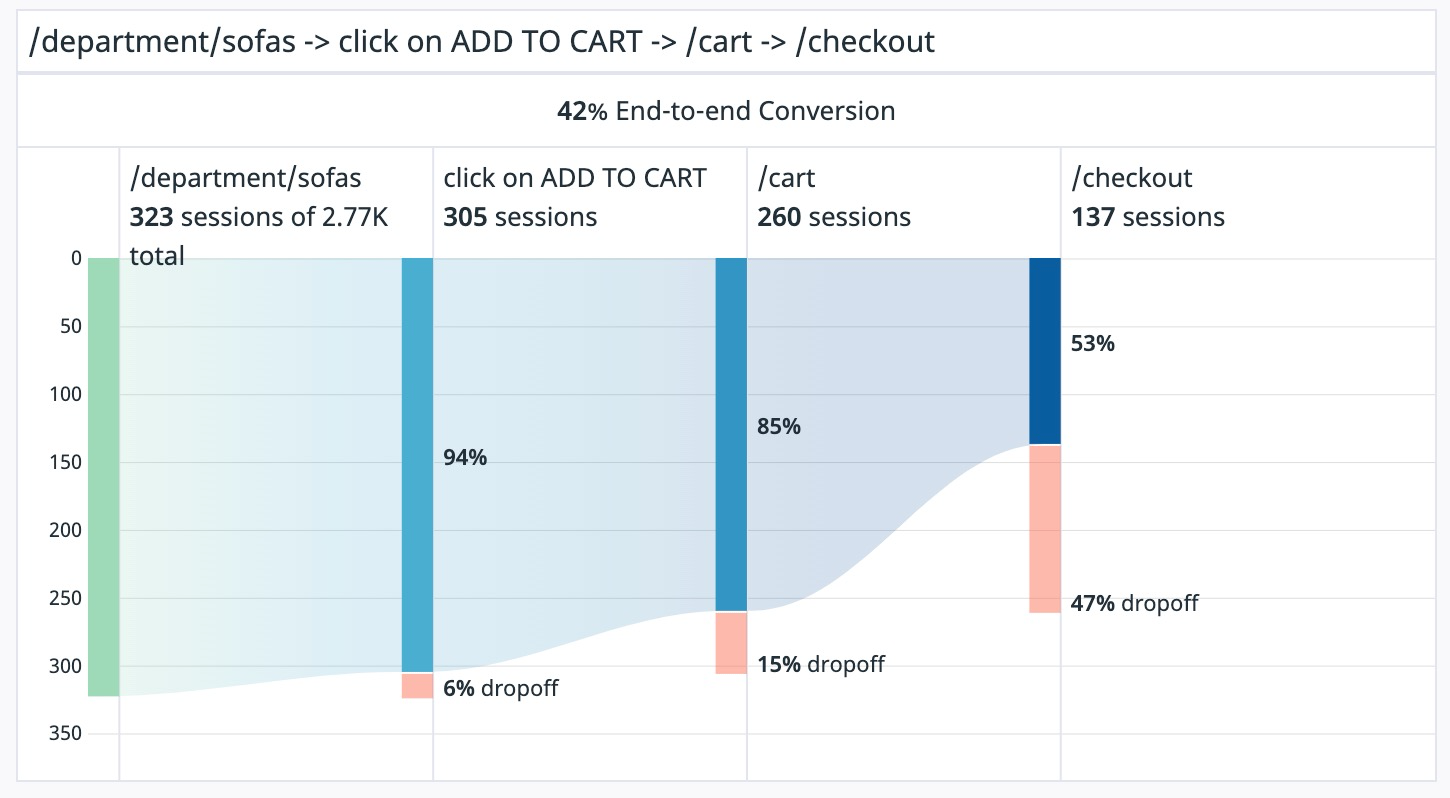
Funnel analysis helps you track conversion rates across key workflows to identify and address any bottlenecks in end-to-end user journeys. The funnel widget visualizes conversion rates across user workflows and end-to-end user journeys.
Setup
Configuration
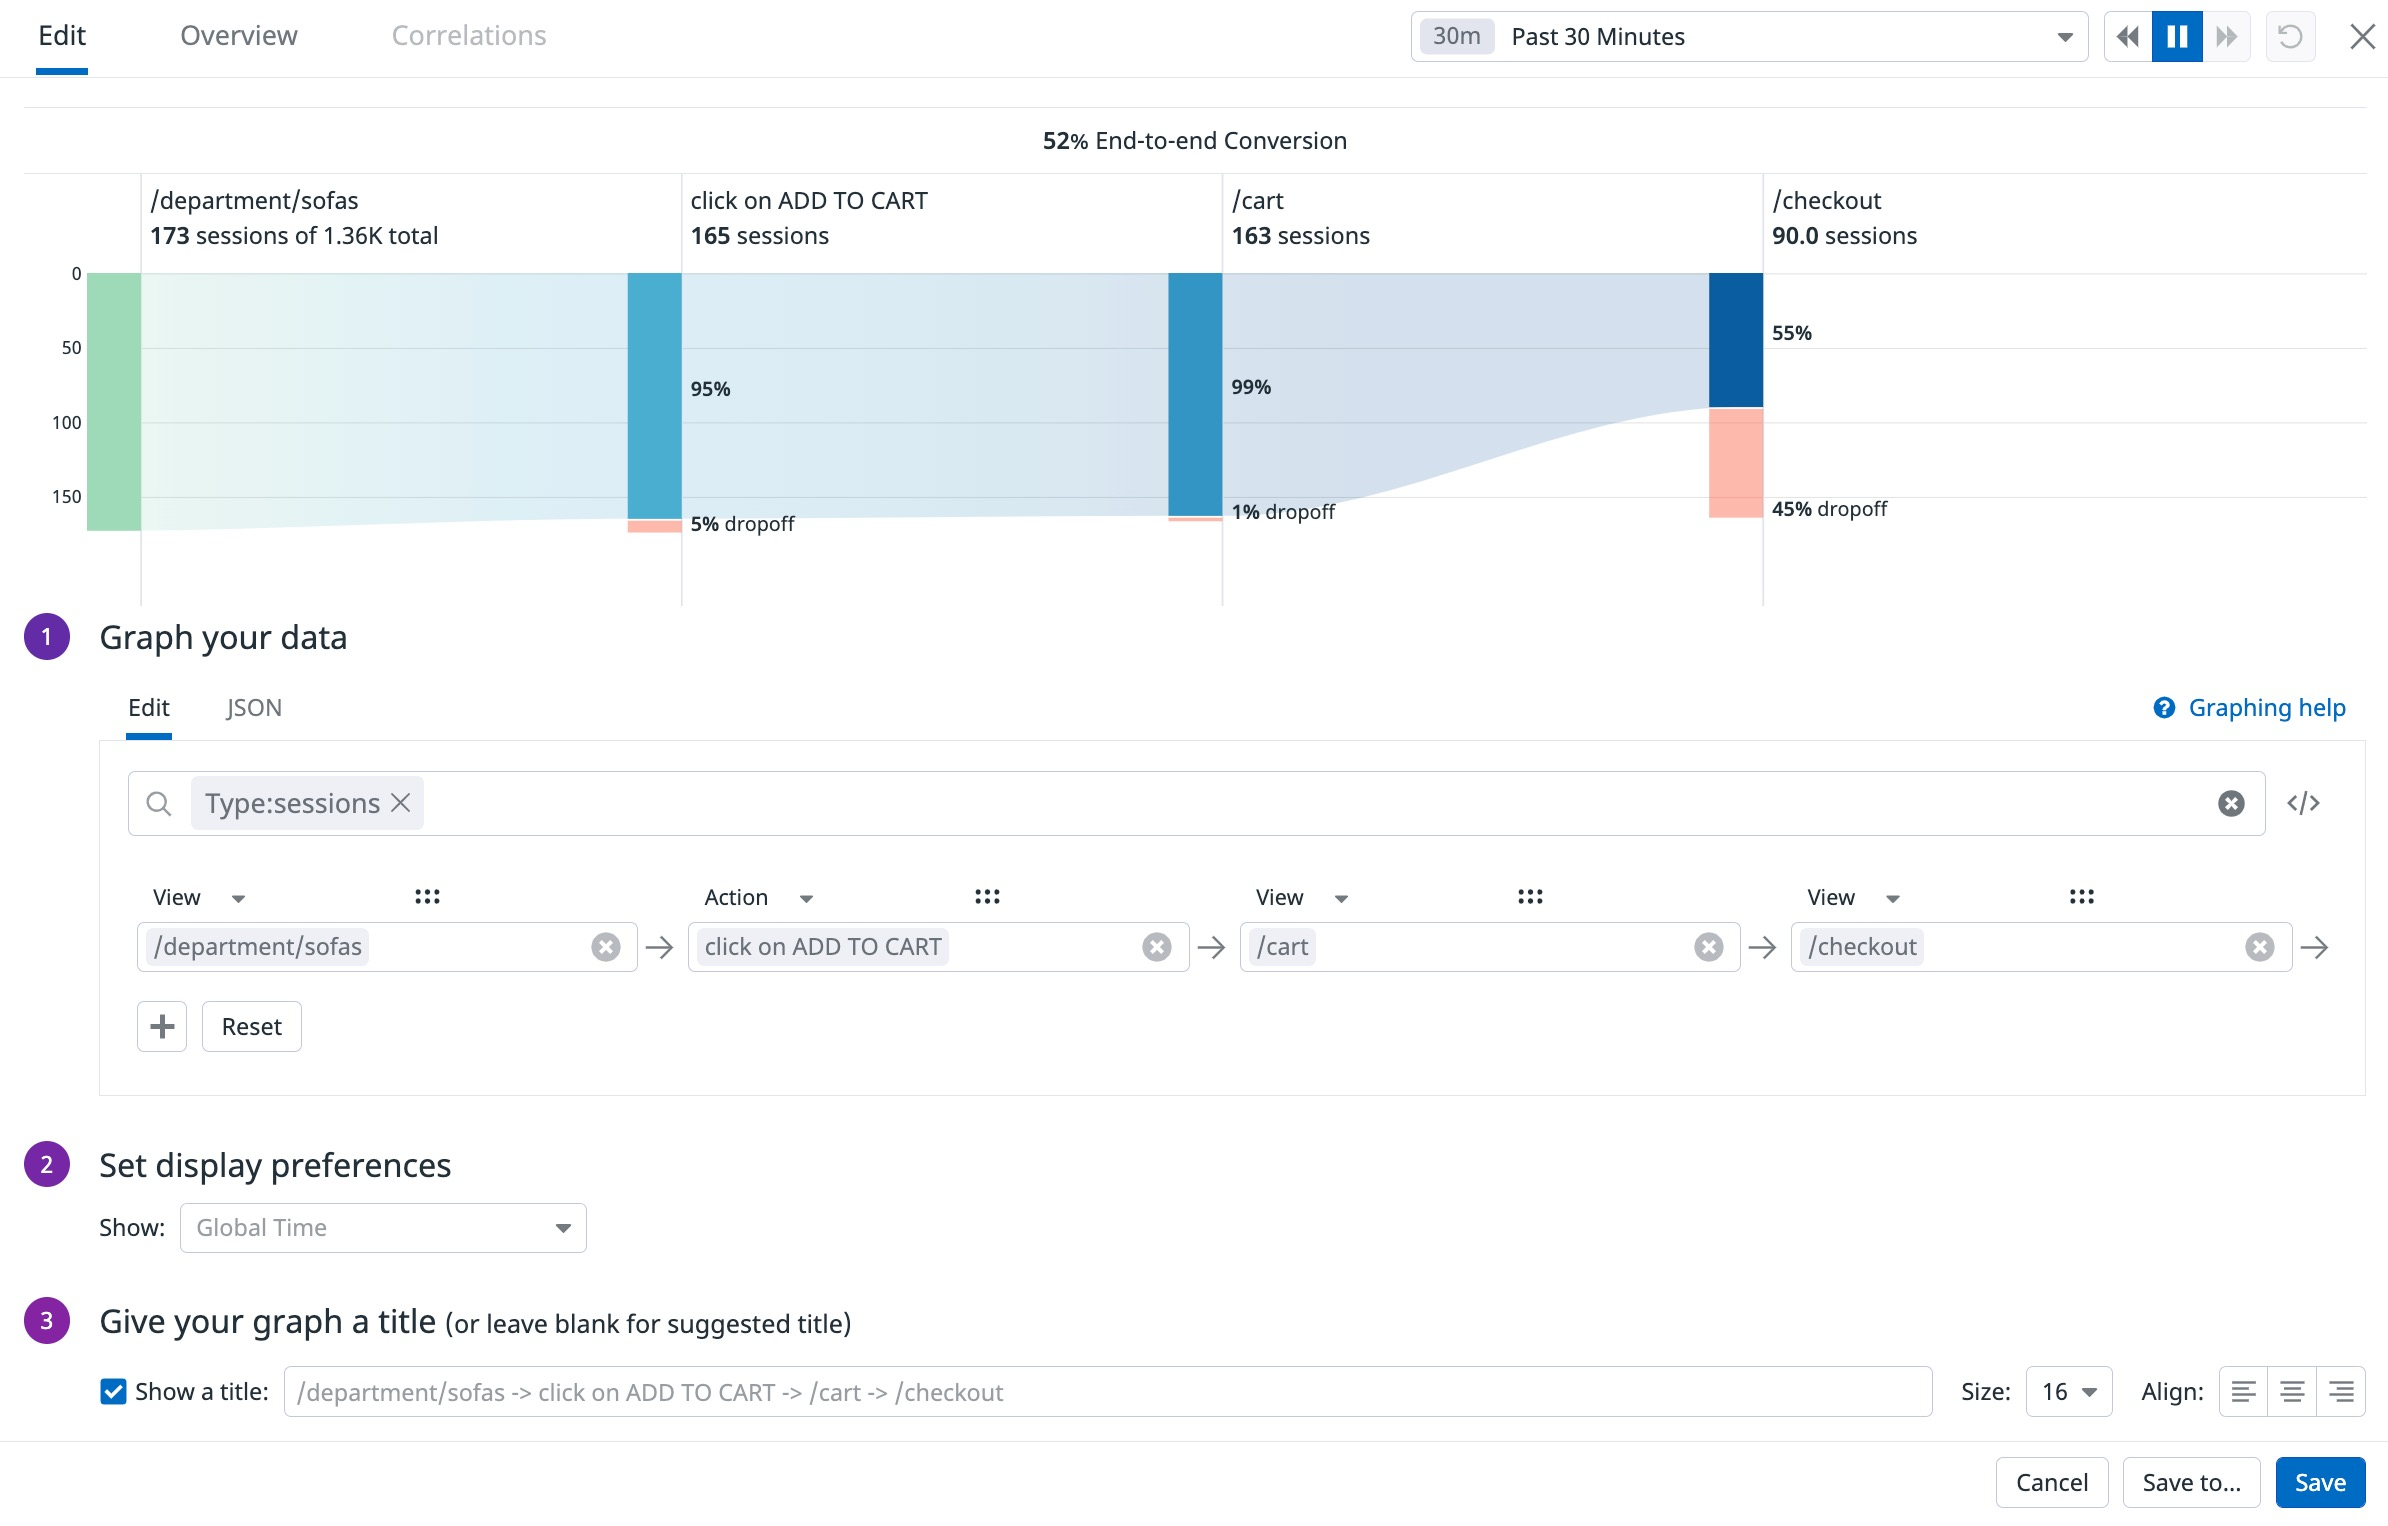
- Choose the data to graph:
- RUM: See the Search RUM Events documentation to configure a RUM query.
- Select View or Action and choose a query from the dropdown menu.
- Click the + button and select another query from the dropdown menu to visualize the funnel. See the RUM Visualize documentation for more information on visualizing Funnel analysis.
Options
Global time
On screenboards and notebooks, choose whether your widget has a custom timeframe or uses the global timeframe.
API
This widget can be used with the Dashboards API. See the following table for the widget JSON schema definition:
Champ
Type
Description
requests [required]
[object]
Request payload used to query items.
query [required]
object
Updated funnel widget.
data_source [required]
enum
Source from which to query items to display in the funnel.
Allowed enum values: rum
default: rum
query_string [required]
string
The widget query.
steps [required]
[object]
List of funnel steps.
facet [required]
string
The facet of the step.
value [required]
string
The value of the step.
request_type [required]
enum
Widget request type.
Allowed enum values: funnel
time
<oneOf>
Time setting for the widget.
Option 1
object
Wrapper for live span
live_span
enum
The available timeframes depend on the widget you are using.
Allowed enum values: 1m,5m,10m,15m,30m,1h,4h,1d,2d,1w,1mo,3mo,6mo,week_to_date,month_to_date,1y,alert
Option 2
object
Used for arbitrary live span times, such as 17 minutes or 6 hours.
type [required]
enum
Type "live" denotes a live span in the new format.
Allowed enum values: live
unit [required]
enum
Unit of the time span.
Allowed enum values: minute,hour,day,week,month,year
value [required]
int64
Value of the time span.
Option 3
object
Used for fixed span times, such as 'March 1 to March 7'.
from [required]
int64
Start time in seconds since epoch.
to [required]
int64
End time in seconds since epoch.
type [required]
enum
Type "fixed" denotes a fixed span.
Allowed enum values: fixed
title
string
The title of the widget.
title_align
enum
How to align the text on the widget.
Allowed enum values: center,left,right
title_size
string
The size of the title.
type [required]
enum
Type of funnel widget.
Allowed enum values: funnel
default: funnel
{
  "requests": [
    {
      "query": {
        "data_source": "rum",
        "query_string": "@browser.name:Chrome",
        "steps": [
          {
            "facet": "@view.name",
            "value": "/apm/home"
          }
        ]
      },
      "request_type": "funnel"
    }
  ],
  "time": {
    "live_span": "5m"
  },
  "title": "string",
  "title_align": "string",
  "title_size": "string",
  "type": "funnel"
}
Further Reading
Documentation, liens et articles supplémentaires utiles:


