- Principales informations
- Getting Started
- Agent
- API
- Tracing
- Conteneurs
- Dashboards
- Database Monitoring
- Datadog
- Site Datadog
- DevSecOps
- Incident Management
- Intégrations
- Internal Developer Portal
- Logs
- Monitors
- OpenTelemetry
- Profileur
- Session Replay
- Security
- Serverless for AWS Lambda
- Software Delivery
- Surveillance Synthetic
- Tags
- Workflow Automation
- Learning Center
- Support
- Glossary
- Standard Attributes
- Guides
- Agent
- Intégrations
- Développeurs
- OpenTelemetry
- Administrator's Guide
- API
- Partners
- Application mobile
- DDSQL Reference
- CoScreen
- CoTerm
- Remote Configuration
- Cloudcraft
- In The App
- Dashboards
- Notebooks
- DDSQL Editor
- Reference Tables
- Sheets
- Alertes
- Watchdog
- Métriques
- Bits AI
- Internal Developer Portal
- Error Tracking
- Change Tracking
- Service Management
- Actions & Remediations
- Infrastructure
- Cloudcraft
- Resource Catalog
- Universal Service Monitoring
- Hosts
- Conteneurs
- Processes
- Sans serveur
- Surveillance réseau
- Cloud Cost
- Application Performance
- APM
- Termes et concepts de l'APM
- Sending Traces to Datadog
- APM Metrics Collection
- Trace Pipeline Configuration
- Connect Traces with Other Telemetry
- Trace Explorer
- Recommendations
- Code Origin for Spans
- Observabilité des services
- Endpoint Observability
- Dynamic Instrumentation
- Live Debugger
- Suivi des erreurs
- Sécurité des données
- Guides
- Dépannage
- Profileur en continu
- Database Monitoring
- Agent Integration Overhead
- Setup Architectures
- Configuration de Postgres
- Configuration de MySQL
- Configuration de SQL Server
- Setting Up Oracle
- Setting Up Amazon DocumentDB
- Setting Up MongoDB
- Connecting DBM and Traces
- Données collectées
- Exploring Database Hosts
- Explorer les métriques de requête
- Explorer des échantillons de requêtes
- Exploring Database Schemas
- Exploring Recommendations
- Dépannage
- Guides
- Data Streams Monitoring
- Data Jobs Monitoring
- Data Observability
- Digital Experience
- RUM et Session Replay
- Surveillance Synthetic
- Continuous Testing
- Product Analytics
- Software Delivery
- CI Visibility
- CD Visibility
- Deployment Gates
- Test Visibility
- Code Coverage
- Quality Gates
- DORA Metrics
- Feature Flags
- Securité
- Security Overview
- Cloud SIEM
- Code Security
- Cloud Security Management
- Application Security Management
- Workload Protection
- Sensitive Data Scanner
- AI Observability
- Log Management
- Pipelines d'observabilité
- Log Management
- CloudPrem
- Administration
Watchdog Explains
Présentation
Watchdog Explains est un assistant d’investigation qui détecte les anomalies sur les graphiques de séries temporelles et identifie quels tags y contribuent. Cela vous permet de concentrer immédiatement votre investigation sur les zones problématiques de votre infrastructure ou de votre pile logicielle.
Pour désactiver Watchdog Explains, consultez la section Désactivation de la détection d’anomalies.
Watchdog Explains est disponible pour les widgets de séries temporelles avec des données Metric (agrégation avg, sum, min et max).
Comment Watchdog Explains détecte les anomalies
Watchdog Explains applique la détection d’anomalies aux graphiques de votre dashboard en analysant à la fois la forme et la valeur des séries temporelles sous-jacentes. Il identifie les écarts par rapport aux modèles historiques, signalant les pics, les chutes ou les dérives graduelles qui ne correspondent pas au comportement attendu.
Pour tenir compte de la saisonnalité, l’algorithme remonte jusqu’à trois semaines dans le temps. Par exemple, si un pic apparaît un lundi à 9h00, Watchdog compare ce point de données aux lundis précédents à la même heure. Si des modèles similaires apparaissent de manière cohérente, le pic est traité comme saisonnier et n’est pas signalé comme une anomalie. Cela permet de réduire les faux positifs et de garantir que seuls les écarts inattendus sont mis en évidence.
Les anomalies peuvent être des pics ou des chutes brusques, mais peuvent également être des tendances plus subtiles comme des changements d’étape ou des changements de pente.
La détection d'anomalies dans Watchdog Explains fonctionne avec les données Metrics (agrégation avg, sum, min et max).
Watchdog Explains isole la cause avec l’analyse dimensionnelle
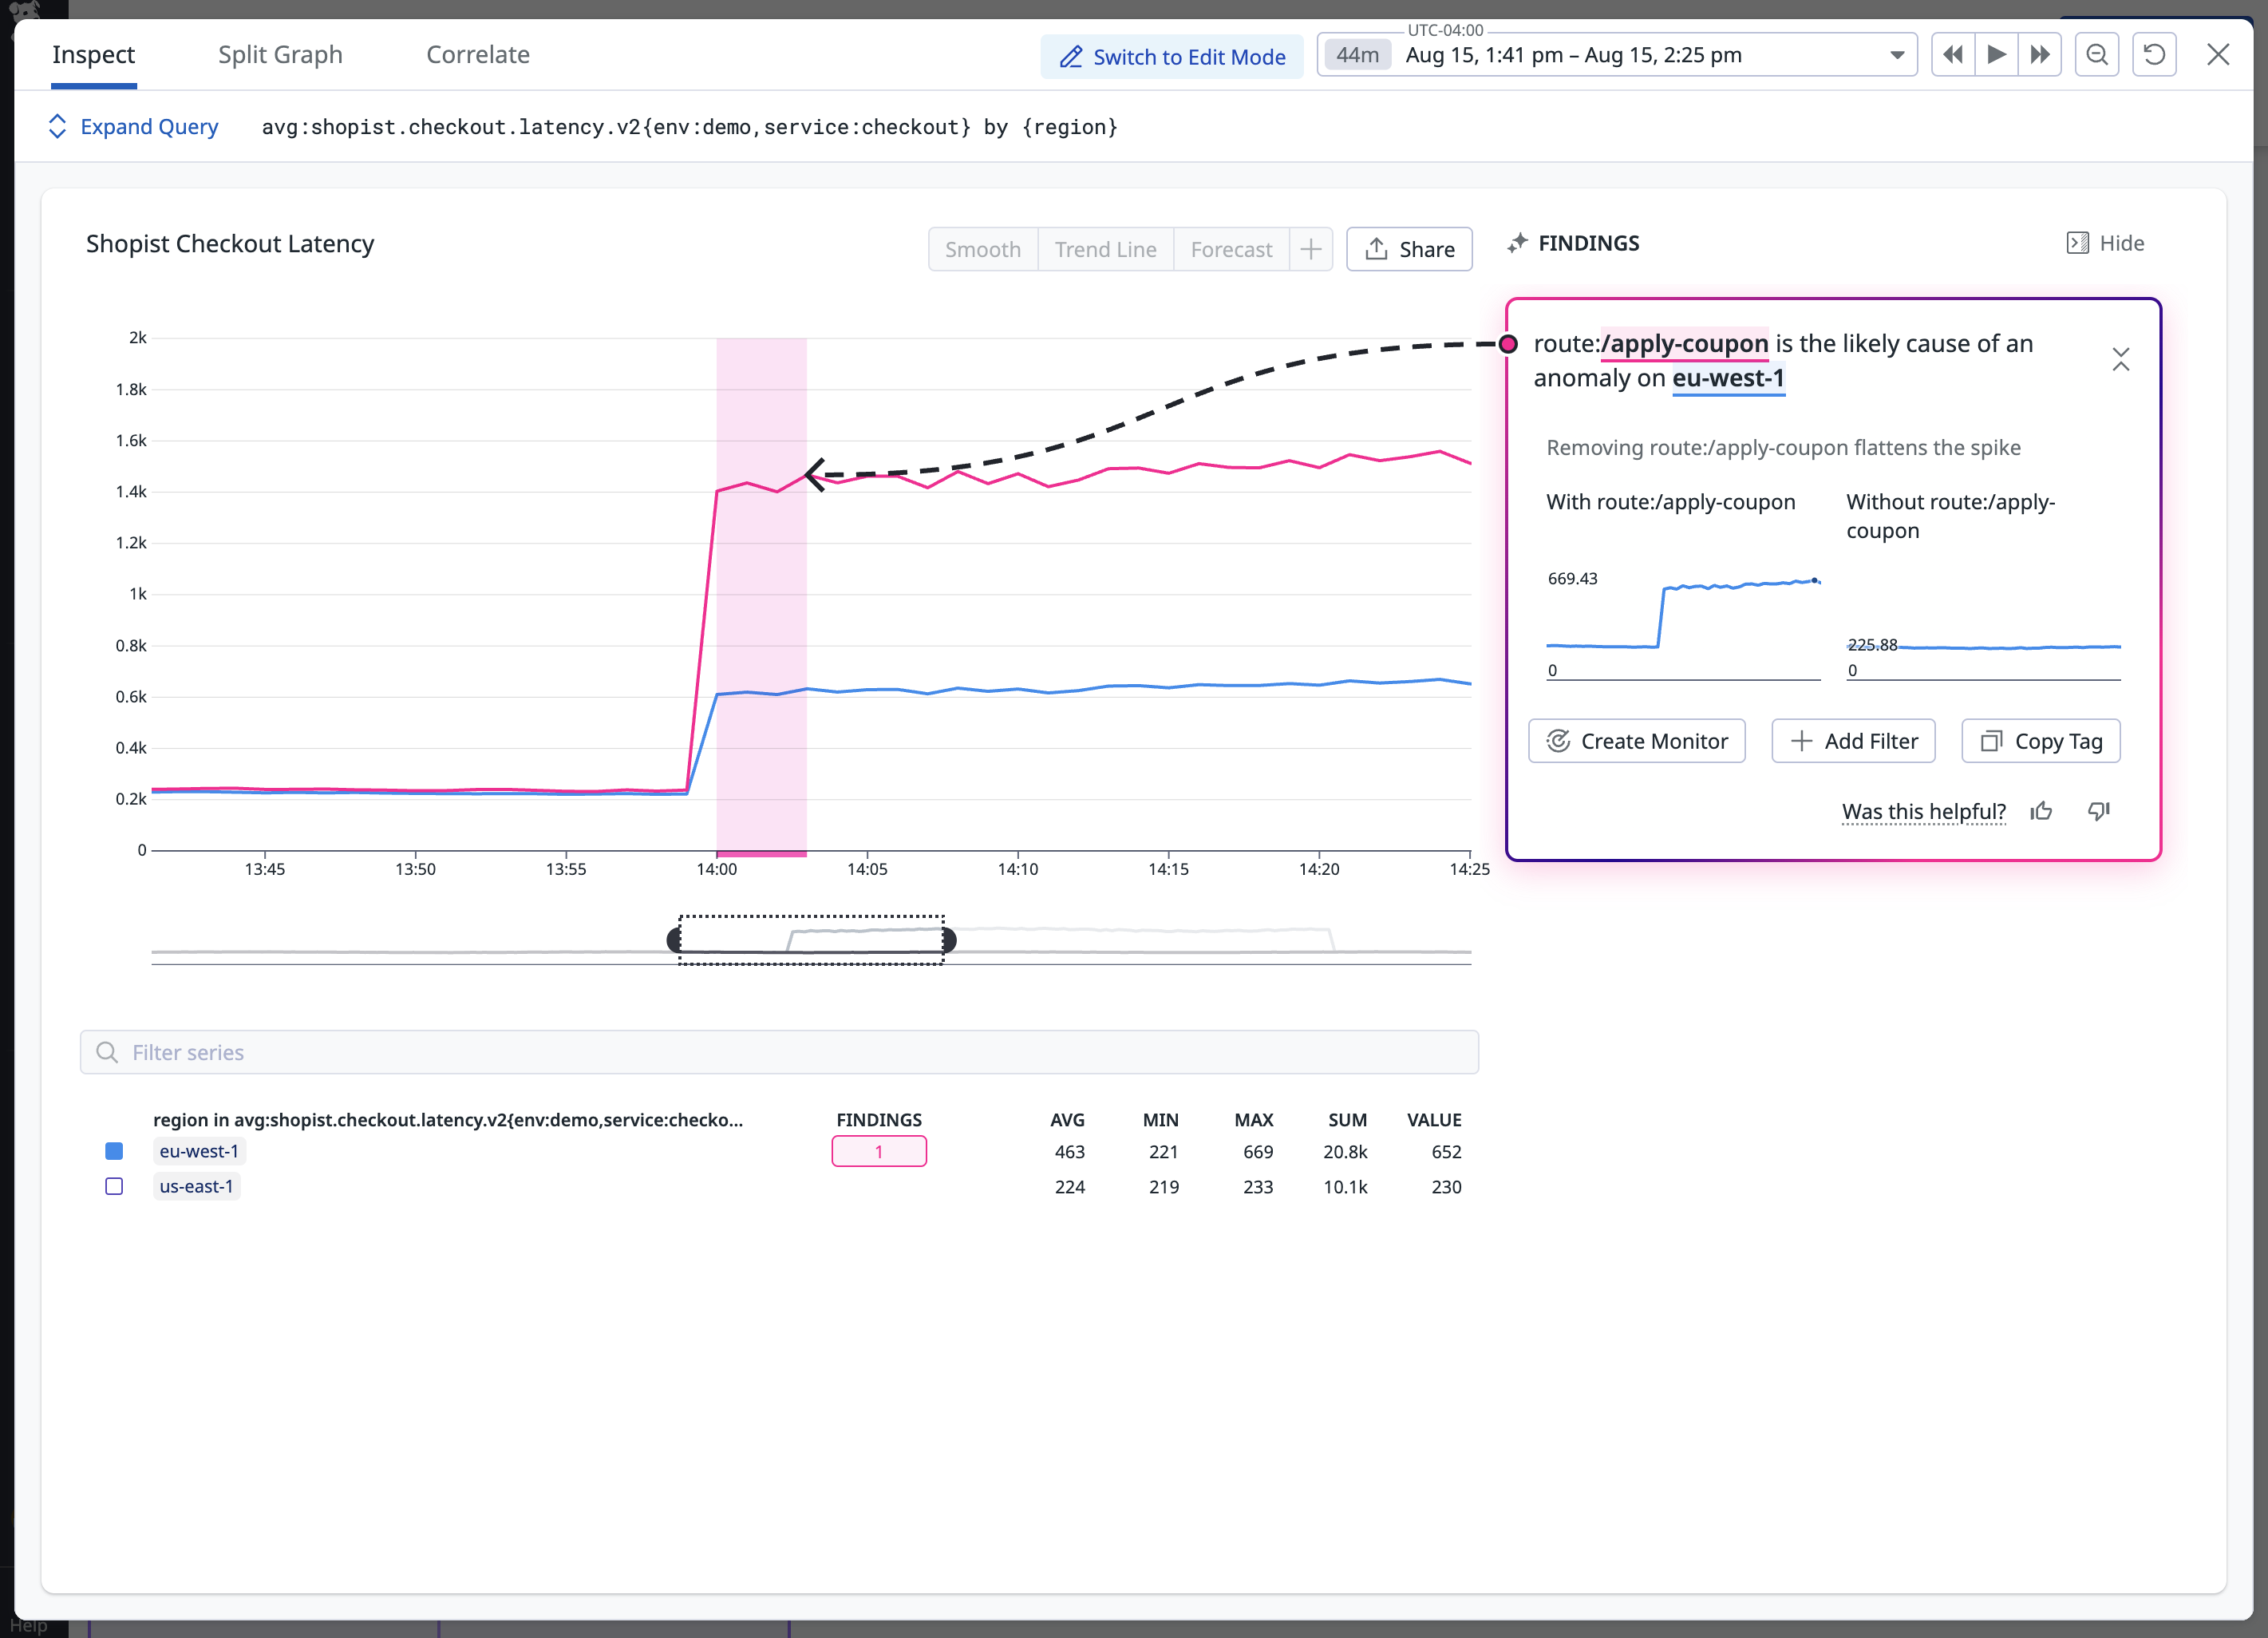
Vous pouvez commencer votre investigation à partir de n’importe quel graphique de séries temporelles qui utilise des données de métrique. Lorsque Watchdog Explains détecte une anomalie, il met en évidence la région affectée avec une zone rose. Pour commencer l’investigation, cliquez sur Investigate Anomaly.
Cela ouvre une vue d’investigation en plein écran. Watchdog analyse l’anomalie et met en évidence tous les groupes de tags qui ont contribué de manière significative à la forme ou à l’échelle de l’anomalie. Cliquez sur un tag pour voir comment la suppression ou l’isolation de cette dimension affecte le graphique. Utilisez cela pour identifier les causes racines comme des clients, services ou environnements spécifiques.
Désactivation de la détection d’anomalie
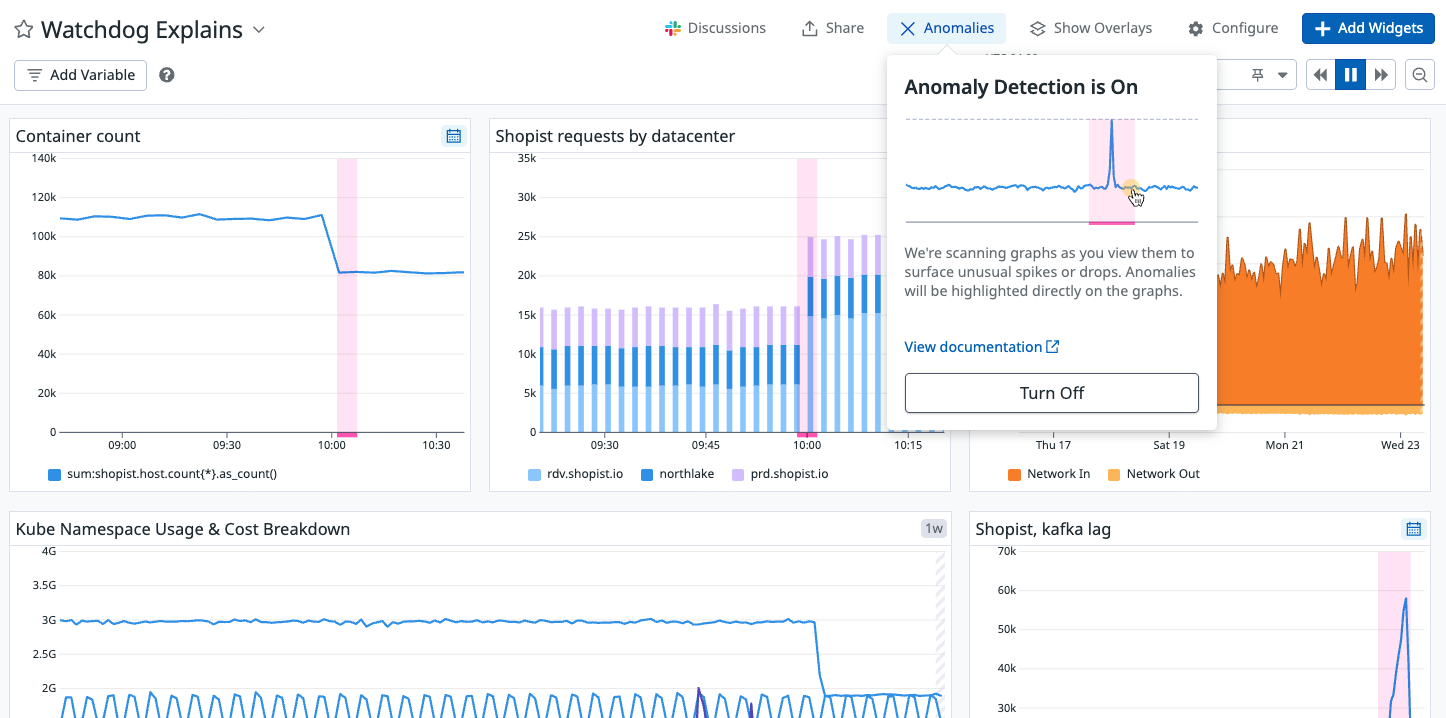
Vous pouvez désactiver l'analyse des anomalies sur n'importe quel dashboard. Cela n'affecte que votre vue, les autres utilisateurs du dashboard voient toujours les anomalies sauf s'ils la désactivent.
Pour désactiver la détection d’anomalies sur un dashboard, ouvrez Anomalies en haut du dashboard et cliquez sur Turn Off.
Pour aller plus loin
Documentation, liens et articles supplémentaires utiles:


