- Principales informations
- Getting Started
- Agent
- API
- Tracing
- Conteneurs
- Dashboards
- Database Monitoring
- Datadog
- Site Datadog
- DevSecOps
- Incident Management
- Intégrations
- Internal Developer Portal
- Logs
- Monitors
- OpenTelemetry
- Profileur
- Session Replay
- Security
- Serverless for AWS Lambda
- Software Delivery
- Surveillance Synthetic
- Tags
- Workflow Automation
- Learning Center
- Support
- Glossary
- Standard Attributes
- Guides
- Agent
- Intégrations
- Développeurs
- OpenTelemetry
- Administrator's Guide
- API
- Partners
- Application mobile
- DDSQL Reference
- CoScreen
- CoTerm
- Remote Configuration
- Cloudcraft
- In The App
- Dashboards
- Notebooks
- DDSQL Editor
- Reference Tables
- Sheets
- Alertes
- Watchdog
- Métriques
- Bits AI
- Internal Developer Portal
- Error Tracking
- Change Tracking
- Service Management
- Actions & Remediations
- Infrastructure
- Cloudcraft
- Resource Catalog
- Universal Service Monitoring
- Hosts
- Conteneurs
- Processes
- Sans serveur
- Surveillance réseau
- Cloud Cost
- Application Performance
- APM
- Termes et concepts de l'APM
- Sending Traces to Datadog
- APM Metrics Collection
- Trace Pipeline Configuration
- Connect Traces with Other Telemetry
- Trace Explorer
- Recommendations
- Code Origin for Spans
- Observabilité des services
- Endpoint Observability
- Dynamic Instrumentation
- Live Debugger
- Suivi des erreurs
- Sécurité des données
- Guides
- Dépannage
- Profileur en continu
- Database Monitoring
- Agent Integration Overhead
- Setup Architectures
- Configuration de Postgres
- Configuration de MySQL
- Configuration de SQL Server
- Setting Up Oracle
- Setting Up Amazon DocumentDB
- Setting Up MongoDB
- Connecting DBM and Traces
- Données collectées
- Exploring Database Hosts
- Explorer les métriques de requête
- Explorer des échantillons de requêtes
- Exploring Database Schemas
- Exploring Recommendations
- Dépannage
- Guides
- Data Streams Monitoring
- Data Jobs Monitoring
- Data Observability
- Digital Experience
- RUM et Session Replay
- Surveillance Synthetic
- Continuous Testing
- Product Analytics
- Software Delivery
- CI Visibility
- CD Visibility
- Deployment Gates
- Test Visibility
- Code Coverage
- Quality Gates
- DORA Metrics
- Feature Flags
- Securité
- Security Overview
- Cloud SIEM
- Code Security
- Cloud Security Management
- Application Security Management
- Workload Protection
- Sensitive Data Scanner
- AI Observability
- Log Management
- Pipelines d'observabilité
- Log Management
- CloudPrem
- Administration
Créer votre premier diagramme cloud Live
Cloudcraft vous permet d’importer vos environnements cloud AWS et Azure sous forme de diagrammes Live. Cloudcraft effectue une rétro-ingénierie de l’architecture de votre compte cloud afin de générer automatiquement de nouveaux diagrammes ou d’améliorer les existants, ce qui vous fait gagner des heures, voire même des jours, de travail.
Si vous utilisez la nouvelle expérience Live de Cloudcraft, consultez plutôt la section Créer de meilleurs diagrammes : diagrammes Live et filtrage dans Cloudcraft.
Prérequis
Avant de commencer, connectez votre compte cloud à Cloudcraft.
- Pour les comptes AWS, consultez la section Connecter votre compte AWS à Cloudcraft.
- Pour les comptes Azure, consultez la section Connecter votre compte Azure à Cloudcraft.
Votre premier diagramme Live
Pour analyser et visualiser votre architecture cloud, créez un nouveau blueprint. Un blueprint contient votre diagramme, un budget, ainsi que toute la documentation que vous associez aux composants individuels.
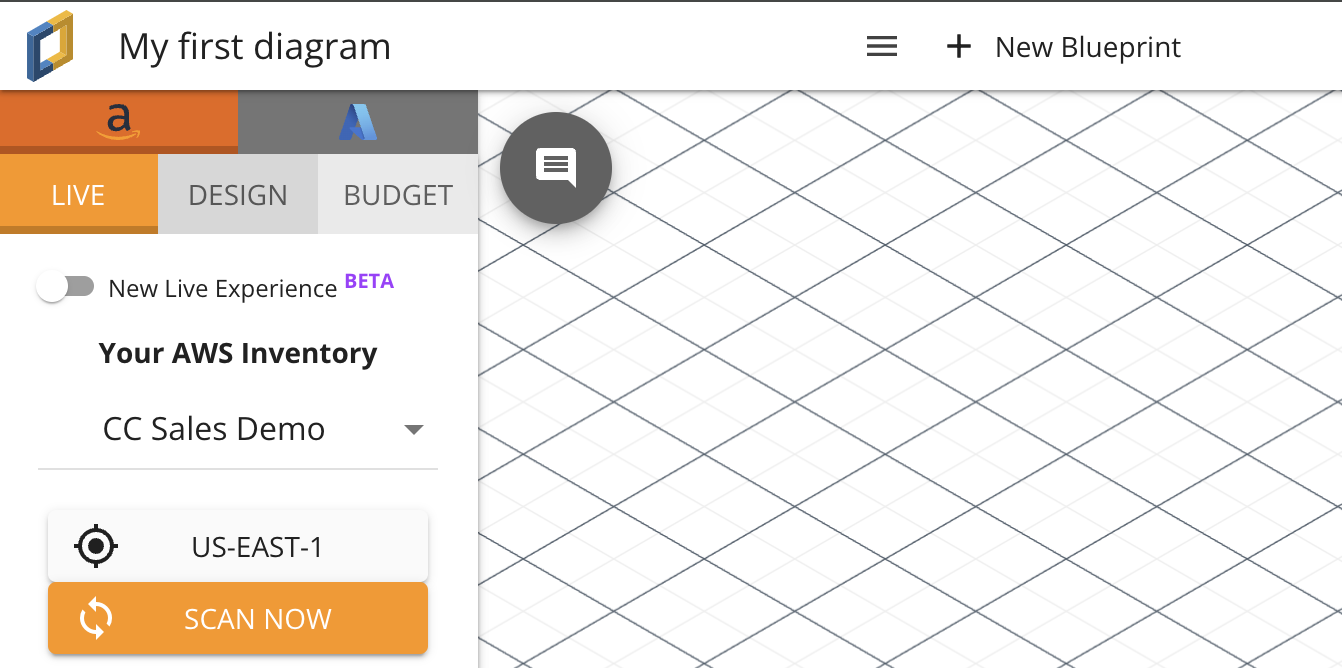
- Dans Cloudcraft, sélectionnez l’onglet AWS ou Azure, puis l’onglet Live. Ce guide se focalise avant tout sur les comptes AWS. Si vous disposez d’un compte Azure, le processus est similaire.
Depuis l’onglet Live, vous pouvez sélectionner votre compte, analyser des régions, générer des dispositions et visualiser toutes les ressources de votre compte.
Si vous n’avez ajouté qu’un seul compte AWS à Cloudcraft, il est automatiquement sélectionné. Sinon, choisissez un compte dans la liste déroulante.
- Sélectionnez la région dans laquelle vous souhaitez effectuer l’analyse. Bien qu’il soit possible d’analyser et d’intégrer plusieurs régions au sein d’un seul diagramme, il est recommandé de commencer par une seule région.
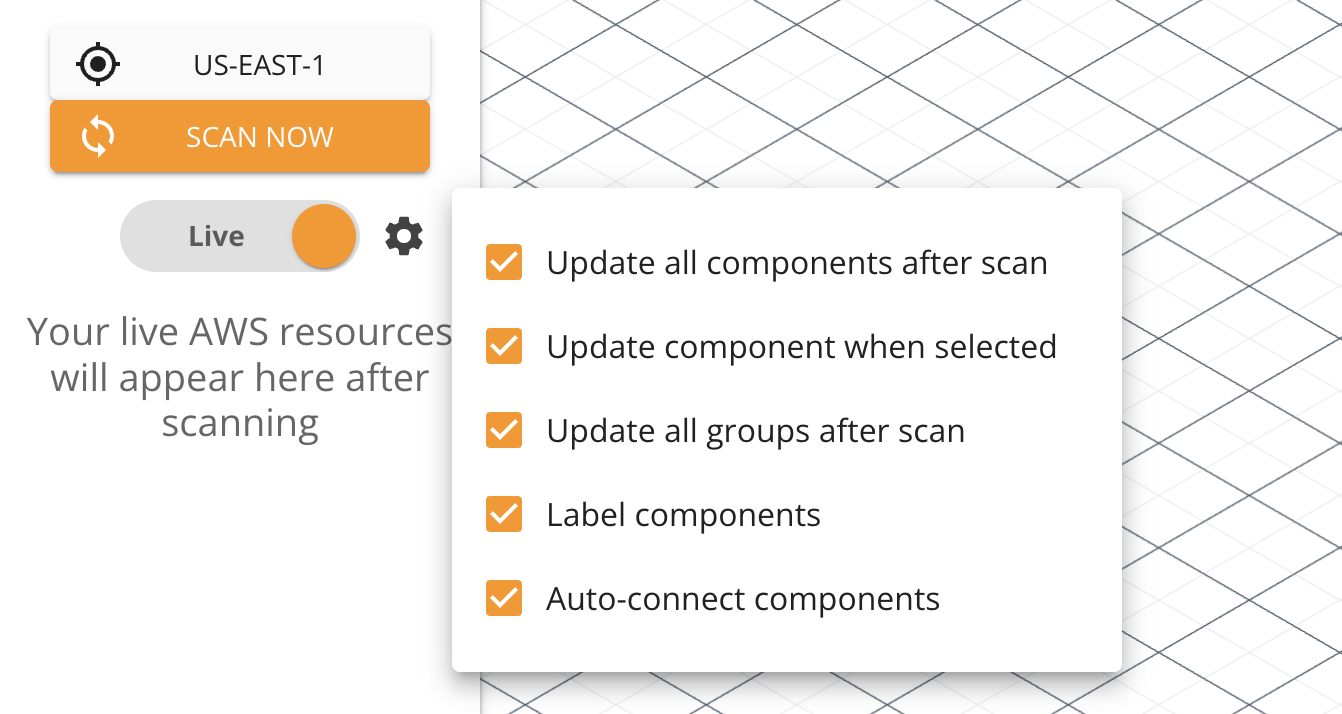
Sous le bouton Scan now se trouve un interrupteur permettant de basculer entre les options Live ou Snapshot. Cela indique à l’application le type de diagramme que vous souhaitez créer. Si vous sélectionnez Live, le diagramme est constamment mis à jour en fonction des informations de votre compte. Si vous sélectionnez Snapshot, une image fixe est créée : il n’y a alors pas de mise à jour automatique du diagramme.
Pour cet exemple, vous allez utiliser l’option Live. Veillez à ce que l’interrupteur indique Live. L’icône en forme d’engrenage située à droite de l’option fournit des paramètres de personnalisation supplémentaires pour la mise à jour de votre diagramme. Pour les besoins de ce guide, il est recommandé de ne pas modifier les paramètres.
- Cliquez sur Scan now pour analyser les composants AWS pris en charge de votre compte. Le message Scan complete s’affiche à la fin de l’analyse.
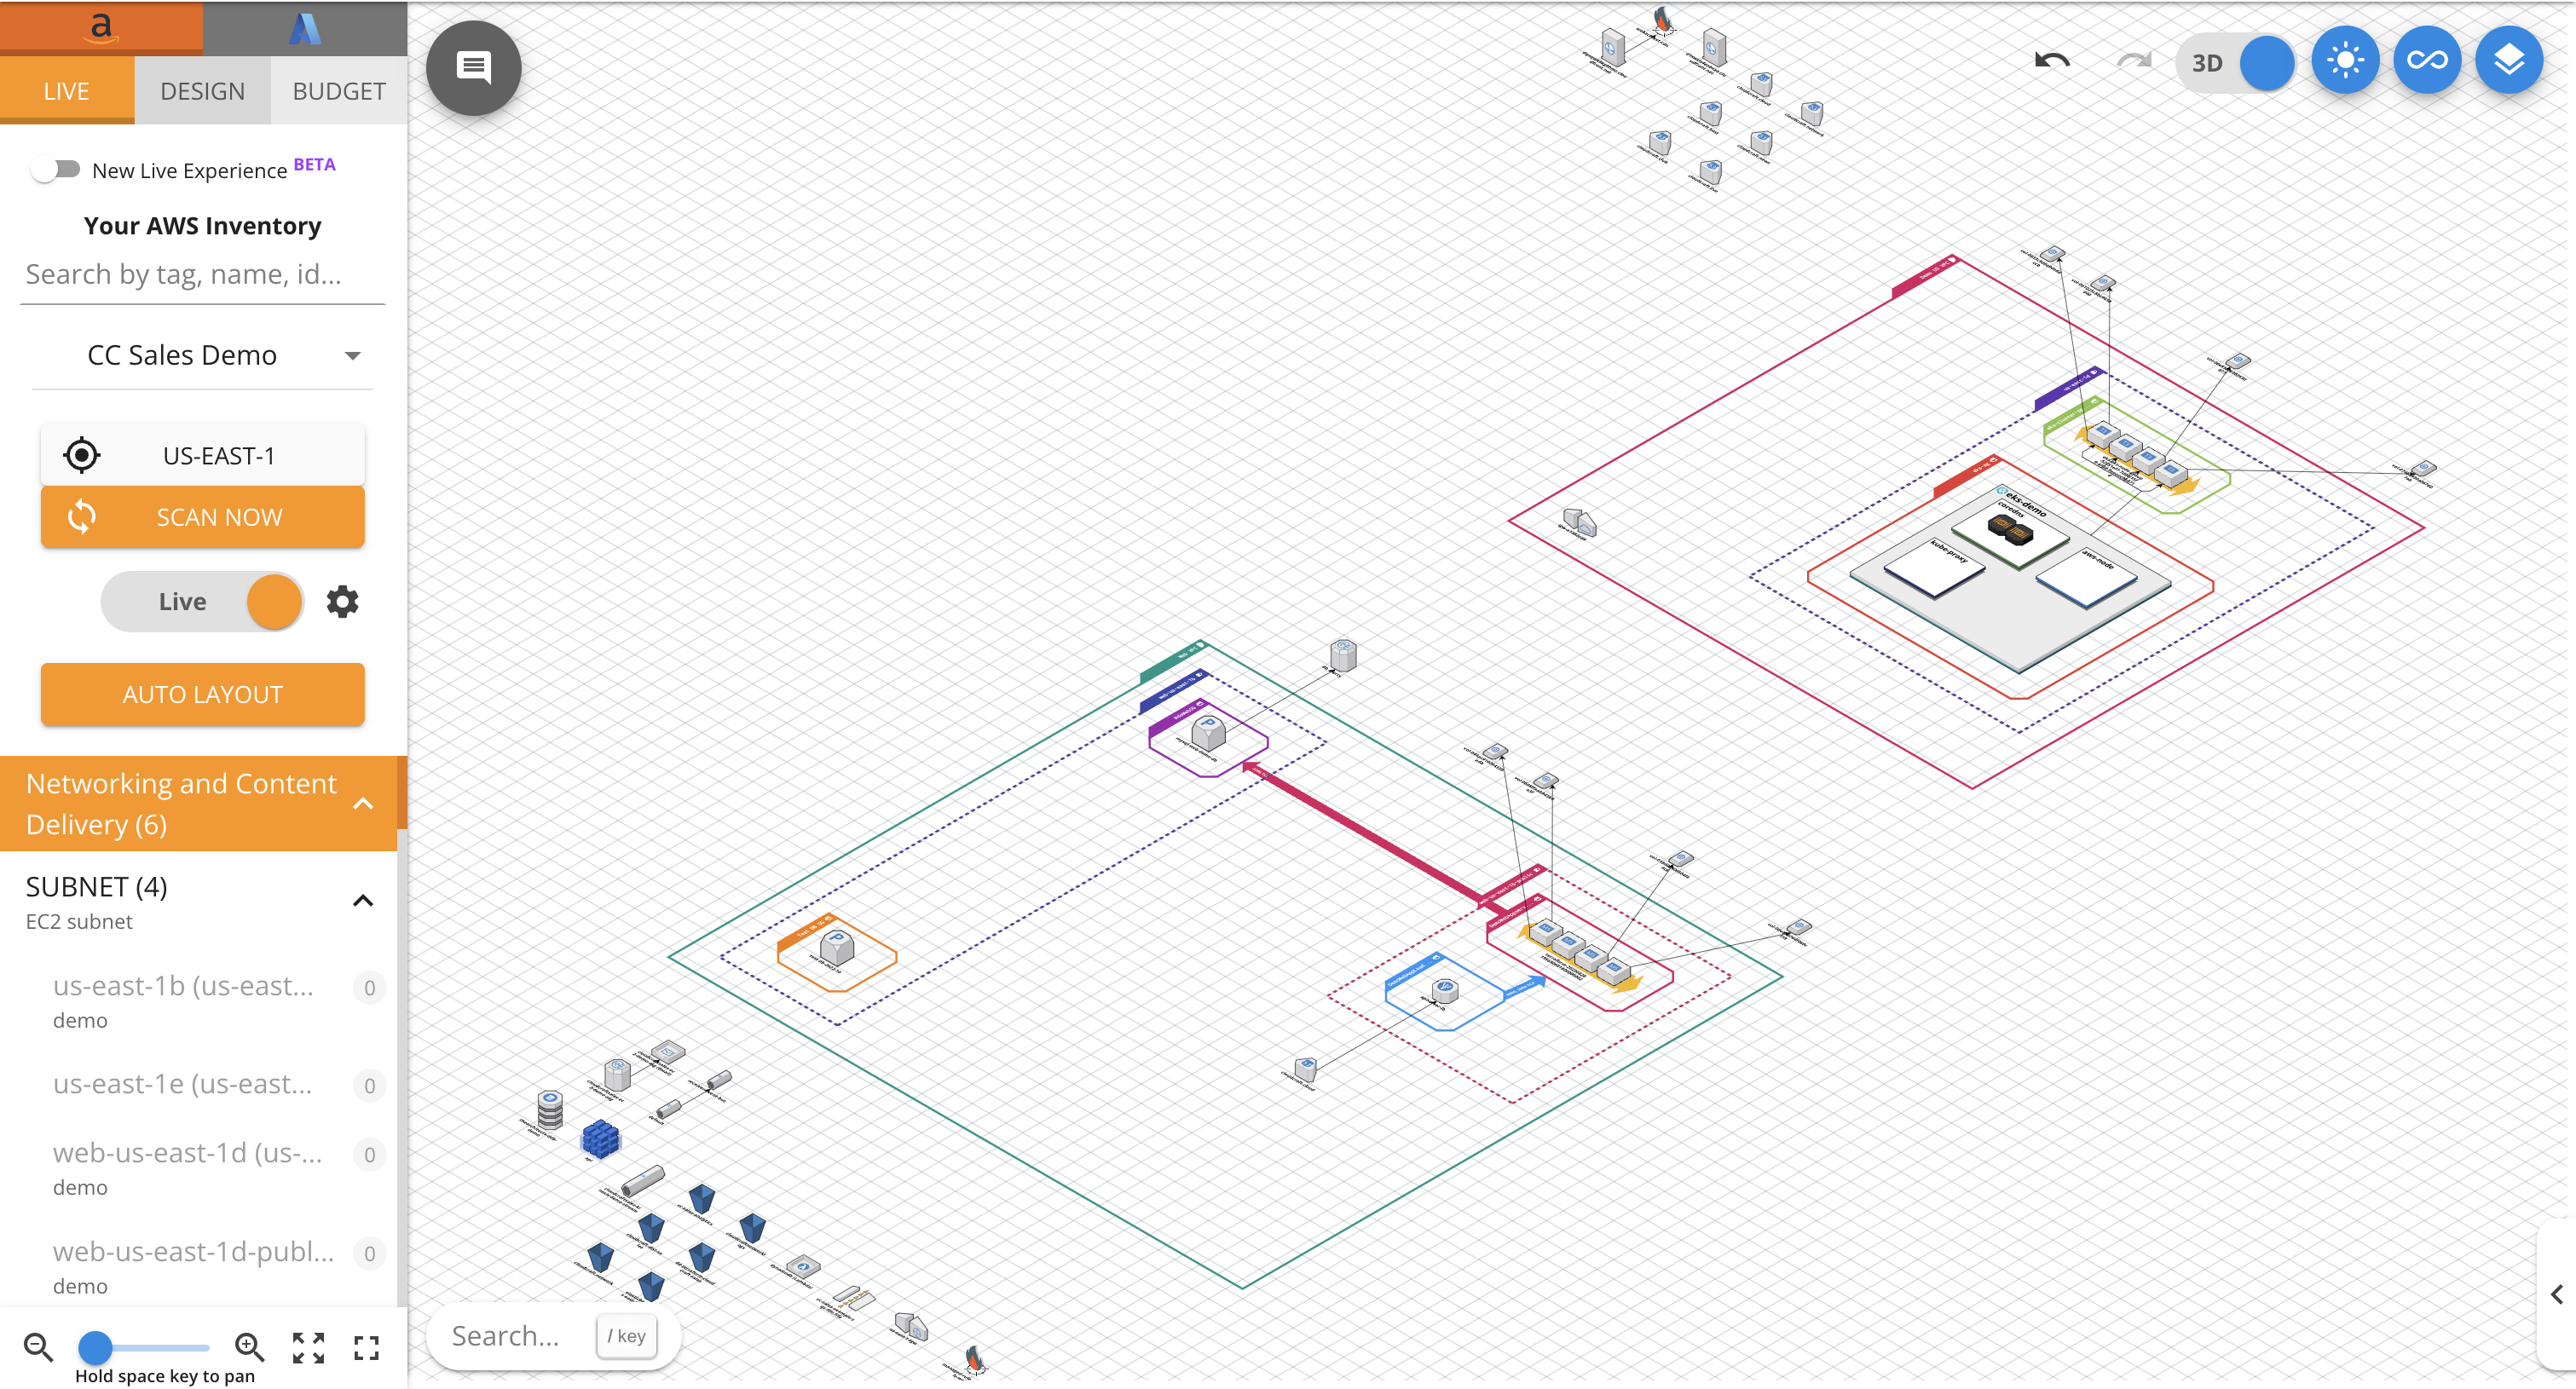
Une fois l’analyse terminée, l’interface affiche le bouton Auto Layout ainsi que tous les composants pris en charge de votre compte AWS. Vous pouvez dès à présent commencer à les ajouter manuellement. Toutefois, il est recommandé de laisser l’application gérer automatiquement leur disposition.
Il existe deux façons de gérer automatiquement la disposition :
- Avec la fonctionnalité Auto Layout
- Avec la fonctionnalité Filtered Layout
La fonctionnalité Auto Layout est la plus simple à utiliser, car elle ajoute tous les composants au diagramme et représente leurs connexions et leurs relations. Par exemple, vous pouvez faire en sorte que la fonctionnalité Auto Layout affiche uniquement les instances EC2 et exclue tous les autres composants.
Puisque vous utilisez un diagramme de type Live, si vous supprimez une instance EC2 de votre compte AWS, le changement est appliqué dans votre diagramme.
La fonctionnalité Filtered Layout fournit une solution plus avancée et plus efficace pour schématiser votre architecture cloud, car elle vous permet de créer des diagrammes qui suivent un pattern. Par exemple, si vous avez de nombreuses ressources avec les tags environment=production et environment=staging, mais que vous souhaitez uniquement ajouter les composants en production au diagramme, vous pouvez appliquer un filtre basé sur environment=production afin d’inclure uniquement les composants qui possèdent cette combinaison précise de valeur et de clé.
Si vos ressources ne sont pas taguées par votre fournisseur cloud, vous pouvez tout de même vous servir des filtres. Par exemple, pour créer un diagramme qui représente seulement les instances EC2 qui ne sont pas en cours d’exécution, vous pouvez utiliser le filtre ec2 !running.
La vidéo suivante illustre à quel point la fonctionnalité Filtered Layout est utile. Notre équipe commerciale tague dans AWS plusieurs ressources liées à une démonstration de Cloudcraft avec la clé Environment et la valeur Demo. Pour visualiser le contenu de la démonstration ainsi que la relation entre chaque composant, l’équipe peut utiliser le filtre Environment=demo dans la barre de recherche juste en dessous de l’onglet Live.
Les composants avec Environment=demo sont affichés dans leurs VPC, sous-réseaux et groupes de sécurité correspondants, alors même que ces ressources ne possèdent pas de tels tags dans AWS. Bien qu’il possède les mêmes tags, le composant WAF est placé en dehors du VPC, car l’API AWS n’indique aucun lien entre WAF et le reste des composants.
Les interconnexions entre les composants dépendent des services. Cloudcraft utilise toutes les API cloud disponibles pour découvrir les relations dans la mesure du possible.
- Pour continuer à configurer la fonctionnalité Auto Layout, sélectionnez Auto Layout sous l’interrupteur Live/Snapshot.
Vous pouvez choisir dans la nouvelle boîte de dialogue qui s’affiche les composants AWS à inclure dans votre diagramme. La boîte de dialogue comprend également un menu déroulant Options vous permettant de choisir parmi les trois options suivantes :
- Replace existing components
- Include existing components
- Leave existing components
Ces options indiquent à l’application le comportement à adopter lorsque vous utilisez la fonctionnalité Auto Layout sur un diagramme comprenant déjà des composants.
- Si vous sélectionnez l’option Replace existing components, tout le contenu existant du diagramme est remplacé par les nouveaux composants.
- Si vous sélectionnez l’option Include existing components, l’application crée automatiquement une disposition à partir de tous les composants de votre inventaire ainsi que des composants existants du diagramme.
- Si vous sélectionnez l’option Leave existing components, les composants du diagramme ne sont pas modifiés, mais l’application crée automatiquement une disposition pour les nouveaux composants.
Puisque vous créez un nouveau diagramme, choisissez l’option Replace existing components dans le menu. Sélectionnez Layout pour ajouter automatiquement tous les composants de votre inventaire, ainsi que leurs connexions, au diagramme.
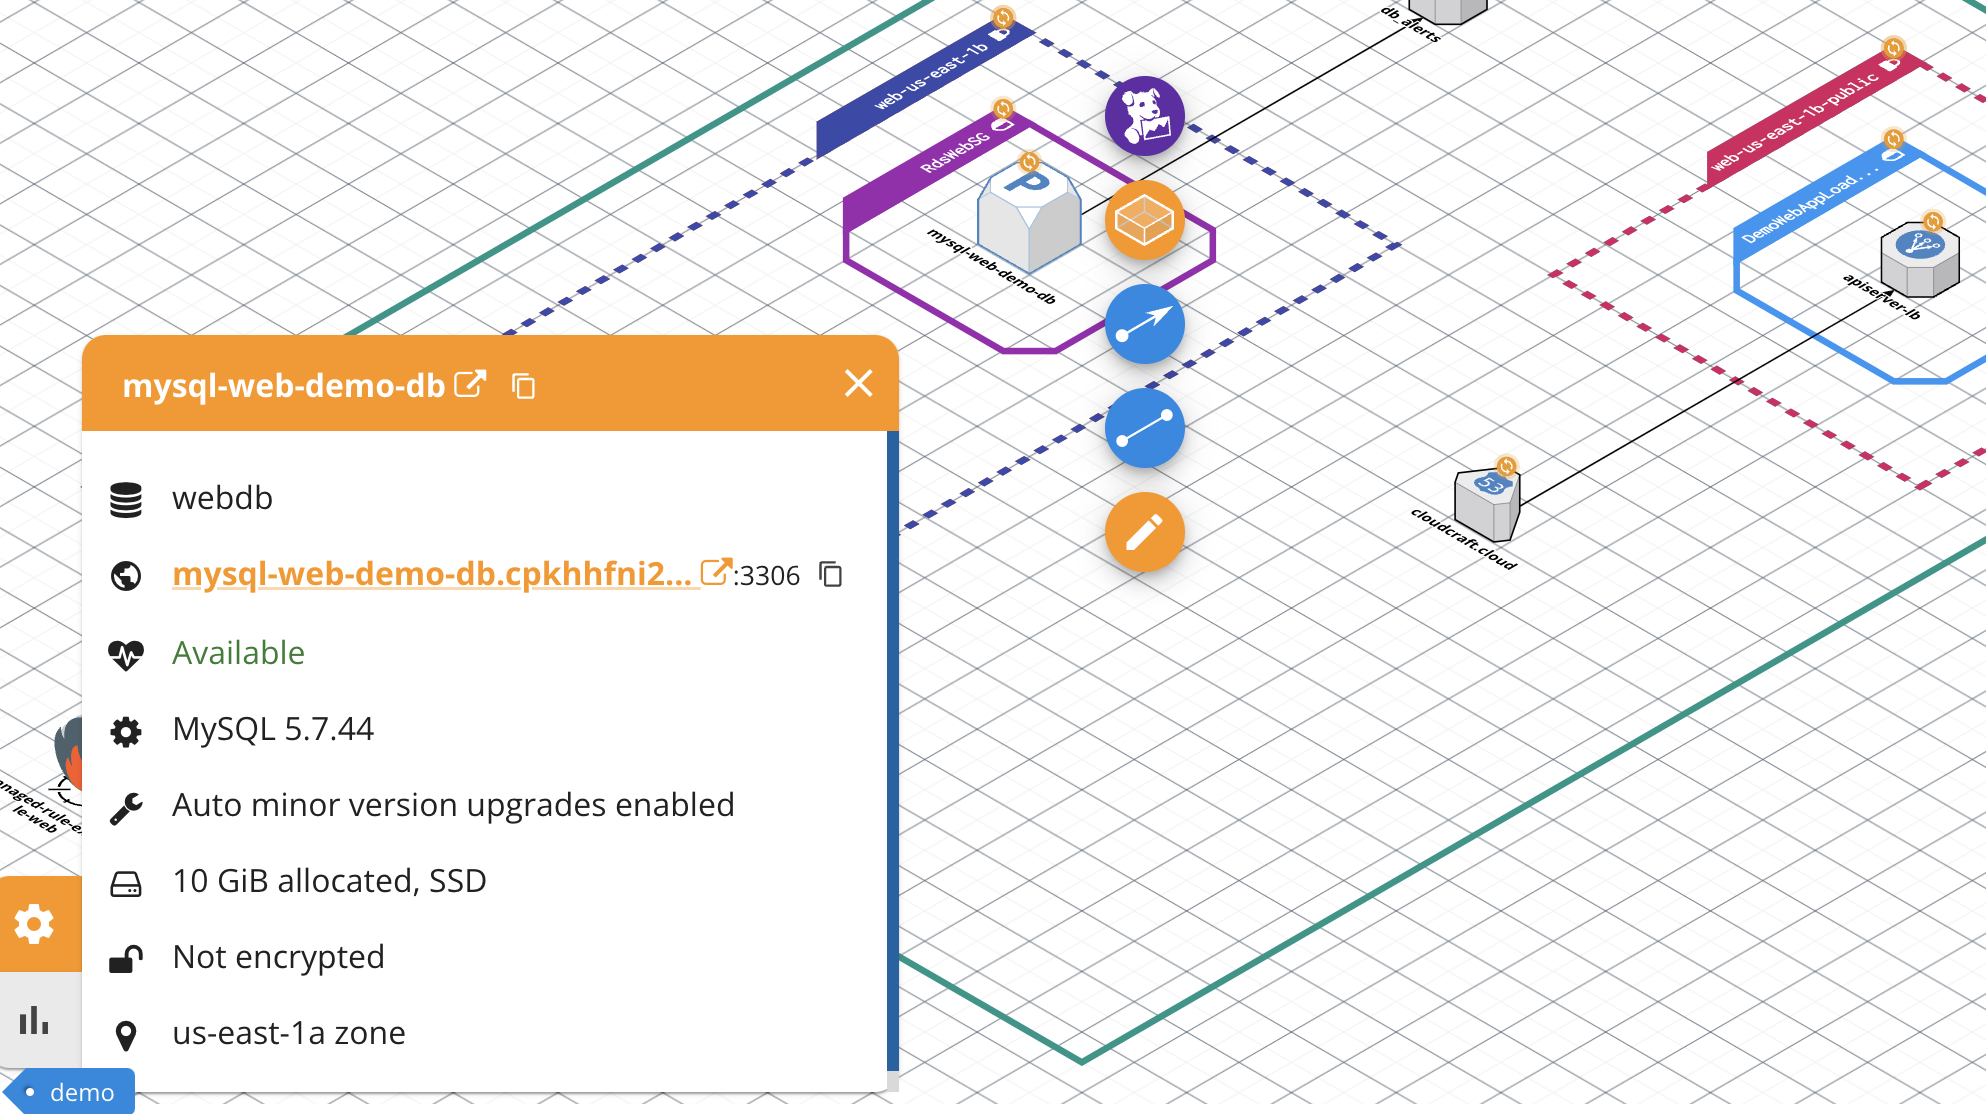
Le diagramme est personnalisable. Par exemple, vous pouvez améliorer le rendu en utilisant des éléments de l’onglet Design, tout en observant les données en temps réel de chaque composant.
Si vous sélectionnez un composant, la boîte de dialogue Live feed apparaît dans le coin inférieur gauche de votre écran. Elle affiche des informations en direct sur le composant que vous avez sélectionné.
Nouvelle expérience Live
La nouvelle expérience Live améliorée qui est proposée par Cloudcraft fait partie d’une démarche continue d’amélioration de l’expérience utilisateur et de rationalisation du processus de schématisation des infrastructures cloud. Tous les utilisateurs peuvent bénéficier de cette fonctionnalité. Elle est proposée par défaut aux nouveaux utilisateurs.
Pour en savoir plus, consultez la section Créer de meilleurs diagrammes : diagrammes Live et filtrage dans Cloudcraft.


