Esta página aún no está disponible en español. Estamos trabajando en su traducción. Si tienes alguna pregunta o comentario sobre nuestro actual proyecto de traducción, no dudes en ponerte en contacto con nosotros.
Overview
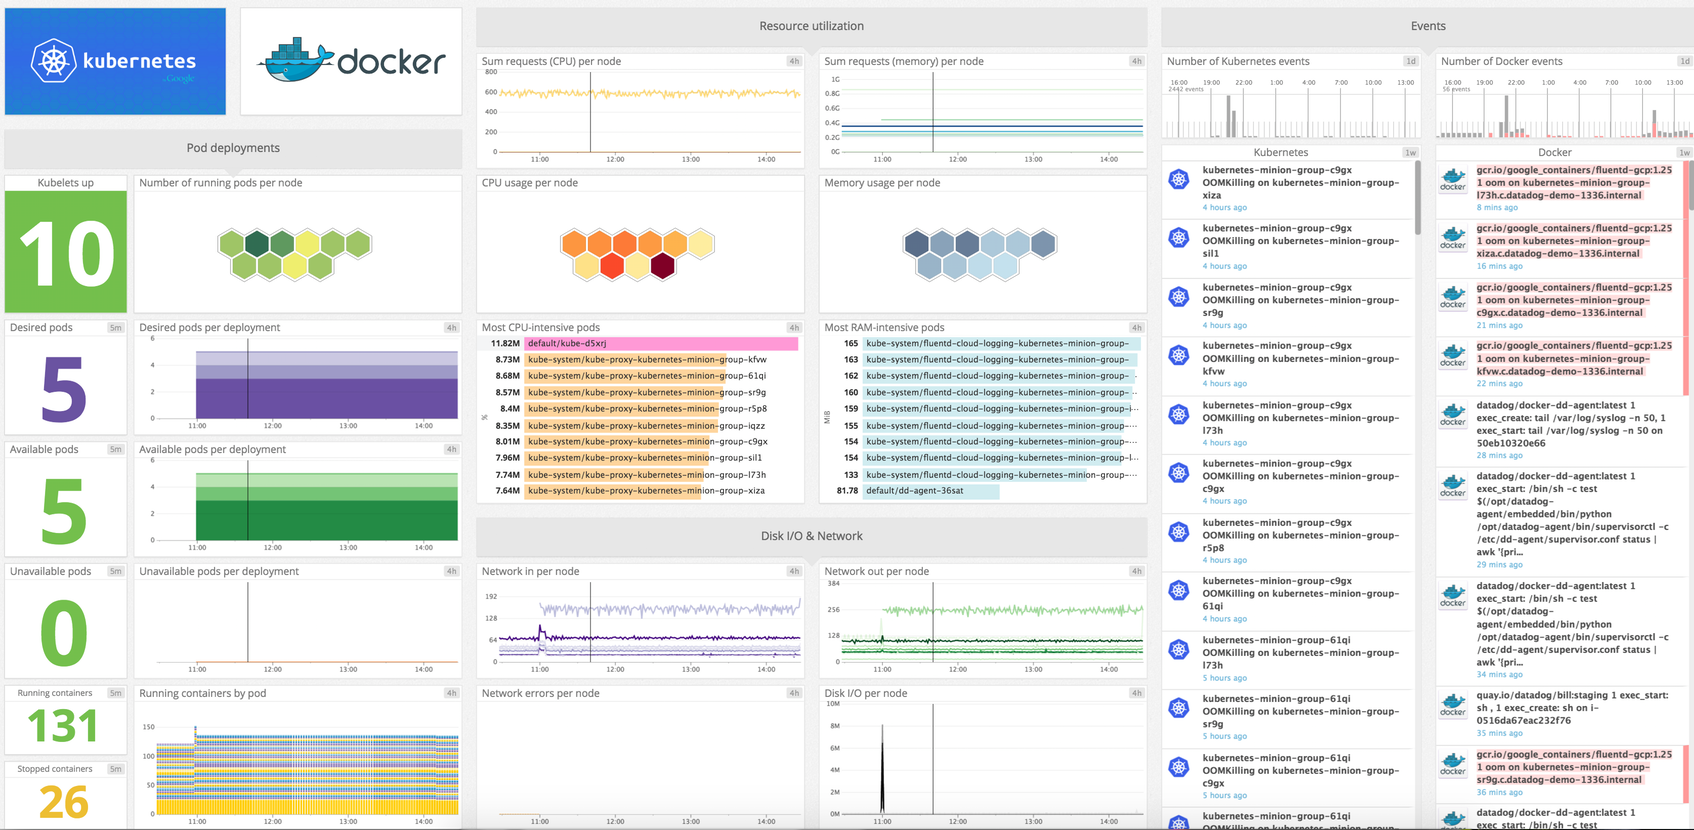
Get metrics from the Kubernetes service in real time to:
Visualize and monitor Kubernetes states
Be notified about Kubernetes failovers and events.
Note: This check only works with Agent v5. For Agent v6+, see the kubelet check.
Minimum Agent version: 6.0.0
Setup
Installation
The Kubernetes check is included in the Datadog Agent package, so you don’t need to install anything else on your Kubernetes servers.
For more information on installing the Datadog Agent on your Kubernetes clusters, see the Kubernetes documentation.
The amount of disk space the container uses. Shown as byte
kubernetes.filesystem.usage (gauge)
The amount of disk used. Requires Docker container runtime. Shown as byte
kubernetes.filesystem.usage_pct (gauge)
The percentage of disk used. Requires Docker container runtime. Shown as fraction
kubernetes.memory.capacity (gauge)
The amount of memory (in bytes) in this machine Shown as byte
kubernetes.memory.limits (gauge)
The limit of memory set Shown as byte
kubernetes.memory.requests (gauge)
The requested memory Shown as byte
kubernetes.memory.usage (gauge)
The amount of memory used Shown as byte
kubernetes.network.rx_bytes (gauge)
The amount of bytes per second received Shown as byte
kubernetes.network.tx_bytes (gauge)
The amount of bytes per second transmitted Shown as byte
kubernetes.network_errors (gauge)
The amount of network errors per second Shown as error
Events
As of the v5.17.0 release, the Datadog Agent supports a built-in leader election option for the Kubernetes event collector. Once enabled, you no longer need to deploy an additional event collection container to your cluster. Instead, Agents coordinate to ensure only one Agent instance is gathering events at a given time, events below are available:
Backoff
Conflict
Delete
DeletingAllPods
Didn’t have enough resource
Error
Failed
FailedCreate
FailedDelete
FailedMount
FailedSync
Failedvalidation
FreeDiskSpaceFailed
HostPortConflict
InsufficientFreeCPU
InsufficientFreeMemory
InvalidDiskCapacity
Killing
KubeletsetupFailed
NodeNotReady
NodeoutofDisk
OutofDisk
Rebooted
TerminatedAllPods
Unable
Unhealthy
Service Checks
kubernetes_state.node.ready
Returns CRITICAL if a cluster node is not ready. Returns WARNING if status is unknown. Returns OK otherwise.
Statuses: ok, warning, critical
kubernetes_state.node.out_of_disk
Returns CRITICAL if a cluster node is out of disk space. Returns UNKNOWN if status is unknown. Returns OK otherwise.
Statuses: ok, unknown, critical
kubernetes_state.node.disk_pressure
Returns CRITICAL if a cluster node is in a disk pressure state. Returns UNKNOWN if status is unknown. Returns OK otherwise.
Statuses: ok, unknown, critical
kubernetes_state.node.memory_pressure
Returns CRITICAL if a cluster node is in a memory pressure state. Returns UNKNOWN if status is unknown. Returns OK otherwise.
Statuses: ok, unknown, critical
kubernetes_state.node.network_unavailable
Returns CRITICAL if a cluster node is in a network unavailable state. Returns UNKNOWN if status is unknown. Returns OK otherwise.
Statuses: ok, unknown, critical
kubernetes_state.cronjob.on_schedule_check
Returns CRITICAL if a cron job scheduled time is unknown or in the past. Returns OK otherwise.
Statuses: ok, critical
kubernetes_state.job.complete
Returns CRITICAL if a job failed. Returns OK otherwise.
Statuses: ok, critical
kubernetes_state.cronjob.complete
Returns CRITICAL if the last job of a cronjob failed. Returns OK otherwise.
Statuses: ok, critical
Troubleshooting
Agent installation on Kubernetes master nodes
Since Kubernetes v1.6, the concept of Taints and tolerations was introduced. The master node is no longer off limits, it’s simply tainted. Add the required toleration to the pod to run it.
Add the following lines to your Deployment (or Daemonset if you are running a multi-master setup):
Why is the Kubernetes check failing with a ConnectTimeout error to port 10250?
The Agent assumes the kubelet API is available at the default gateway of the container. If that’s not the case because you are using a software defined networks like Calico or Flannel, the Agent needs to be specified using an environment variable:
Why is there a container in each Kubernetes pod with 0% CPU and minimal disk/ram?
These are pause containers (docker_image:gcr.io/google_containers/pause.*) that K8s injects into every pod to keep it populated even if the “real” container is restarting or stopped.
The docker_daemon check ignores them through a default exclusion list, but they do show up for K8s metrics like kubernetes.cpu.usage.total and kubernetes.filesystem.usage.