.NET utiliza la instrumentación automática para inyectar y extraer los metadatos adicionales que necesita Data Streams Monitoring para medir las latencias de extremo a extremo y la relación entre colas y servicios.
A partir de la versión 3.22.0 del rastreador .NET, Data Streams Monitoring se encuentra en un estado activado por defecto. Las aplicaciones con el rastreador de APM envían automáticamente telemetría de DSM, lo que permite a los equipos probar DSM sin sumar un paso de instrumentación. Si tu organización dispone de APM Enterprise, APM Pro o DSM en el contrato, los datos se procesan y almacenan, permitiendo vistas y métricas de DSM automáticamente.
Cuando DD_DATA_STREAMS_ENABLED no está configurado, entonces:
El seguimiento de esquemas está desactivado.
Data Streams no está habilitado cuando se ejecuta en un entorno sin servidor.
La información de Data Streams no se propaga para ciertos mensajes que son demasiado pequeños o demasiado grandes. Consulta Tamaños de mensajes para obtener más detalles.
No se hace un seguimiento del tamaño de los mensajes.
Cuando DD_DATA_STREAMS_ENABLED se establece en true, entonces:
El seguimiento de esquemas está activado.
Data Streams está habilitado para entornos sin servidor.
La información sobre Data Streams se envía para todos los mensajes.
Se hace un seguimiento del tamaño de los mensajes.
Si DD_DATA_STREAMS_ENABLED está configurado como false, todas las funciones de Data Streams Manager están desactivadas.
Si tienes alguna pregunta sobre el comportamiento activado por defecto, ponte en contacto con tu asesor de clientes.
Para habilitar Data Streams Monitoring, establece la variable de entorno DD_DATA_STREAMS_ENABLED en true en los servicios que envían mensajes a (o consumen mensajes de) tus aplicaciones de streaming.
Data Streams Monitoring uses message headers to propagate context through Kafka streams. If log.message.format.version is set in the Kafka broker configuration, it must be set to 0.11.0.0 or higher. Data Streams Monitoring is not supported for versions lower than this.
Monitoring SQS pipelines
Data Streams Monitoring uses one message attribute to track a message’s path through an SQS queue. As Amazon SQS has a maximum limit of 10 message attributes allowed per message, all messages streamed through the data pipelines must have 9 or fewer message attributes set, allowing the remaining attribute for Data Streams Monitoring.
Monitoring RabbitMQ pipelines
The RabbitMQ integration can provide detailed monitoring and metrics of your RabbitMQ deployments. For full compatibility with Data Streams Monitoring, Datadog recommends configuring the integration as follows:
Setting up Data Streams Monitoring for Azure Service Bus applications requires additional configuration for the instrumented application.
Either set the environment variable AZURE_EXPERIMENTAL_ENABLE_ACTIVITY_SOURCE to true, or in your application code set the Azure.Experimental.EnableActivitySource context switch to true. This instructs the Azure Service Bus library to generate tracing information. See Azure SDK documentation for more details.
Set the DD_TRACE_OTEL_ENABLED environment variable to true. This instructs the .NET auto-instrumentation to listen to the tracing information generated by the Azure Service Bus Library and enables the inject and extract operations required for Data Streams Monitoring.
Monitorización de conectores
Conectores de Confluent Cloud
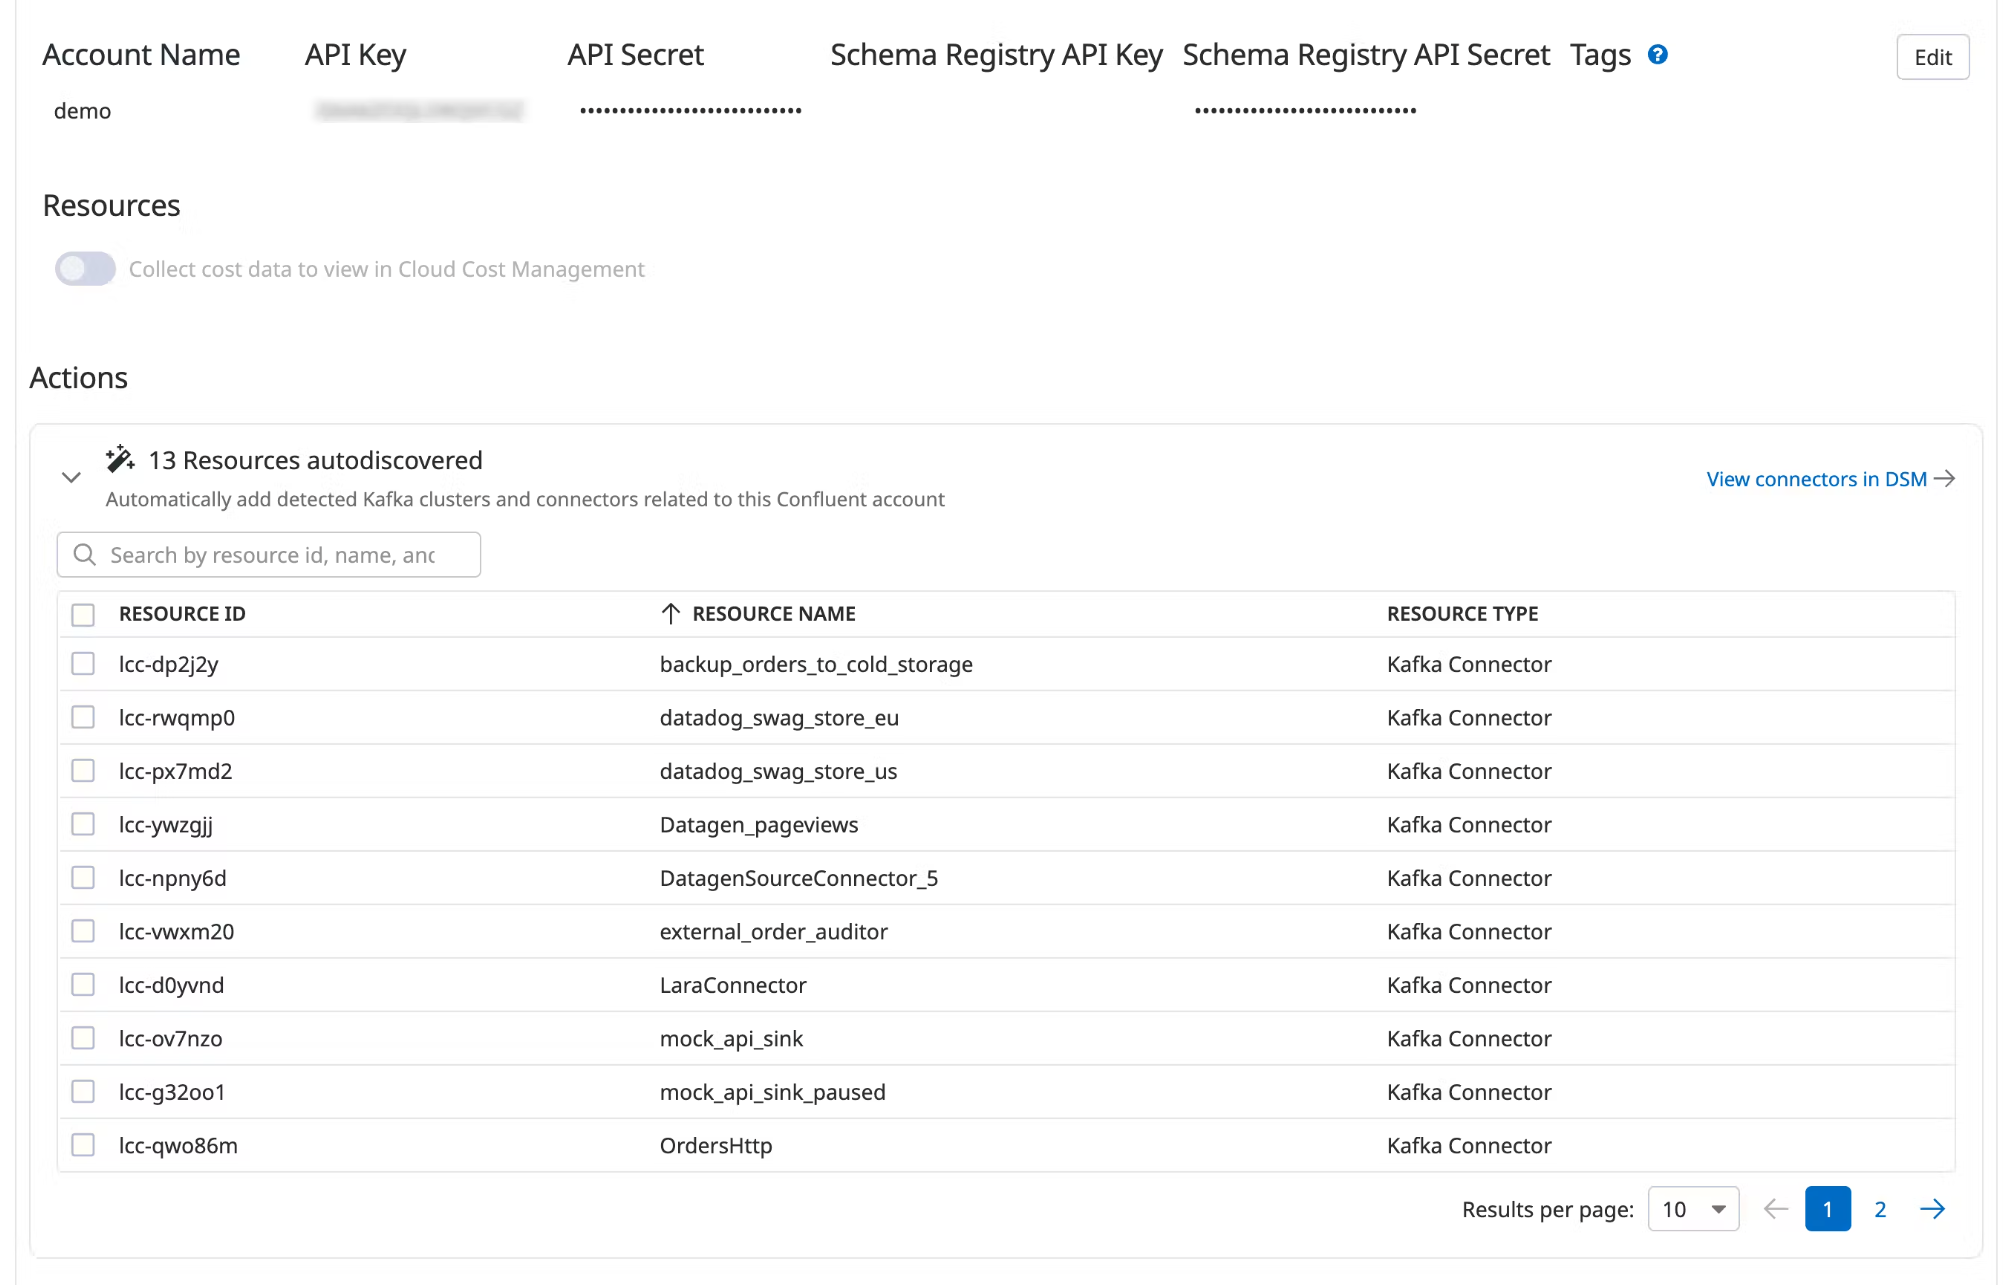
Data Streams Monitoring can automatically discover your Confluent Cloud connectors and visualize them within the context of your end-to-end streaming data pipeline.
Under Actions, a list of resources populates with detected clusters and connectors. Datadog attempts to discover new connectors every time you view this integration tile.
Select the resources you want to add.
Click Add Resources.
Navigate to Data Streams Monitoring to visualize the connectors and track connector status and throughput.
Tamaño de los mensajes
Cuando Data Streams Monitoring está activado en el modo por defecto, algunos mensajes no se instrumentan cuando son demasiado pequeños, o demasiado grandes.
Los siguientes umbrales de tamaño se aplican cuando Data Streams Monitoring está activado en el modo por defecto:
Kafka
Los mensajes de menos de 34 bytes no se instrumentan por defecto.
RabbitMQ
Los mensajes de más de 128 kilobytes no se instrumentan por defecto.
Amazon Kinesis
Los mensajes de menos de 34 bytes no se instrumentan por defecto.