- Esenciales
- Empezando
- Agent
- API
- Rastreo de APM
- Contenedores
- Dashboards
- Monitorización de bases de datos
- Datadog
- Sitio web de Datadog
- DevSecOps
- Gestión de incidencias
- Integraciones
- Internal Developer Portal
- Logs
- Monitores
- OpenTelemetry
- Generador de perfiles
- Session Replay
- Security
- Serverless para Lambda AWS
- Software Delivery
- Monitorización Synthetic
- Etiquetas (tags)
- Workflow Automation
- Centro de aprendizaje
- Compatibilidad
- Glosario
- Atributos estándar
- Guías
- Agent
- Arquitectura
- IoT
- Plataformas compatibles
- Recopilación de logs
- Configuración
- Automatización de flotas
- Solucionar problemas
- Detección de nombres de host en contenedores
- Modo de depuración
- Flare del Agent
- Estado del check del Agent
- Problemas de NTP
- Problemas de permisos
- Problemas de integraciones
- Problemas del sitio
- Problemas de Autodiscovery
- Problemas de contenedores de Windows
- Configuración del tiempo de ejecución del Agent
- Consumo elevado de memoria o CPU
- Guías
- Seguridad de datos
- Integraciones
- Desarrolladores
- Autorización
- DogStatsD
- Checks personalizados
- Integraciones
- Build an Integration with Datadog
- Crear una integración basada en el Agent
- Crear una integración API
- Crear un pipeline de logs
- Referencia de activos de integración
- Crear una oferta de mercado
- Crear un dashboard de integración
- Create a Monitor Template
- Crear una regla de detección Cloud SIEM
- Instalar la herramienta de desarrollo de integraciones del Agente
- Checks de servicio
- Complementos de IDE
- Comunidad
- Guías
- OpenTelemetry
- Administrator's Guide
- API
- Partners
- Aplicación móvil de Datadog
- DDSQL Reference
- CoScreen
- CoTerm
- Remote Configuration
- Cloudcraft
- En la aplicación
- Dashboards
- Notebooks
- Editor DDSQL
- Reference Tables
- Hojas
- Monitores y alertas
- Watchdog
- Métricas
- Bits AI
- Internal Developer Portal
- Error Tracking
- Explorador
- Estados de problemas
- Detección de regresión
- Suspected Causes
- Error Grouping
- Bits AI Dev Agent
- Monitores
- Issue Correlation
- Identificar confirmaciones sospechosas
- Auto Assign
- Issue Team Ownership
- Rastrear errores del navegador y móviles
- Rastrear errores de backend
- Manage Data Collection
- Solucionar problemas
- Guides
- Change Tracking
- Gestión de servicios
- Objetivos de nivel de servicio (SLOs)
- Gestión de incidentes
- De guardia
- Status Pages
- Gestión de eventos
- Gestión de casos
- Actions & Remediations
- Infraestructura
- Cloudcraft
- Catálogo de recursos
- Universal Service Monitoring
- Hosts
- Contenedores
- Processes
- Serverless
- Monitorización de red
- Cloud Cost
- Rendimiento de las aplicaciones
- APM
- Términos y conceptos de APM
- Instrumentación de aplicación
- Recopilación de métricas de APM
- Configuración de pipelines de trazas
- Correlacionar trazas (traces) y otros datos de telemetría
- Trace Explorer
- Recommendations
- Code Origin for Spans
- Observabilidad del servicio
- Endpoint Observability
- Instrumentación dinámica
- Live Debugger
- Error Tracking
- Seguridad de los datos
- Guías
- Solucionar problemas
- Límites de tasa del Agent
- Métricas de APM del Agent
- Uso de recursos del Agent
- Logs correlacionados
- Stacks tecnológicos de llamada en profundidad PHP 5
- Herramienta de diagnóstico de .NET
- Cuantificación de APM
- Go Compile-Time Instrumentation
- Logs de inicio del rastreador
- Logs de depuración del rastreador
- Errores de conexión
- Continuous Profiler
- Database Monitoring
- Gastos generales de integración del Agent
- Arquitecturas de configuración
- Configuración de Postgres
- Configuración de MySQL
- Configuración de SQL Server
- Configuración de Oracle
- Configuración de MongoDB
- Setting Up Amazon DocumentDB
- Conexión de DBM y trazas
- Datos recopilados
- Explorar hosts de bases de datos
- Explorar métricas de consultas
- Explorar ejemplos de consulta
- Exploring Database Schemas
- Exploring Recommendations
- Solucionar problemas
- Guías
- Data Streams Monitoring
- Data Jobs Monitoring
- Data Observability
- Experiencia digital
- Real User Monitoring
- Pruebas y monitorización de Synthetics
- Continuous Testing
- Análisis de productos
- Entrega de software
- CI Visibility
- CD Visibility
- Deployment Gates
- Test Visibility
- Configuración
- Network Settings
- Tests en contenedores
- Repositories
- Explorador
- Monitores
- Test Health
- Flaky Test Management
- Working with Flaky Tests
- Test Impact Analysis
- Flujos de trabajo de desarrolladores
- Cobertura de código
- Instrumentar tests de navegador con RUM
- Instrumentar tests de Swift con RUM
- Correlacionar logs y tests
- Guías
- Solucionar problemas
- Code Coverage
- Quality Gates
- Métricas de DORA
- Feature Flags
- Seguridad
- Información general de seguridad
- Cloud SIEM
- Code Security
- Cloud Security Management
- Application Security Management
- Workload Protection
- Sensitive Data Scanner
- Observabilidad de la IA
- Log Management
- Observability Pipelines
- Gestión de logs
- CloudPrem
- Administración
- Gestión de cuentas
- Seguridad de los datos
- Ayuda
How can I graph the percentage change between an earlier value and a current value?
Esta página aún no está disponible en español. Estamos trabajando en su traducción.
Si tienes alguna pregunta o comentario sobre nuestro actual proyecto de traducción, no dudes en ponerte en contacto con nosotros.
Si tienes alguna pregunta o comentario sobre nuestro actual proyecto de traducción, no dudes en ponerte en contacto con nosotros.
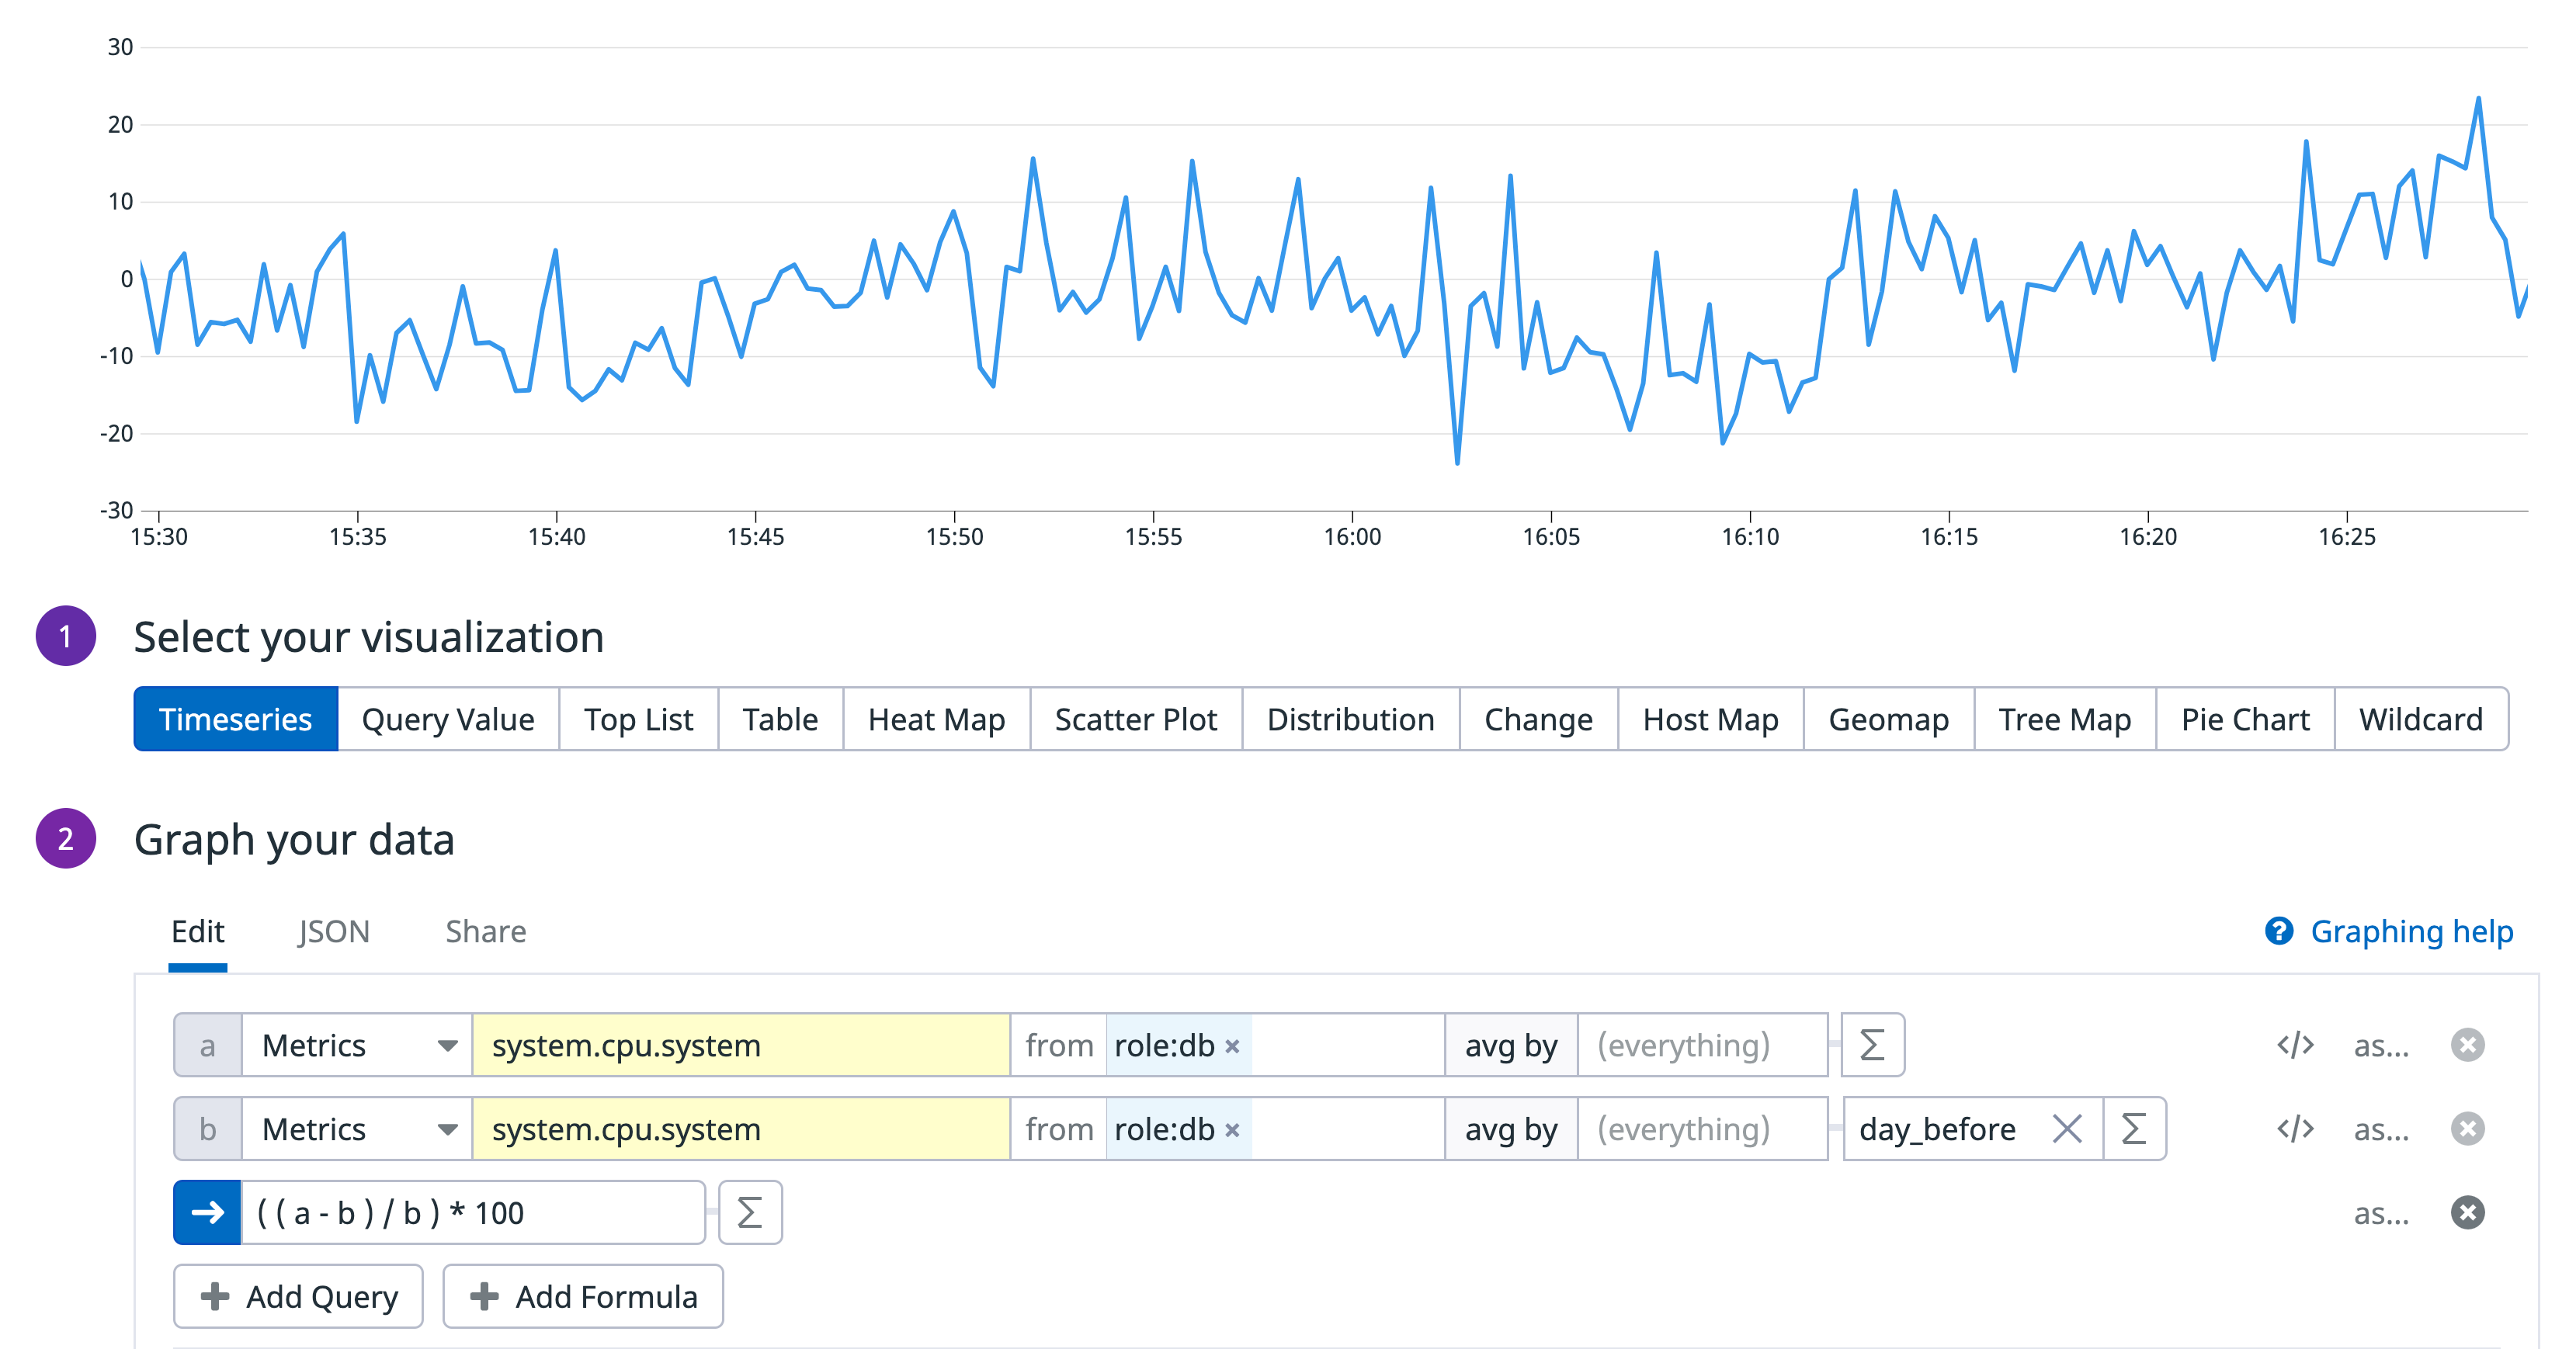
If you want to visualize how a metric’s values have changed in comparison to an earlier time period, do so by leveraging the Timeshift functions. You can capture a metric’s value from an hour, day, week, or month before.
To calculate this, you can create a query such as this:
((current_value - old_value) / old_value) * 100
Here’s an example where you can see the percentage change of a system metric from one day ago to the present:

