- Essentials
- Getting Started
- Datadog
- Datadog Site
- DevSecOps
- Serverless for AWS Lambda
- Agent
- Integrations
- Containers
- Dashboards
- Monitors
- Logs
- APM Tracing
- Profiler
- Tags
- API
- Service Catalog
- Session Replay
- Continuous Testing
- Synthetic Monitoring
- Incident Management
- Database Monitoring
- Cloud Security Management
- Cloud SIEM
- Application Security Management
- Workflow Automation
- CI Visibility
- Test Visibility
- Intelligent Test Runner
- Code Analysis
- Learning Center
- Support
- Glossary
- Standard Attributes
- Guides
- Agent
- Integrations
- OpenTelemetry
- Developers
- Authorization
- DogStatsD
- Custom Checks
- Integrations
- Create an Agent-based Integration
- Create an API Integration
- Create a Log Pipeline
- Integration Assets Reference
- Build a Marketplace Offering
- Create a Tile
- Create an Integration Dashboard
- Create a Recommended Monitor
- Create a Cloud SIEM Detection Rule
- OAuth for Integrations
- Install Agent Integration Developer Tool
- Service Checks
- IDE Plugins
- Community
- Guides
- API
- Datadog Mobile App
- CoScreen
- Cloudcraft
- In The App
- Dashboards
- Notebooks
- Monitors and Alerting
- Infrastructure
- Metrics
- Watchdog
- Bits AI
- Service Catalog
- API Catalog
- Error Tracking
- Service Management
- Infrastructure
- Application Performance
- APM
- Continuous Profiler
- Database Monitoring
- Data Streams Monitoring
- Data Jobs Monitoring
- Digital Experience
- Real User Monitoring
- Product Analytics
- Synthetic Testing and Monitoring
- Continuous Testing
- Software Delivery
- CI Visibility
- CD Visibility
- Test Visibility
- Intelligent Test Runner
- Code Analysis
- Quality Gates
- DORA Metrics
- Security
- Security Overview
- Cloud SIEM
- Cloud Security Management
- Application Security Management
- AI Observability
- Log Management
- Observability Pipelines
- Log Management
- Administration
Datadog Extension for Visual Studio
Overview
The Datadog extension for Visual Studio helps you find and fix bugs, security issues, and performance bottlenecks based on real-time observability data from your services and runtime environments.
Code insights
Stay informed about Error Tracking issues, Security Vulnerabilities, and Flaky Tests without leaving Visual Studio.
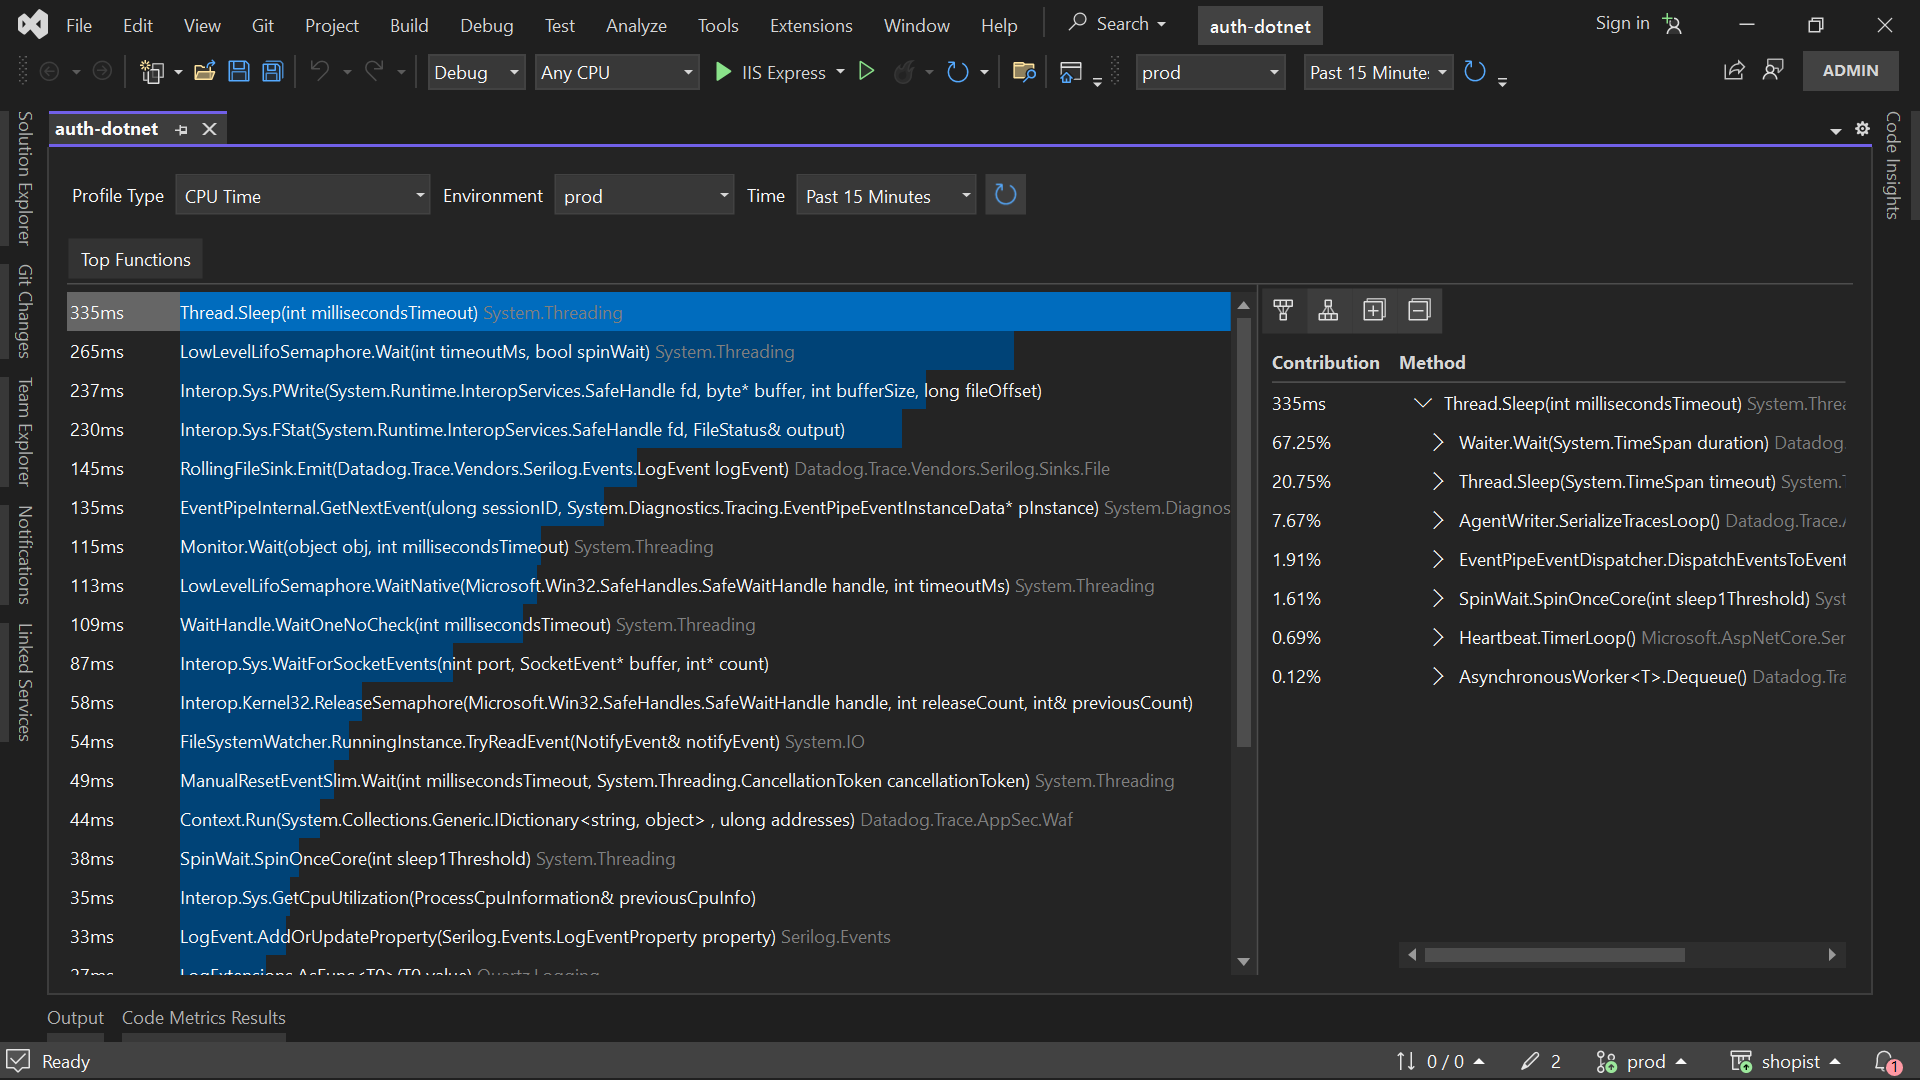
Continuous Profiler
Analyze and improve the performance of your applications with real-time profiling metrics for CPU, Memory, I/O, and others.
Logs navigation
You can navigate to the Log Explorer on the Datadog platform directly from your C# source files. Look for the clickable icon preceding message strings from log statements within your source code:
Clicking the icon opens the Log Explorer with a query that matches the logger name, log level, and log message as closely as possible.
Open code in Visual Studio from Datadog
Navigate from Datadog to your source code with one click.
Static Analysis
The Datadog extension runs Static Analysis rules on the source files you have open in your Solution. The goal is to detect and fix problems such as maintainability issues, bugs, or security vulnerabilities in your code before you commit your changes.
Static Analysis supports scanning for many programming languages. For a complete list, see Static Analysis Rules. For file types belonging to supported languages, rule violations are highlighted in the source code editor, and suggested fixes can be applied directly:
When you start editing a source file supported by Static Analysis, the extension checks for static-analysis.datadog.yml at your source repository’s root. The static analyzer runs automatically in the background.
The Static Analysis feature does not require a Datadog account, as source files are analyzed locally.
Getting started
Requirements
- Windows operating system 64-bit
- Visual Studio 2022 64-bit Community, Professional, or Enterprise edition
- Datadog account with Continuous Profiler and Source Code Integration enabled. For more information, see Enabling the Profiler.
Setup and installation
- Download and install the extension from the official Visual Studio Marketplace.
- In Visual Studio, go to Tools > Options > Datadog.
- Sign in with your Datadog account, or sign up for a free trial.
- Open a solution in Visual Studio.
- Go to Extensions > Datadog > Linked Services.
- Add services, and save your solution.
- Go to Extensions > Datadog > Code Insights.
Feedback
Report a bug, request a new feature, or ask for help on the Discussion Forum and Issue Tracker on GitHub. You can also email team-ide-integration@datadoghq.com.
Further Reading
Additional helpful documentation, links, and articles:


