- Agents
- Essentials
- Getting Started
- Agent
- API
- APM Tracing
- Containers
- Dashboards
- Database Monitoring
- Datadog
- Datadog Site
- DevSecOps
- Incident Management
- Integrations
- Internal Developer Portal
- Logs
- Monitors
- Notebooks
- OpenTelemetry
- Profiler
- Search
- Session Replay
- Security
- Serverless for AWS Lambda
- Software Delivery
- Synthetic Monitoring and Testing
- Tags
- Workflow Automation
- Learning Center
- Support
- Glossary
- Standard Attributes
- Guides
- Agent
- Integrations
- Extend Datadog
- Authorization
- DogStatsD
- Custom Checks
- Integrations
- Build an Integration with Datadog
- Create an Agent-based Integration
- Create an API-based Integration
- Create a Log Pipeline
- Integration Assets Reference
- Build a Marketplace Offering
- Create an Integration Dashboard
- Create a Monitor Template
- Create a Cloud SIEM Detection Rule
- Install Agent Integration Developer Tool
- Service Checks
- Community
- Guides
- OpenTelemetry
- Administrator's Guide
- API
- Partners
- Datadog Mobile App
- DDSQL Reference
- CoScreen
- CoTerm
- Remote Configuration
- Cloudcraft (Standalone)
- In The App
- Dashboards
- Notebooks
- DDSQL Editor
- Reference Tables
- Sheets
- Monitors and Alerting
- Service Level Objectives
- Metrics
- Watchdog
- Bits AI
- Internal Developer Portal
- Error Tracking
- Change Tracking
- Event Management
- Incident Response
- Actions & Remediations
- Infrastructure
- Cloudcraft
- Resource Catalog
- Universal Service Monitoring
- End User Device Monitoring
- Hosts
- Containers
- Processes
- Serverless
- Network Monitoring
- Storage Management
- Cloud Cost
- Application Performance
- APM
- Continuous Profiler
- Database Monitoring
- Agent Integration Overhead
- Setup Architectures
- Setting Up Postgres
- Setting Up MySQL
- Setting Up SQL Server
- Setting Up Oracle
- Setting Up Amazon DocumentDB
- Setting Up MongoDB
- Setting Up ClickHouse
- Connecting DBM and Traces
- Data Collected
- Exploring Database Hosts
- Exploring Query Metrics
- Exploring Query Samples
- Exploring Database Schemas
- Exploring Recommendations
- Troubleshooting
- Guides
- Data Streams Monitoring
- Data Observability
- Digital Experience
- Real User Monitoring
- Synthetic Testing and Monitoring
- Continuous Testing
- Experiments
- Product Analytics
- Session Replay
- Software Delivery
- CI Visibility
- CD Visibility
- Deployment Gates
- Test Optimization
- Code Coverage
- PR Gates
- DORA Metrics
- Feature Flags
- Developer Integrations
- Security
- Security Overview
- Cloud SIEM
- Code Security
- Cloud Security
- App and API Protection
- AI Guard
- Workload Protection
- Sensitive Data Scanner
- AI Observability
- Log Management
- Observability Pipelines
- Configuration
- Sources
- Processors
- Destinations
- Amazon OpenSearch
- Amazon S3
- Amazon Security Lake
- Azure Storage
- CrowdStrike NG-SIEM
- Datadog Archives
- Datadog CloudPrem
- Datadog Logs
- Datadog Metrics
- Elasticsearch
- Google Cloud Storage
- Google Pub/Sub
- Google SecOps
- HTTP Client
- Kafka
- Microsoft Sentinel
- New Relic
- OpenSearch
- SentinelOne
- Socket
- Splunk HEC
- Sumo Logic Hosted Collector
- Syslog
- Packs
- Akamai CDN
- Amazon CloudFront
- Amazon VPC Flow Logs
- AWS Application Load Balancer Logs
- AWS CloudTrail
- AWS Elastic Load Balancer Logs
- AWS Network Load Balancer Logs
- Cisco ASA
- Cloudflare
- F5
- Fastly
- Fortinet Firewall
- HAProxy Ingress
- Istio Proxy
- Juniper SRX Firewall Traffic Logs
- Netskope
- NGINX
- Okta
- Palo Alto Firewall
- Windows XML
- ZScaler ZIA DNS
- Zscaler ZIA Firewall
- Zscaler ZIA Tunnel
- Zscaler ZIA Web Logs
- Search Syntax
- Scaling and Performance
- Monitoring and Troubleshooting
- Guides and Resources
- Log Management
- CloudPrem
- Administration
Correlate Database Monitoring and Traces
This guide assumes that you have configured Database Monitoring and are using APM. Connecting APM and DBM injects APM trace identifiers into DBM data collection, which allows for correlation of these two data sources. This enables product features showing database information in the APM product, and APM data in the DBM product.
Before you begin
- Supported databases
- Postgres, MySQL, SQL Server, Oracle, MongoDB
- Supported Agent versions
- 7.46+
- Data privacy
- Enabling SQL comment propagation results in potentially confidential data (service names) being stored in the databases which can then be accessed by other third parties that have been granted access to the database.
APM tracer integrations support a Propagation Mode, which controls the amount of information passed from applications to the database.
fullmode sends full trace information to the database, allowing you to investigate individual traces within DBM. This is the recommended solution for most integrations.servicemode sends the service name, allowing you to understand which services are the contributors to database load.disabledmode disables propagation and does not send any information from applications.
| DD_DBM_PROPAGATION_MODE | Postgres | MySQL | SQL Server | Oracle | MongoDB |
|---|---|---|---|---|---|
full | * | ** | |||
service |
* Full propagation mode on Aurora MySQL requires version 3.
** Full propagation mode on Oracle is only supported when using Java.
Supported application tracers and drivers
| Language | Library or Framework | Postgres | MySQL | SQL Server | Oracle | MongoDB |
|---|---|---|---|---|---|---|
| Go: dd-trace-go >= 1.44.0 | ||||||
| database/sql | service mode only | service mode only | ||||
| sqlx | service mode only | service mode only | ||||
| Java dd-trace-java >= 1.11.0 | ||||||
| jdbc | ** | *** | ||||
| mongo-java-driver | ****** | |||||
| Ruby: dd-trace-rb >= 1.8.0 | ||||||
| pg | ||||||
| mysql2 | ||||||
| Python: dd-trace-py >= 1.9.0 | ||||||
| psycopg2 | ||||||
| psycopg | ||||||
| dd-trace-py >= 2.9.0 | ||||||
| asyncpg | ||||||
| aiomysql | ||||||
| mysql-connector-python | ||||||
| mysqlclient | ||||||
| pymysql | ||||||
| pymongo | ***** | |||||
| .NET dd-trace-dotnet >= 2.35.0 | ||||||
| Npgsql * | ||||||
| MySql.Data * | ||||||
| MySqlConnector * | ||||||
| System.Data.SqlClient * | ** | |||||
| Microsoft.Data.SqlClient * | ** | |||||
| PHP dd-trace-php >= 0.86.0 | ||||||
| pdo | ||||||
| MySQLi | ||||||
| Node.js: dd-trace-js >= 3.17.0 | ||||||
| postgres | ||||||
| mysql | ||||||
| mysql2 | ||||||
| mongodb | **** |
* CommandType.StoredProcedure not supported
** Full mode SQL Server for Java/.NET:
If your application uses
context_info for instrumentation, the APM tracer overwrites it.- The instrumentation executes a
SET context_infocommand when the client issues a query, which makes an additional round-trip to the database. - Prerequisites:
- Agent version 7.55.0 or greater
- Java tracer version 1.39.0 or greater
- .NET tracer version 3.3 or greater
*** Full mode Oracle for Java:
- The instrumentation overwrites
V$SESSION.ACTION. - Prerequisite: Java tracer 1.45 or greater
**** Service/Full mode MongoDB for Node.js:
- Prerequisite:
- Node.js tracer 5.80.0 or greater
***** Service/Full mode MongoDB for Python:
- Prerequisite:
- Python tracer 3.5.0 or greater
****** Service/Full mode MongoDB for Java:
- Prerequisite:
- Java tracer 1.58.0 or greater
- mongo-java-driver v3.8 or greater
Setup
For the best user experience, ensure the following environment variables are set in your application:
DD_SERVICE=(application name)
DD_ENV=(application environment)
DD_VERSION=(application version)
Datadog recommends setting the obfuscation mode to obfuscate_and_normalize for Agent versions 7.63 and higher. Add the following parameter in the apm_config section of your APM Agent configuration file:
sql_obfuscation_mode: "obfuscate_and_normalize"
Changing the obfuscation mode may alter the normalized SQL text. If you have monitors based on SQL text in APM traces, you may need to update them.
Update your app dependencies to include dd-trace-go@v1.44.0 or greater. Note: This documentation uses v2 of the Go tracer, which Datadog recommends for all users. If you are using v1, see the migration guide to upgrade to v2.
go get github.com/DataDog/dd-trace-go/v2 # 2.x
Update your code to import the contrib/database/sql package:
import (
   "database/sql"
   "github.com/DataDog/dd-trace-go/v2/ddtrace/tracer"
   sqltrace "github.com/DataDog/dd-trace-go/contrib/database/sql/v2"
)
Enable the database monitoring propagation feature using one of the following methods:
Env variable:
DD_DBM_PROPAGATION_MODE=fullUsing code during the driver registration:
sqltrace.Register("postgres", &pq.Driver{}, sqltrace.WithDBMPropagation(tracer.DBMPropagationModeFull), sqltrace.WithService("my-db-service"))Using code on
sqltrace.Open:sqltrace.Register("postgres", &pq.Driver{}, sqltrace.WithService("my-db-service")) db, err := sqltrace.Open("postgres", "postgres://pqgotest:password@localhost/pqgotest?sslmode=disable", sqltrace.WithDBMPropagation(tracer.DBMPropagationModeFull)) if err != nil { log.Fatal(err) }
Full example:
import (
	"database/sql"
	"github.com/DataDog/dd-trace-go/v2/ddtrace/tracer"
   sqltrace "github.com/DataDog/dd-trace-go/contrib/database/sql/v2"
)

func main() {
	// The first step is to set the dbm propagation mode when registering the driver. Note that this can also
	// be done on sqltrace.Open for more granular control over the feature.
	sqltrace.Register("postgres", &pq.Driver{}, sqltrace.WithDBMPropagation(tracer.DBMPropagationModeFull))

	// Followed by a call to Open.
	db, err := sqltrace.Open("postgres", "postgres://pqgotest:password@localhost/pqgotest?sslmode=disable")
	if err != nil {
		log.Fatal(err)
	}

	// Then, we continue using the database/sql package as we normally would, with tracing.
	rows, err := db.Query("SELECT name FROM users WHERE age=?", 27)
	if err != nil {
		log.Fatal(err)
	}
	defer rows.Close()
}
Follow the Java tracing instrumentation instructions and install the 1.11.0 version, or greater, of the Agent.
You must also enable the jdbc-datasource instrumentation.
Enable the database monitoring propagation feature using one of the following methods:
- Set the system property
dd.dbm.propagation.mode=full - Set the environment variable
DD_DBM_PROPAGATION_MODE=full
Full example:
# Start the Java Agent with the required system properties
java -javaagent:/path/to/dd-java-agent.jar -Ddd.dbm.propagation.mode=full -Ddd.integration.jdbc-datasource.enabled=true -Ddd.service=my-app -Ddd.env=staging -Ddd.version=1.0 -jar path/to/your/app.jar
Test the feature in your application:
public class Application {
    public static void main(String[] args) {
        try {
            Connection connection = DriverManager
                    .getConnection("jdbc:postgresql://127.0.0.1/foobar?preferQueryMode=simple", "user", "password");
            Statement stmt = connection.createStatement();
            String sql = "SELECT * FROM foo";
            stmt.execute(sql);
            stmt.close();
            connection.close();
        } catch (SQLException exception) {
            //  exception logic
        }
    }
}
Tracer versions 1.44 and above: Enable the prepared statements tracing for Postgres using one of the following methods:
- Set the system property
dd.dbm.trace_prepared_statements=true - Set the environment variable
export DD_DBM_TRACE_PREPARED_STATEMENTS=true
Note: The prepared statements instrumentation overwrites the Application property with the text _DD_overwritten_by_tracer, and causes an extra round trip to the database. This additional round trip normally has a negligible impact on the SQL statement execution time.
Enabling prepared statements tracing may cause increased connection pinning when using Amazon RDS Proxy, which reduces connection pooling efficiency. For more information, see Connection pinning on RDS Proxy.
Tracer versions below 1.44:
Prepared statements are not supported in full mode for Postgres and MySQL, and all JDBC API calls that use prepared statements are automatically downgraded to service mode. Since most Java SQL libraries use prepared statements by default, this means that most Java applications are only able to use service mode.
In your Gemfile, install or update dd-trace-rb to version 1.8.0 or greater:
source 'https://rubygems.org'
gem 'datadog' # Use `'ddtrace', '>= 1.8.0'` if you're using v1.x

# Depends on your usage
gem 'mysql2'
gem 'pg'
Enable the database monitoring propagation feature using one of the following methods:
Env variable:
DD_DBM_PROPAGATION_MODE=fullOption
comment_propagation(default:ENV['DD_DBM_PROPAGATION_MODE']), for mysql2 or pg:Datadog.configure do |c| c.tracing.instrument :mysql2, comment_propagation: 'full' c.tracing.instrument :pg, comment_propagation: 'full' end
Full example:
require 'mysql2'
require 'ddtrace'

Datadog.configure do |c|
	c.service = 'billing-api'
	c.env = 'production'
	c.version = '1.3-alpha'

	c.tracing.instrument :mysql2, comment_propagation: ENV['DD_DBM_PROPAGATION_MODE']
end

client = Mysql2::Client.new(:host => "localhost", :username => "root")
client.query("SELECT 1;")
Update your app dependencies to include dd-trace-py>=1.9.0:
pip install "ddtrace>=1.9.0"
For Postgres, install psycopg2:
pip install psycopg2
For MongoDB (requires dd-trace-py>=3.5.0), install pymongo:
pip install pymongo
Enable the database monitoring propagation feature by setting the following environment variable:
DD_DBM_PROPAGATION_MODE=full
Postgres example:
import psycopg2

POSTGRES_CONFIG = {
    "host": "127.0.0.1",
    "port": 5432,
    "user": "postgres_user",
    "password": "postgres_password",
    "dbname": "postgres_db_name",
}

# connect to postgres db
conn = psycopg2.connect(**POSTGRES_CONFIG)
cursor = conn.cursor()
# execute sql queries
cursor.execute("select 'blah'")
cursor.executemany("select %s", (("foo",), ("bar",)))
MongoDB example:
from pymongo import MongoClient

# Connect to MongoDB
client = MongoClient('mongodb://localhost:27017/')
db = client['test_database']
collection = db['test_collection']

# Insert a document
collection.insert_one({"name": "test", "value": 1})

# Query documents
results = collection.find({"name": "test"})
for doc in results:
    print(doc)
This feature requires automatic instrumentation to be enabled for your .NET service.
Follow the .NET Framework tracing instructions or the .NET Core tracing instructions to install the automatic instrumentation package and enable tracing for your service.
Ensure that you are using a supported client library. For example, Npgsql.
Enable the database monitoring propagation feature by setting the following environment variable:
- For Postgres and MySQL:
DD_DBM_PROPAGATION_MODE=full - For SQL Server:
DD_DBM_PROPAGATION_MODE=serviceorDD_DBM_PROPAGATION_MODE=fullwith Java and .NET tracers - For Oracle:
DD_DBM_PROPAGATION_MODE=service
This feature requires the tracer extension to be enabled for your PHP service.
Follow the PHP tracing instructions to install the automatic instrumentation package and enable tracing for your service.
Ensure that you are using a supported client library. For example, PDO.
Enable the database monitoring propagation feature by setting the following environment variable:
DD_DBM_PROPAGATION_MODE=full
Install or update dd-trace-js to a version greater than 3.17.0 (or 2.30.0 if using end-of-life Node.js version 12):
npm install dd-trace@^3.17.0
Update your code to import and initialize the tracer:
// This line must come before importing any instrumented module.
const tracer = require('dd-trace').init();
Enable the database monitoring propagation feature using one of the following methods:
Set the following env variable:
DD_DBM_PROPAGATION_MODE=fullSet the tracer to use the
dbmPropagationModeoption (default:ENV['DD_DBM_PROPAGATION_MODE']):const tracer = require('dd-trace').init({ dbmPropagationMode: 'full' })Enable only at the integration level:
const tracer = require('dd-trace').init();
tracer.use('pg', {
   dbmPropagationMode: 'full'
})
Full example:
const pg = require('pg')
const tracer = require('dd-trace').init({ dbmPropagationMode: 'full' })

const client = new pg.Client({
	user: 'postgres',
	password: 'postgres',
	database: 'postgres'
})

client.connect(err => {
	console.error(err);
	process.exit(1);
});

client.query('SELECT $1::text as message', ['Hello world!'], (err, result) => {
	// handle result
})
Explore the APM Connection in DBM
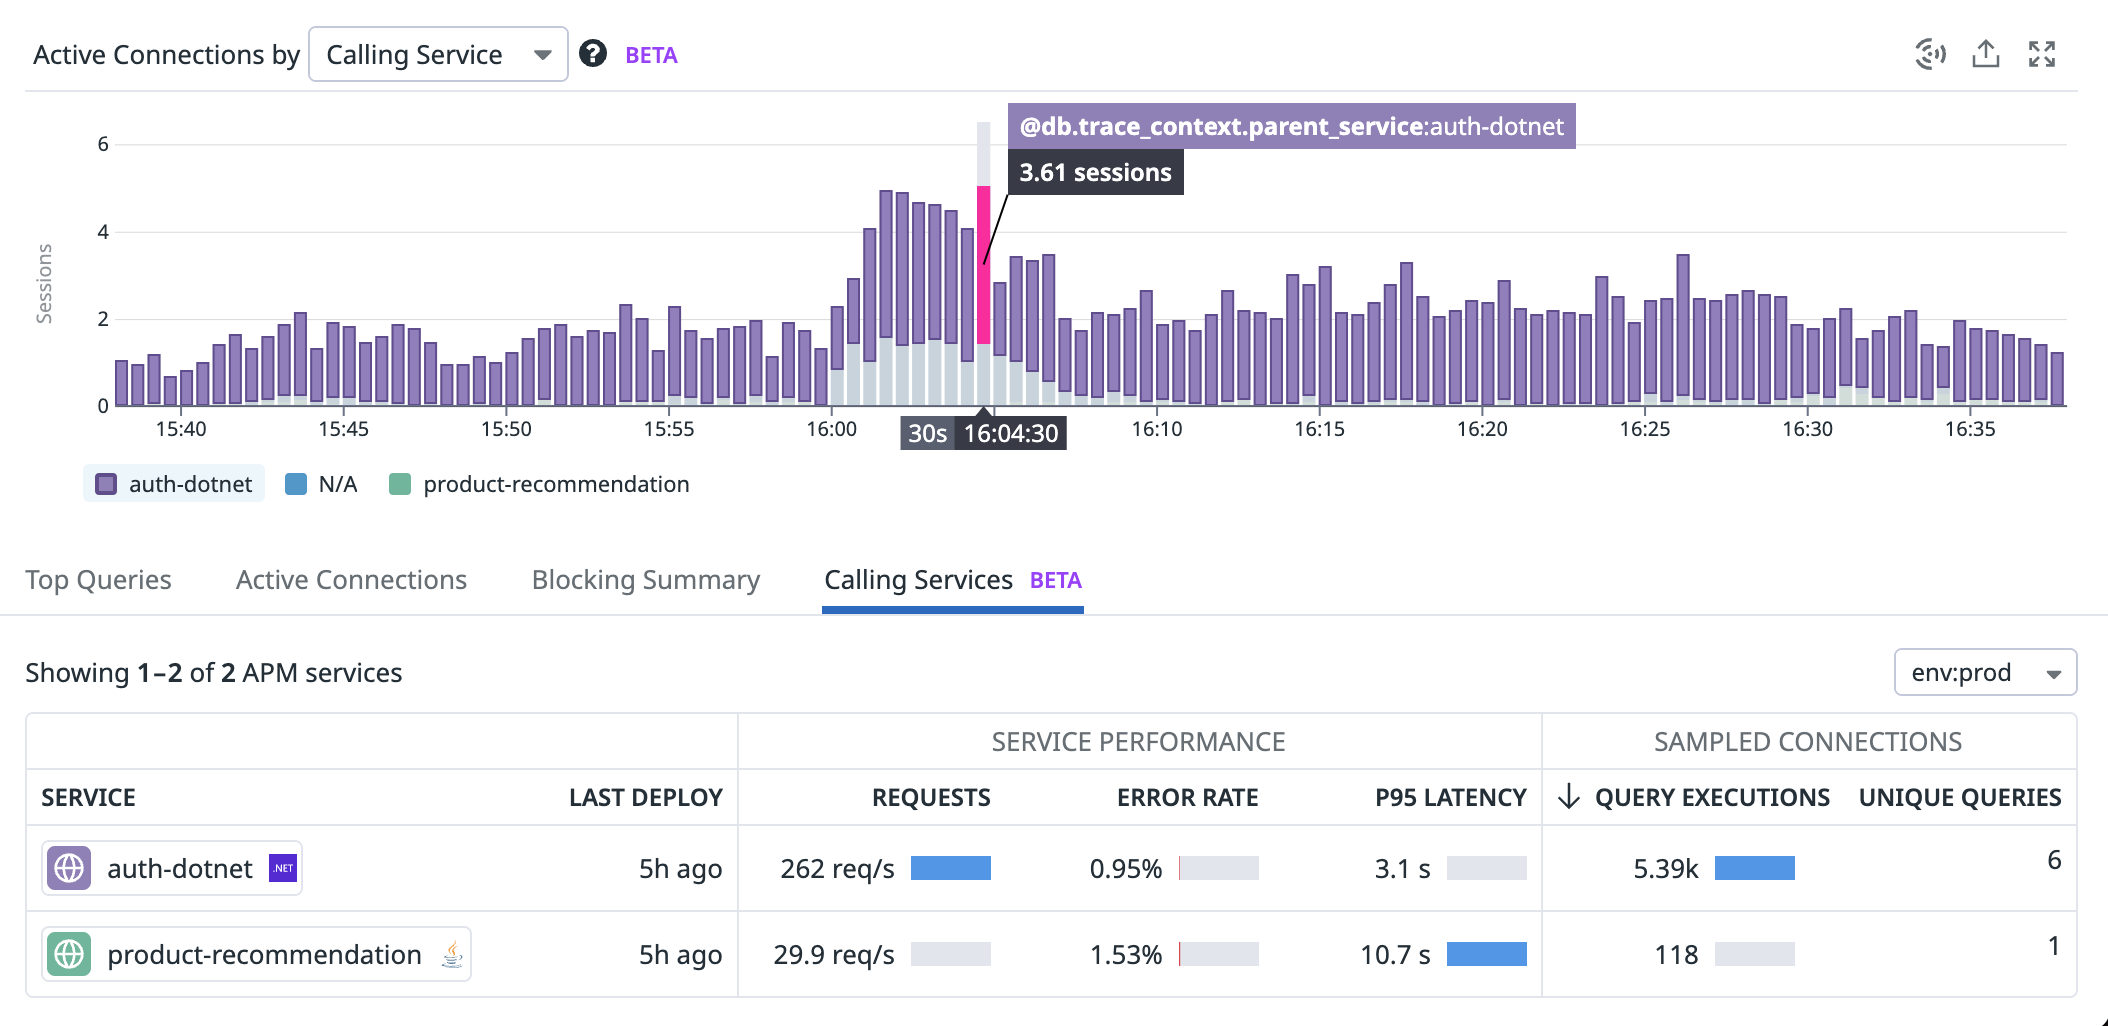
Attribute active database connections to the calling APM services
Break down active connections for a given host by the upstream APM services making the requests. You can attribute load on a database to individual services to understand which services are most active on the database. Pivot to the most active upstream service’s service page to continue the investigation.
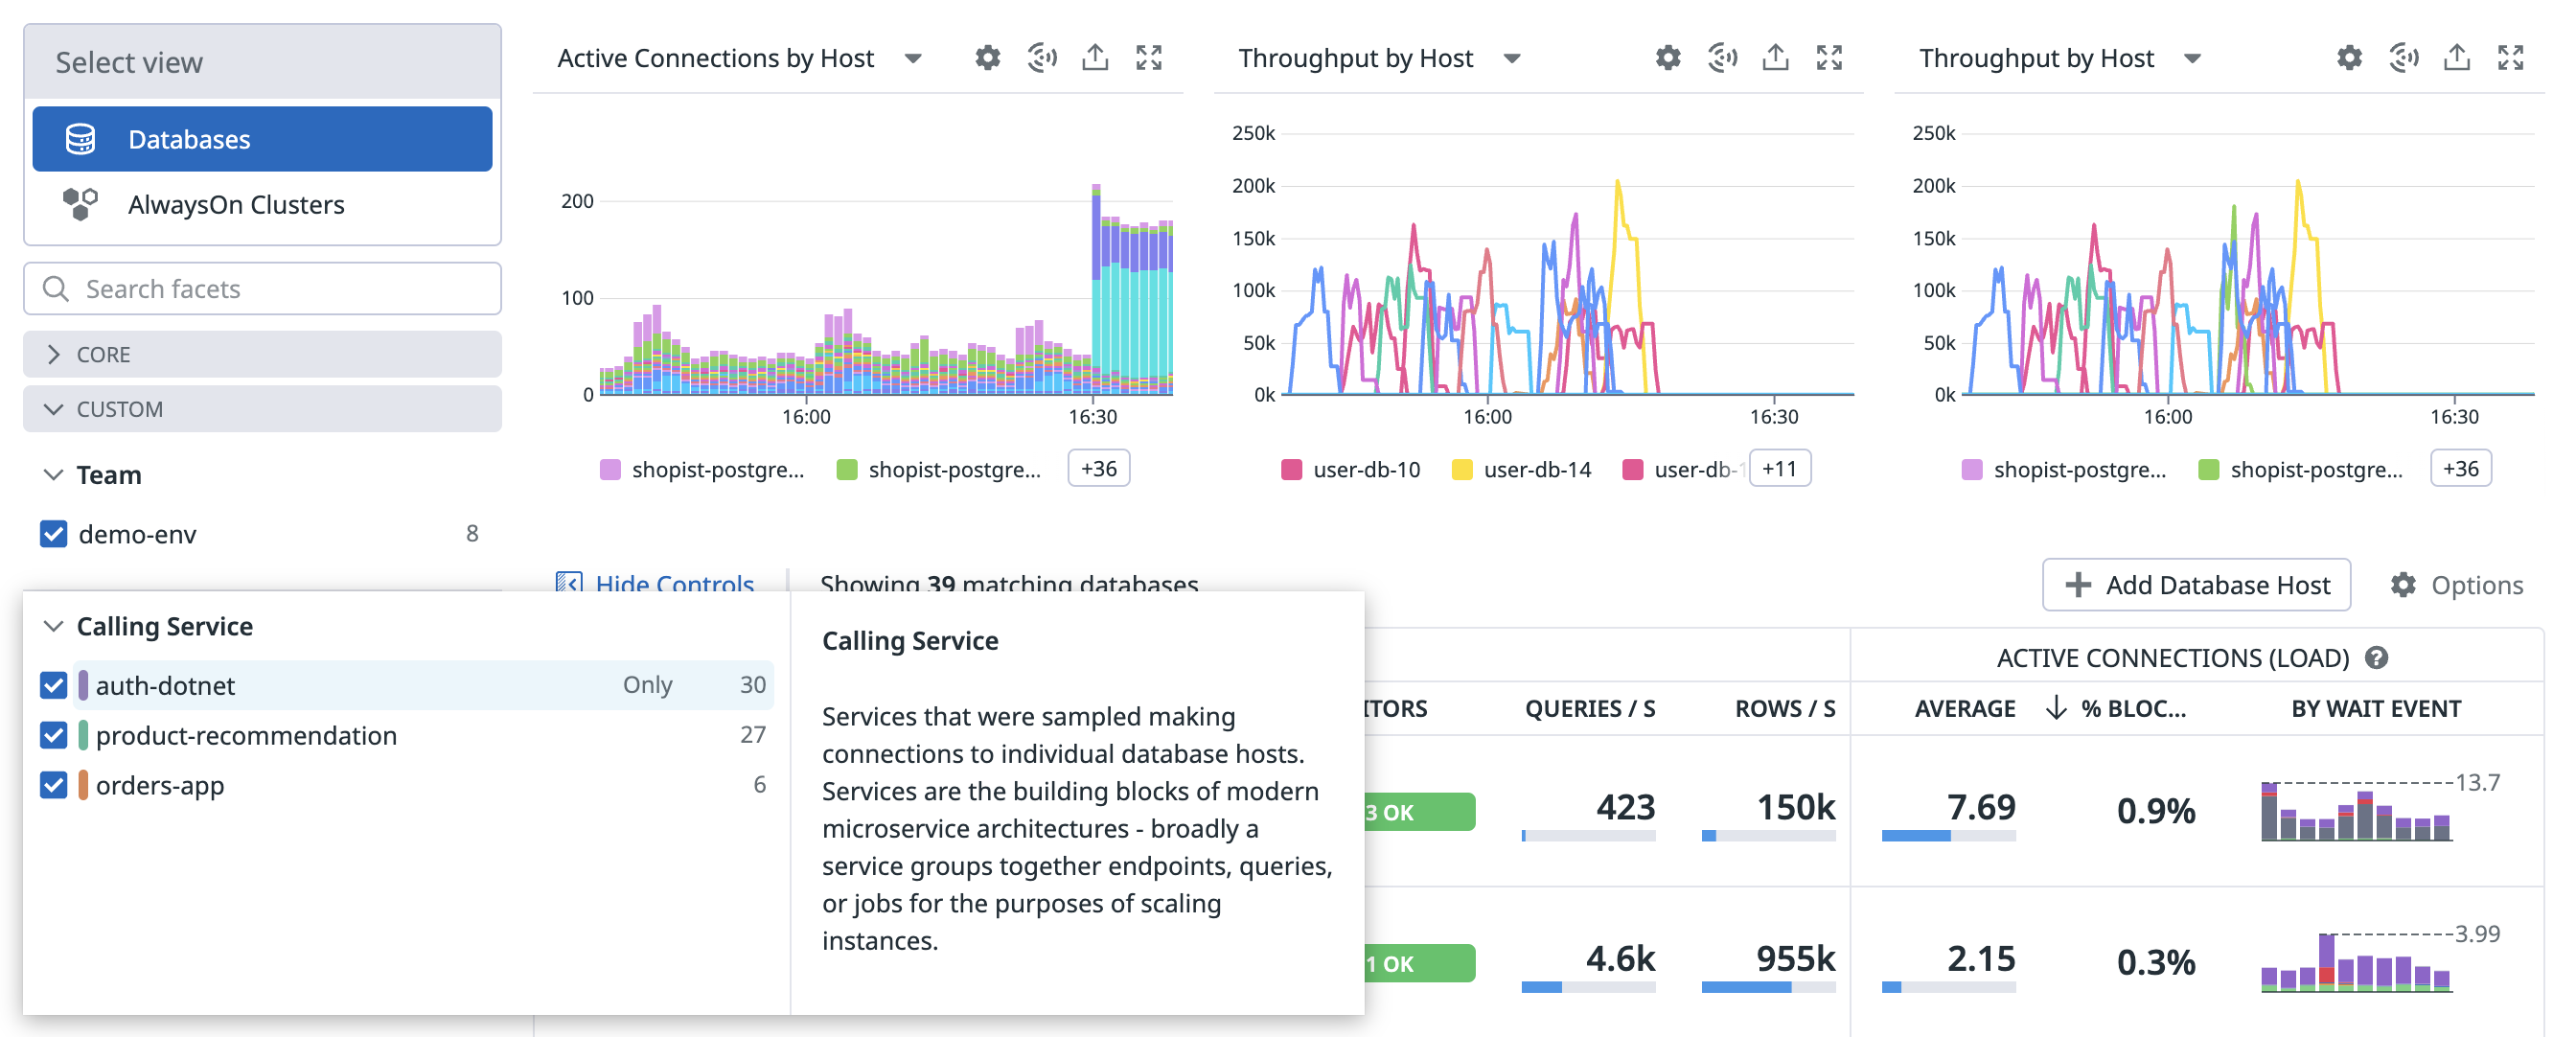
Filter your database hosts by the APM services that call them
Quickly filter the Database List to display only the database hosts that your specific APM services depend on. Easily identify if any of your downstream dependencies have blocking activity that may impact service performance.
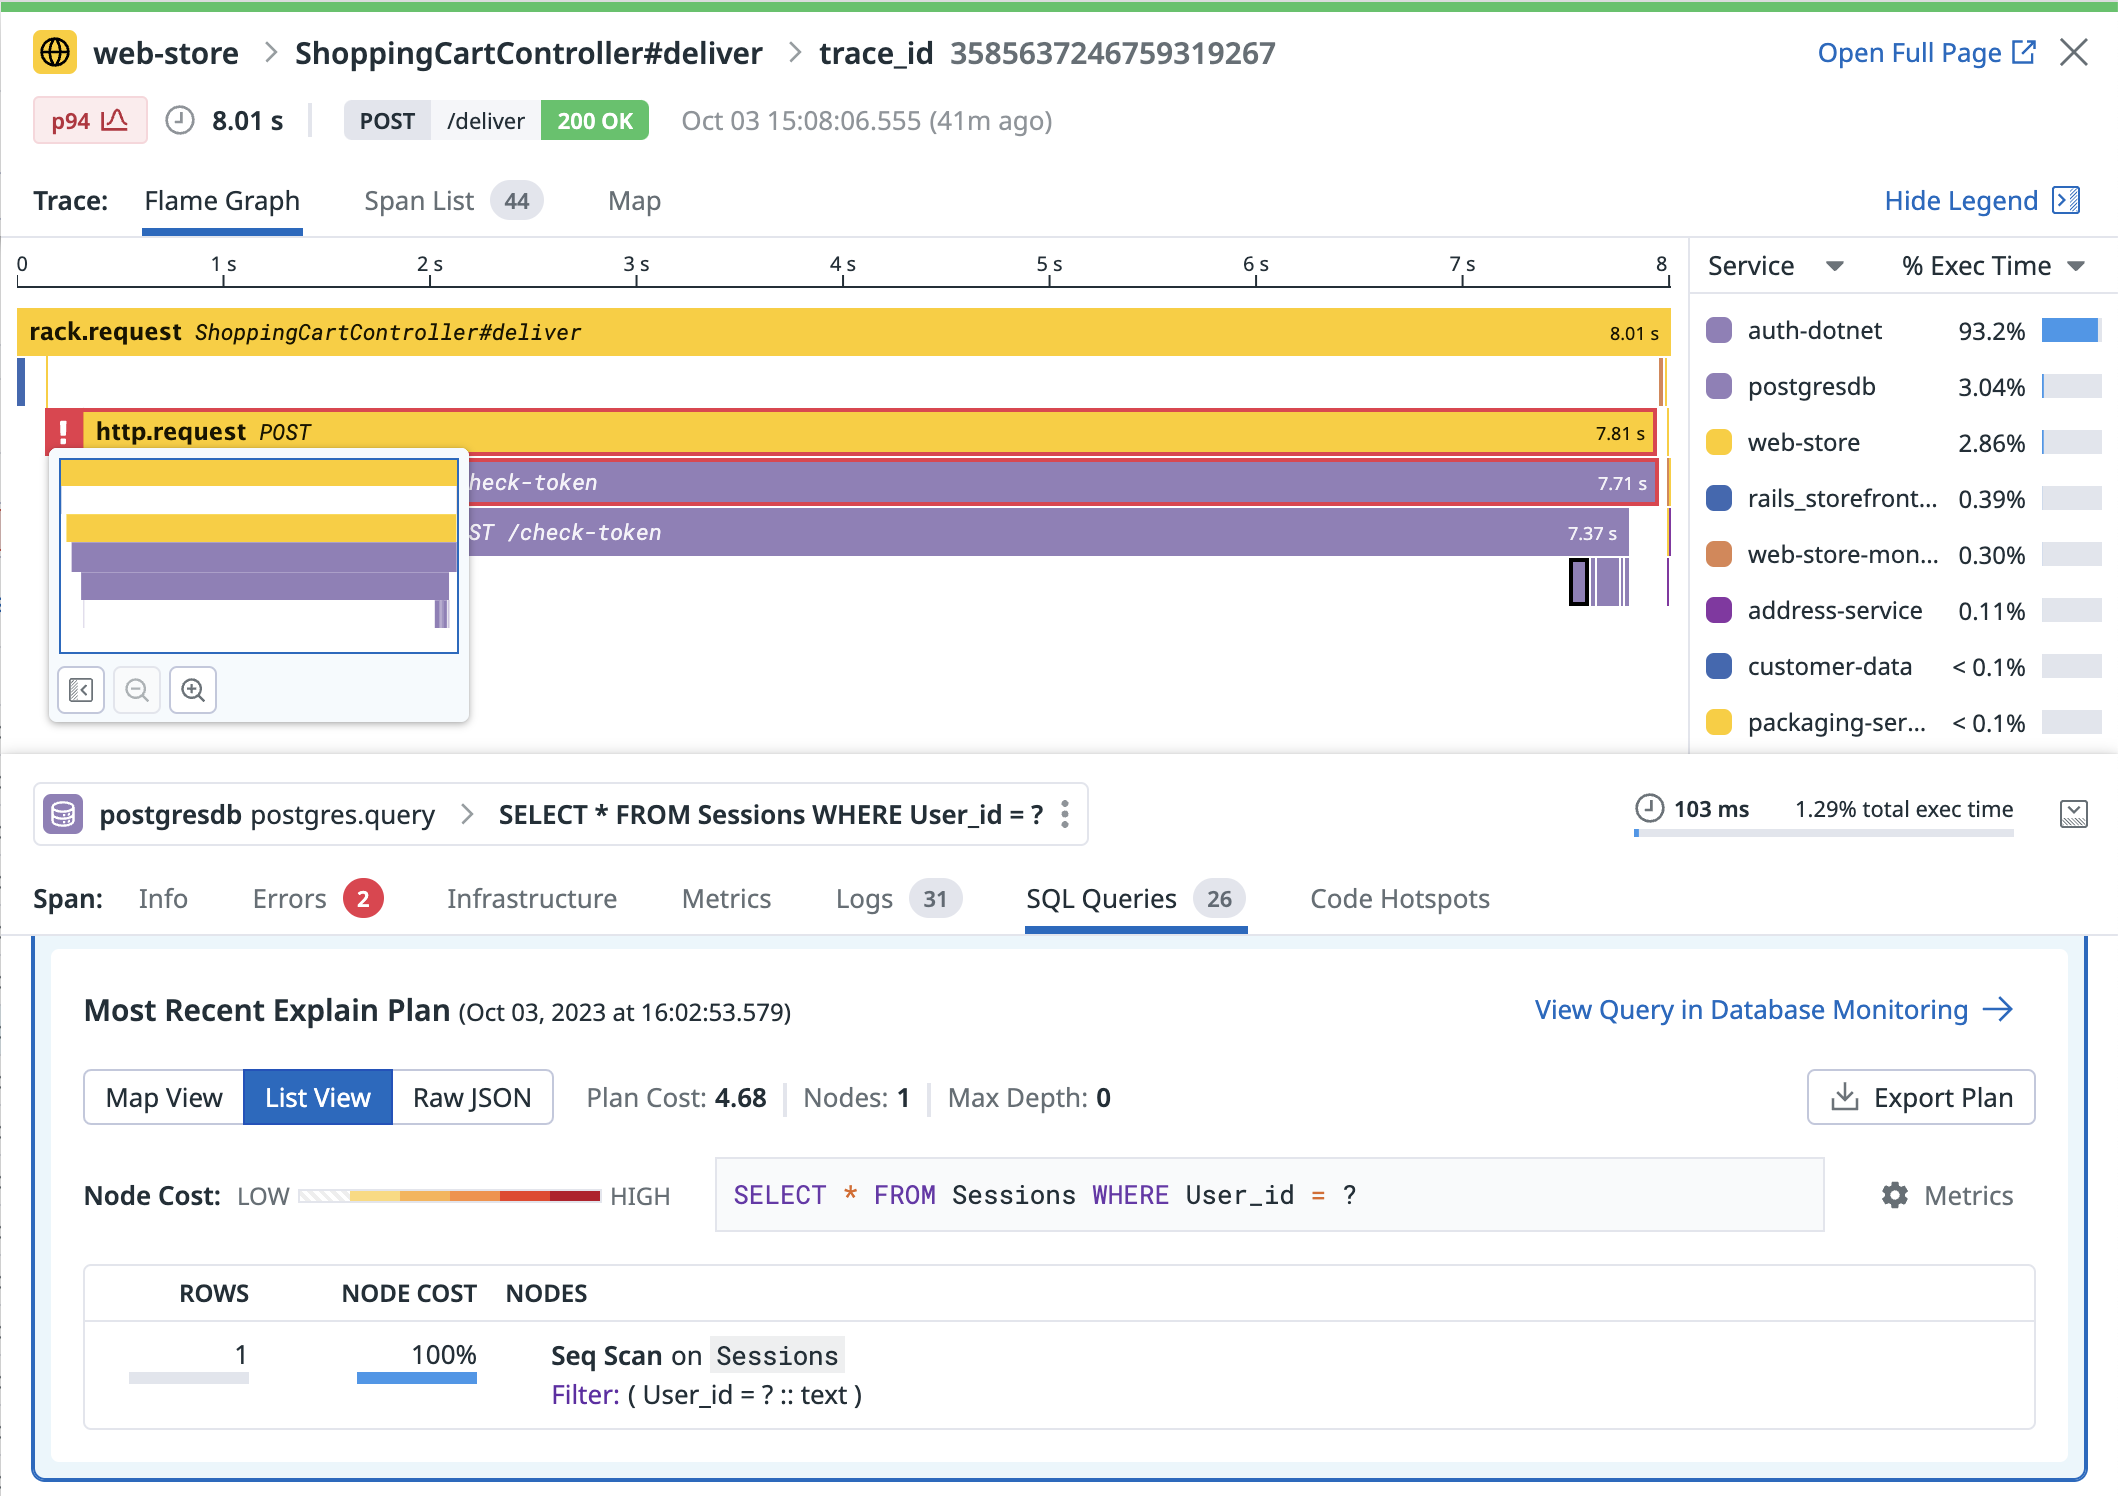
View the associated trace for a query sample
When viewing a Query Sample in Database Monitoring, if the associated trace has been sampled by APM, you can view the DBM Sample in the context of the APM Trace. This allows you to combine DBM telemetry, including the explain plan and historical performance of the query, alongside the lineage of the span within your infrastructure to understand if a change on the database is responsible for poor application performance.
Explore the DBM Connection in APM
Visualize the downstream database hosts of APM services
On the APM page for a given service, view the direct downstream database dependencies of the service as identified by Database Monitoring, and determine if any hosts have disproportionate load that may be caused by noisy neighbors. To view a service’s database dependencies:
- Select the service in the Software Catalog to open a details panel.
- Select Service Page in the panel.
- On the Service page, select the Databases section.
- Within the Databases section, select the Databases tab.
Visualize span durations and view query details
Select the Queries tab from the Databases section on the APM service page to view latency outliers and a full list of queries from the selected time interval. Select a query in the table to view the query panel and access diagnostics, error details, and trace information.
Identify potential optimizations using explain plans for database queries in traces
View historical performance of similar queries to those executed in your trace, including sampled wait events, average latency, and recently captured explain plans, to contextualize how a query is expected to perform. Determine if the behavior is abnormal and continue the investigation by pivoting to Database Monitoring for additional context about the underlying database hosts.
Further Reading
Additional helpful documentation, links, and articles:


