For AI agents: A markdown version of this page is available at https://docs.datadoghq.com/data_streams/setup/technologies/kafka.md.
A documentation index is available at /llms.txt.
*Spring Boot 3.3.x and spring-kafka 3.2.x use kafka-clients 3.7.x, which does not support lag generation. To resolve this, update your kafka-clients version to 3.8.0 or newer.
Kafka Streams is partially supported for Java, and can lead to latency measurements being missed.
Supported Kafka deployments
Instrumenting your consumers and producers with Data Streams Monitoring allows you to view your topology and track your pipelines with ready-to-go metrics independently of how Kafka is deployed. Additionally, the following Kafka deployments have further integration support, providing more insights into the health of your Kafka cluster:
Data Streams Monitoring uses message headers to propagate context through Kafka streams. If log.message.format.version is set in the Kafka broker configuration, it must be set to 0.11.0.0 or higher. Data Streams Monitoring is not supported for versions lower than this.
Monitoring connectors
Confluent Cloud connectors
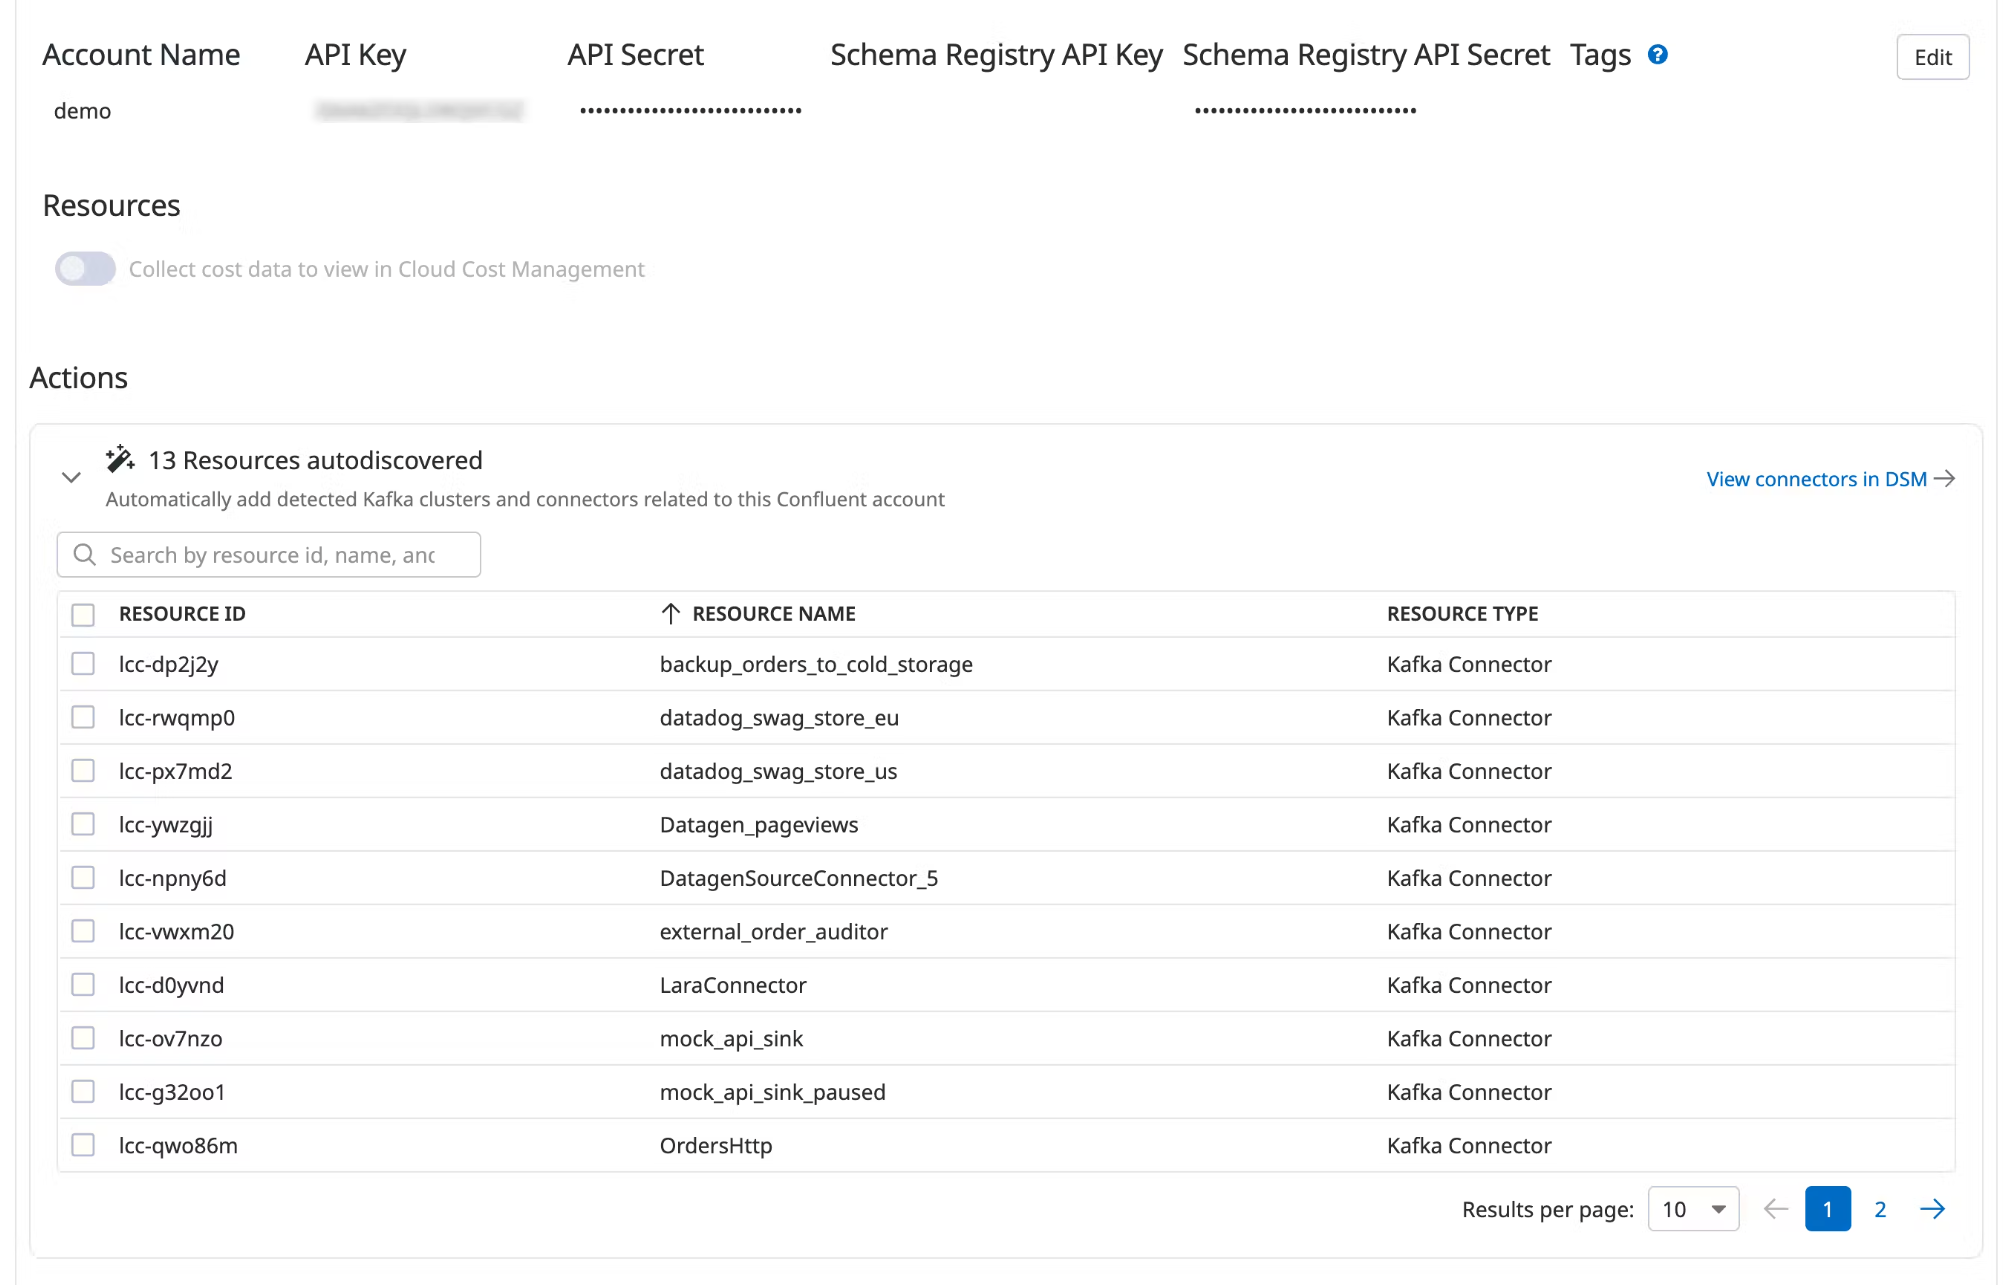
Data Streams Monitoring can automatically discover your Confluent Cloud connectors and visualize them within the context of your end-to-end streaming data pipeline.
Under Actions, a list of resources populates with detected clusters and connectors. Datadog attempts to discover new connectors every time you view this integration tile.
Select the resources you want to add.
Click Add Resources.
Navigate to Data Streams Monitoring to visualize the connectors and track connector status and throughput.
Data Streams Monitoring can collect information from your self-hosted Kafka connectors. In Datadog, these connectors are shown as services connected to Kafka topics. Datadog collects throughput to and from all Kafka topics. Datadog does not collect connector status or sinks and sources from self-hosted Kafka connectors.
Setup
Ensure that the Datadog Agent is running on your Kafka Connect workers.
Ensure that dd-trace-java is installed on your Kafka Connect workers.
Modify your Java options to include dd-trace-java on your Kafka Connect worker nodes. For example, on Strimzi, modify STRIMZI_JAVA_OPTS to add -javaagent:/path/to/dd-java-agent.jar.
1
2
rulesets:- %!s(<nil>) # Rules to enforce .
Request a personalized demo
Get Started with Datadog
Ask AI
AI-generated responses may be inaccurate. Verify important info.