*Spring Boot 3.3.x and spring-kafka 3.2.x use kafka-clients 3.7.x, which does not support lag generation. To resolve this, update your kafka-clients version to 3.8.0 or newer.
Installation
To enable Data Streams Monitoring, set the following environment variables to true on services that are sending or consuming messages:
To set up Data Streams Monitoring from the Datadog UI without needing to restart your service, use Configuration at Runtime. Navigate to the APM Service Page and Enable DSM.
Setup
Use Datadog’s Java tracer, dd-trace-java, to collect information from your Kafka Connect workers.
Modify your Java options to include the Datadog Java tracer on your worker nodes. For example, on Strimzi, modify STRIMZI_JAVA_OPTS to add -javaagent:/path/to/dd-java-agent.jar.
Monitoring SQS pipelines
Data Streams Monitoring uses one message attribute to track a message’s path through an SQS queue. As Amazon SQS has a maximum limit of 10 message attributes allowed per message, all messages streamed through the data pipelines must have 9 or fewer message attributes set, allowing the remaining attribute for Data Streams Monitoring.
Monitoring RabbitMQ pipelines
The RabbitMQ integration can provide detailed monitoring and metrics of your RabbitMQ deployments. For full compatibility with Data Streams Monitoring, Datadog recommends configuring the integration as follows:
There are no message attributes in Kinesis to propagate context and track a message’s full path through a Kinesis stream. As a result, Data Streams Monitoring’s end-to-end latency metrics are approximated based on summing latency on segments of a message’s path, from the producing service through a Kinesis Stream, to a consumer service. Throughput metrics are based on segments from the producing service through a Kinesis Stream, to the consumer service. The full topology of data streams can still be visualized through instrumenting services.
Manual instrumentation
Data Streams Monitoring propagates context through message headers. If you are using a message queue technology that is not supported by DSM, a technology without headers (such as Kinesis), or Lambdas, use manual instrumentation to set up DSM.
Monitoring connectors
Confluent Cloud connectors
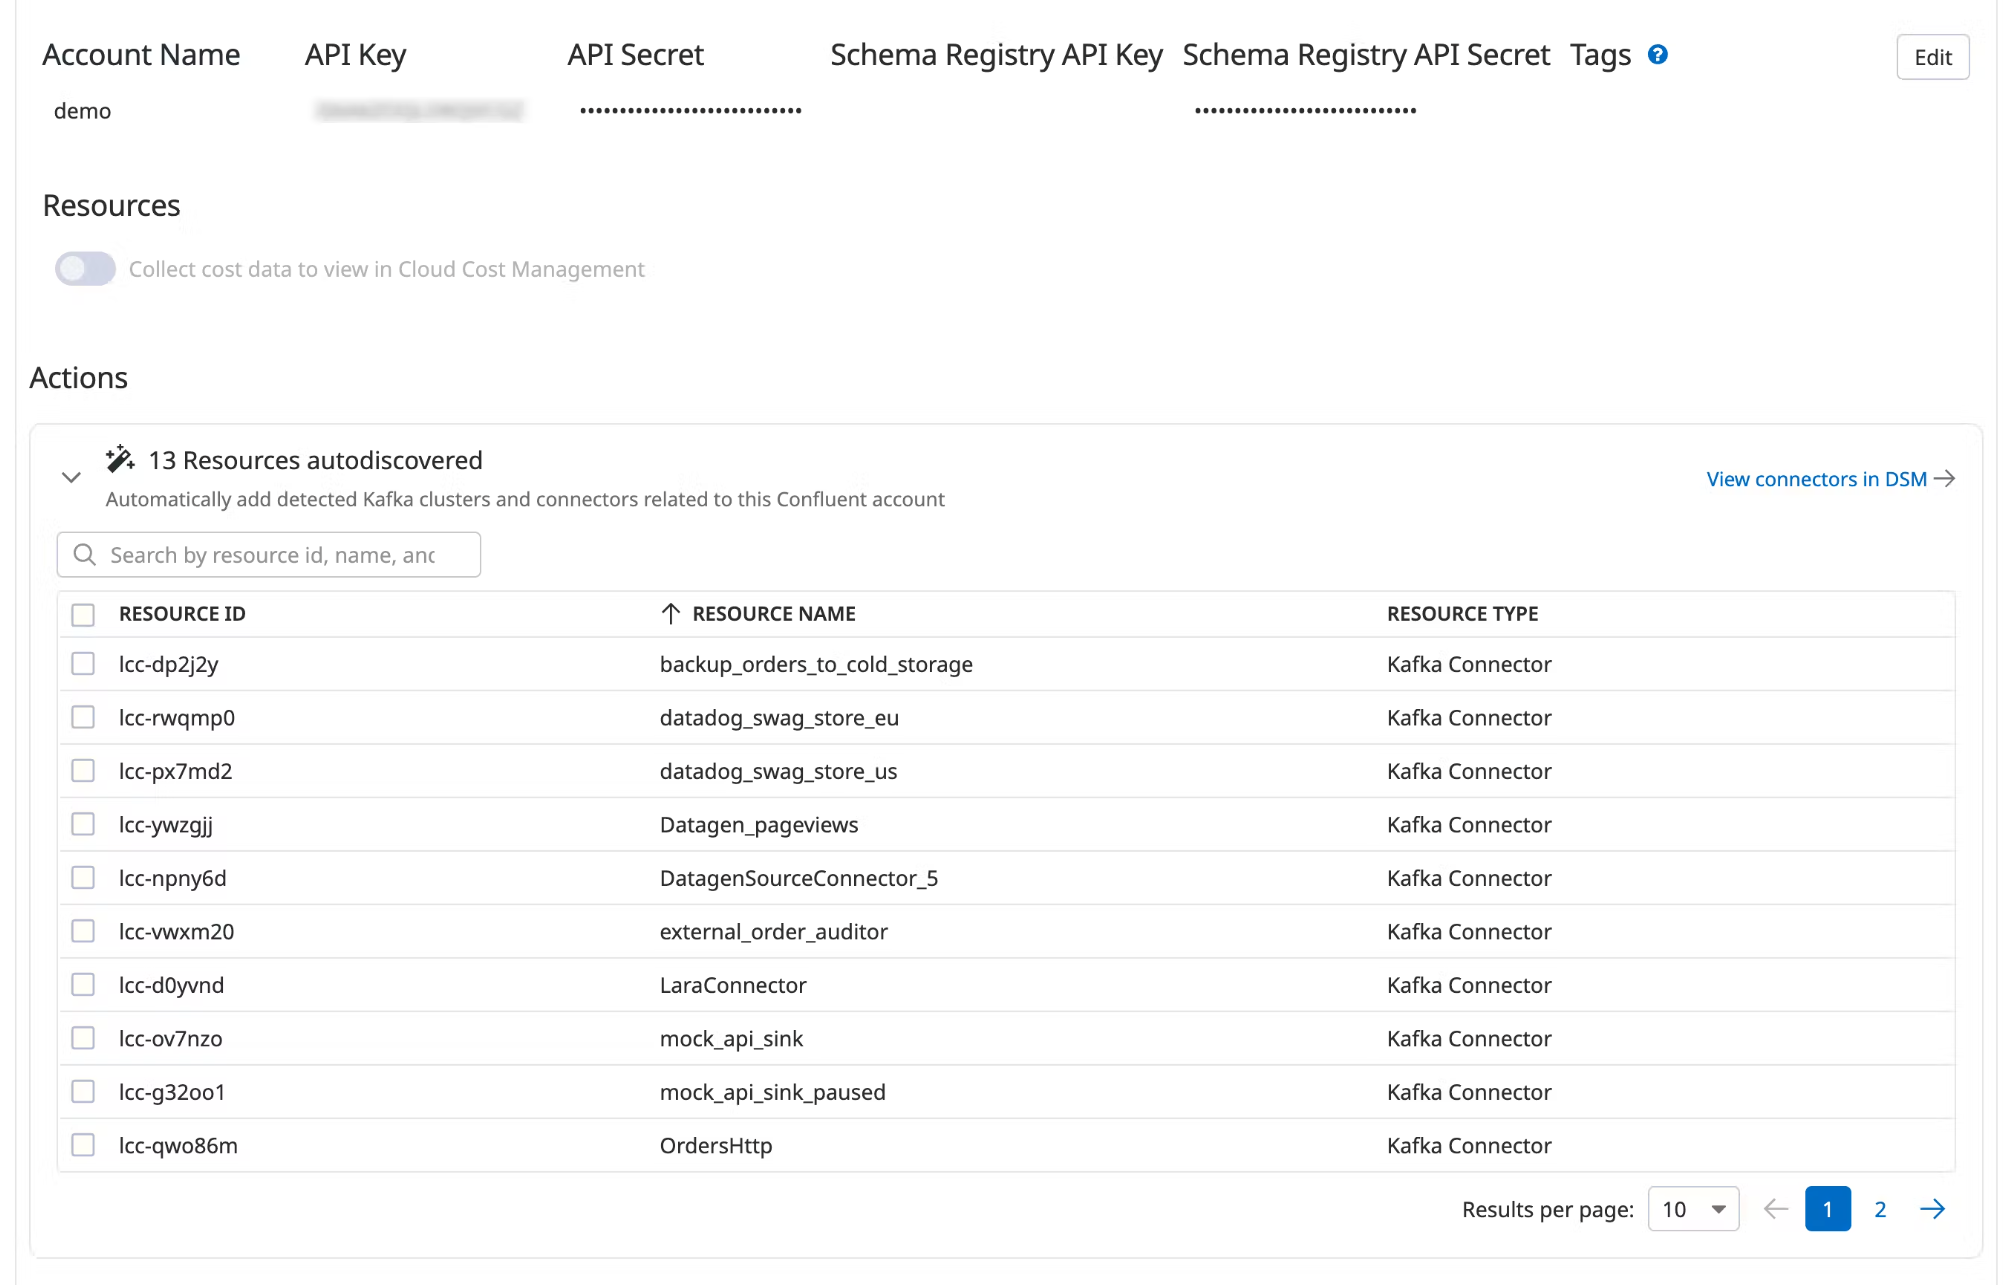
Data Streams Monitoring can automatically discover your Confluent Cloud connectors and visualize them within the context of your end-to-end streaming data pipeline.
Under Actions, a list of resources populates with detected clusters and connectors. Datadog attempts to discover new connectors every time you view this integration tile.
Select the resources you want to add.
Click Add Resources.
Navigate to Data Streams Monitoring to visualize the connectors and track connector status and throughput.
Data Streams Monitoring can collect information from your self-hosted Kafka connectors. In Datadog, these connectors are shown as services connected to Kafka topics. Datadog collects throughput to and from all Kafka topics. Datadog does not collect connector status or sinks and sources from self-hosted Kafka connectors.
Setup
Ensure that the Datadog Agent is running on your Kafka Connect workers.
Ensure that dd-trace-java is installed on your Kafka Connect workers.
Modify your Java options to include dd-trace-java on your Kafka Connect worker nodes. For example, on Strimzi, modify STRIMZI_JAVA_OPTS to add -javaagent:/path/to/dd-java-agent.jar.
Further reading
Additional helpful documentation, links, and articles: