- Agents
- Essentials
- Getting Started
- Agent
- API
- APM Tracing
- Containers
- Dashboards
- Database Monitoring
- Datadog
- Datadog Site
- DevSecOps
- Incident Management
- Integrations
- Internal Developer Portal
- Logs
- Monitors
- Notebooks
- OpenTelemetry
- Profiler
- Search
- Session Replay
- Security
- Serverless for AWS Lambda
- Software Delivery
- Synthetic Monitoring and Testing
- Tags
- Workflow Automation
- Learning Center
- Support
- Glossary
- Standard Attributes
- Guides
- Agent
- Integrations
- Extend Datadog
- Authorization
- DogStatsD
- Custom Checks
- Integrations
- Build an Integration with Datadog
- Create an Agent-based Integration
- Create an API-based Integration
- Create a Log Pipeline
- Integration Assets Reference
- Build a Marketplace Offering
- Create an Integration Dashboard
- Create a Monitor Template
- Create a Cloud SIEM Detection Rule
- Install Agent Integration Developer Tool
- Service Checks
- Community
- Guides
- OpenTelemetry
- Administrator's Guide
- API
- Partners
- Datadog Mobile App
- DDSQL Reference
- CoScreen
- CoTerm
- Remote Configuration
- Cloudcraft (Standalone)
- In The App
- Dashboards
- Notebooks
- DDSQL Editor
- Reference Tables
- Sheets
- Monitors and Alerting
- Service Level Objectives
- Metrics
- Watchdog
- Bits AI
- Internal Developer Portal
- Error Tracking
- Change Tracking
- Event Management
- Incident Response
- Actions & Remediations
- Infrastructure
- Cloudcraft
- Resource Catalog
- Universal Service Monitoring
- End User Device Monitoring
- Hosts
- Containers
- Processes
- Serverless
- Network Monitoring
- Storage Management
- Cloud Cost
- Application Performance
- APM
- Continuous Profiler
- Database Monitoring
- Agent Integration Overhead
- Setup Architectures
- Setting Up Postgres
- Setting Up MySQL
- Setting Up SQL Server
- Setting Up Oracle
- Setting Up Amazon DocumentDB
- Setting Up MongoDB
- Setting Up ClickHouse
- Connecting DBM and Traces
- Data Collected
- Exploring Database Hosts
- Exploring Query Metrics
- Exploring Query Samples
- Exploring Database Schemas
- Exploring Recommendations
- Troubleshooting
- Guides
- Data Streams Monitoring
- Data Observability
- Digital Experience
- Real User Monitoring
- Synthetic Testing and Monitoring
- Continuous Testing
- Experiments
- Product Analytics
- Session Replay
- Software Delivery
- CI Visibility
- CD Visibility
- Deployment Gates
- Test Optimization
- Code Coverage
- PR Gates
- DORA Metrics
- Feature Flags
- Developer Integrations
- Security
- Security Overview
- Cloud SIEM
- Code Security
- Cloud Security
- App and API Protection
- AI Guard
- Workload Protection
- Sensitive Data Scanner
- AI Observability
- Log Management
- Observability Pipelines
- Configuration
- Sources
- Processors
- Destinations
- Amazon OpenSearch
- Amazon S3
- Amazon Security Lake
- Azure Storage
- CrowdStrike NG-SIEM
- Datadog Archives
- Datadog CloudPrem
- Datadog Logs
- Datadog Metrics
- Elasticsearch
- Google Cloud Storage
- Google Pub/Sub
- Google SecOps
- HTTP Client
- Kafka
- Microsoft Sentinel
- New Relic
- OpenSearch
- SentinelOne
- Socket
- Splunk HEC
- Sumo Logic Hosted Collector
- Syslog
- Packs
- Akamai CDN
- Amazon CloudFront
- Amazon VPC Flow Logs
- AWS Application Load Balancer Logs
- AWS CloudTrail
- AWS Elastic Load Balancer Logs
- AWS Network Load Balancer Logs
- Cisco ASA
- Cloudflare
- F5
- Fastly
- Fortinet Firewall
- HAProxy Ingress
- Istio Proxy
- Juniper SRX Firewall Traffic Logs
- Netskope
- NGINX
- Okta
- Palo Alto Firewall
- Windows XML
- ZScaler ZIA DNS
- Zscaler ZIA Firewall
- Zscaler ZIA Tunnel
- Zscaler ZIA Web Logs
- Search Syntax
- Scaling and Performance
- Monitoring and Troubleshooting
- Guides and Resources
- Log Management
- CloudPrem
- Administration
Enable Data Observability: Jobs Monitoring for Databricks
This product is not supported for your selected Datadog site. ().
Data Observability: Jobs Monitoring gives visibility into the performance and reliability of your Databricks jobs and workflows running on clusters or serverless compute.
Setup
Databricks Networking Restrictions can block some Datadog functions. Add the following Datadog IP ranges to your allow-list: webhook IPs, API IPs.
Follow these steps to enable Data Observability: Jobs Monitoring for Databricks.
- Configure the Datadog-Databricks integration for a Databricks workspace.
- Install the Datadog Agent on your Databricks cluster(s) in the workspace.
Configure the Datadog-Databricks integration
New workspace integrations must authenticate using OAuth. Workspaces already integrated with a Personal Access Token continue to function and can switch to OAuth at any time. After a workspace starts using OAuth, it cannot revert to a Personal Access Token.
Create and configure the service principal in Databricks
As a Databricks workspace admin, go to Settings by clicking your profile in the upper-right corner of the workspace.
On the Identity and access tab, click Manage next to Service principals.
Click Add service principal, then click Add new.
Enter a name, then click Add.
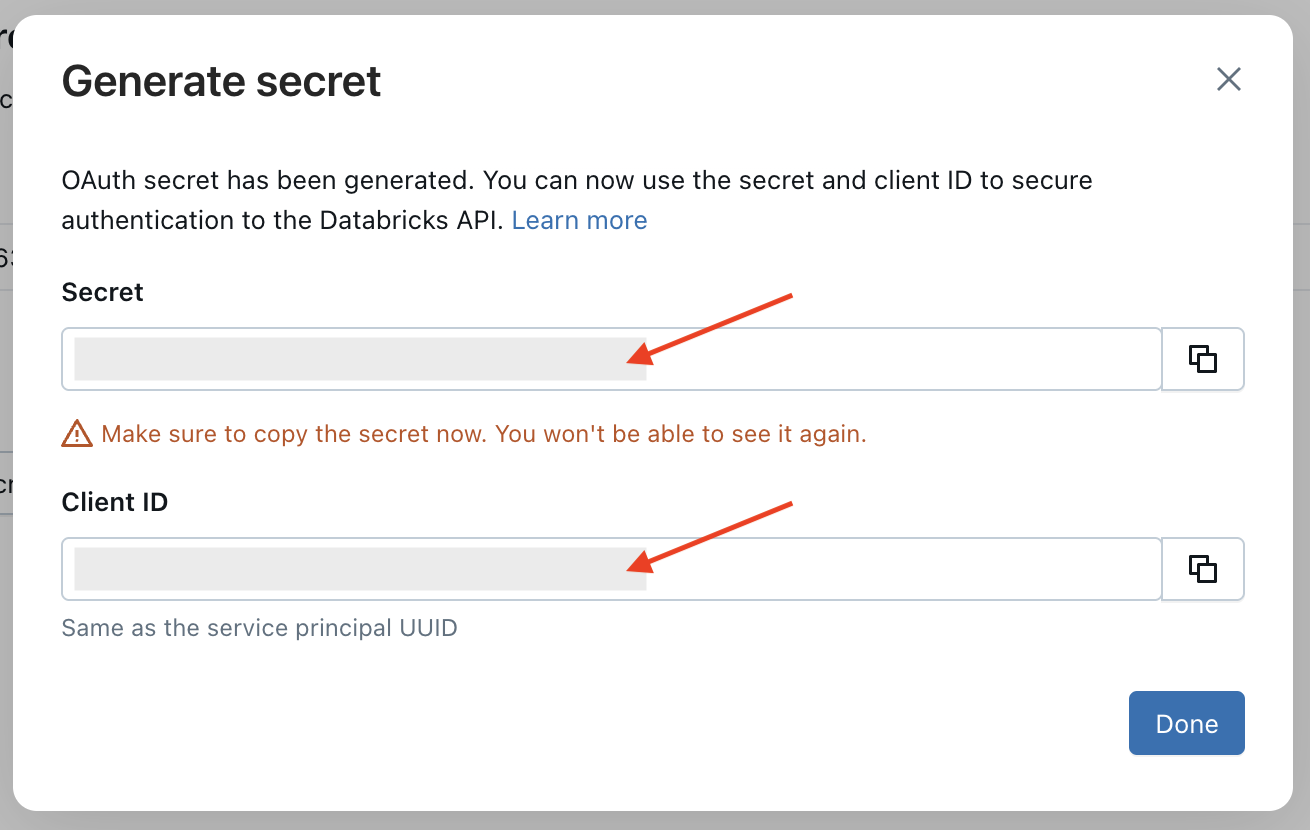
For Azure Databricks, select the "Databricks managed" management type. Datadog does NOT support "Microsoft Entra ID managed" service principals.Click on the name of your new service principal. Under the Secrets tab, click Generate secret.
Set Lifetime (days) to the maximum value allowed (730).
Click Generate.
Take note of your client ID and client secret.
On the Permissions tab, click Grant access. Search for the new service principal, grant it the Manage permission, and click Save.
Return to the Identity and access tab and click Manage next to Groups.
Click the admins group, then click Add members to add the new service principal.
Add the Databricks workspace to Datadog
In Datadog, open the Databricks integration tile.
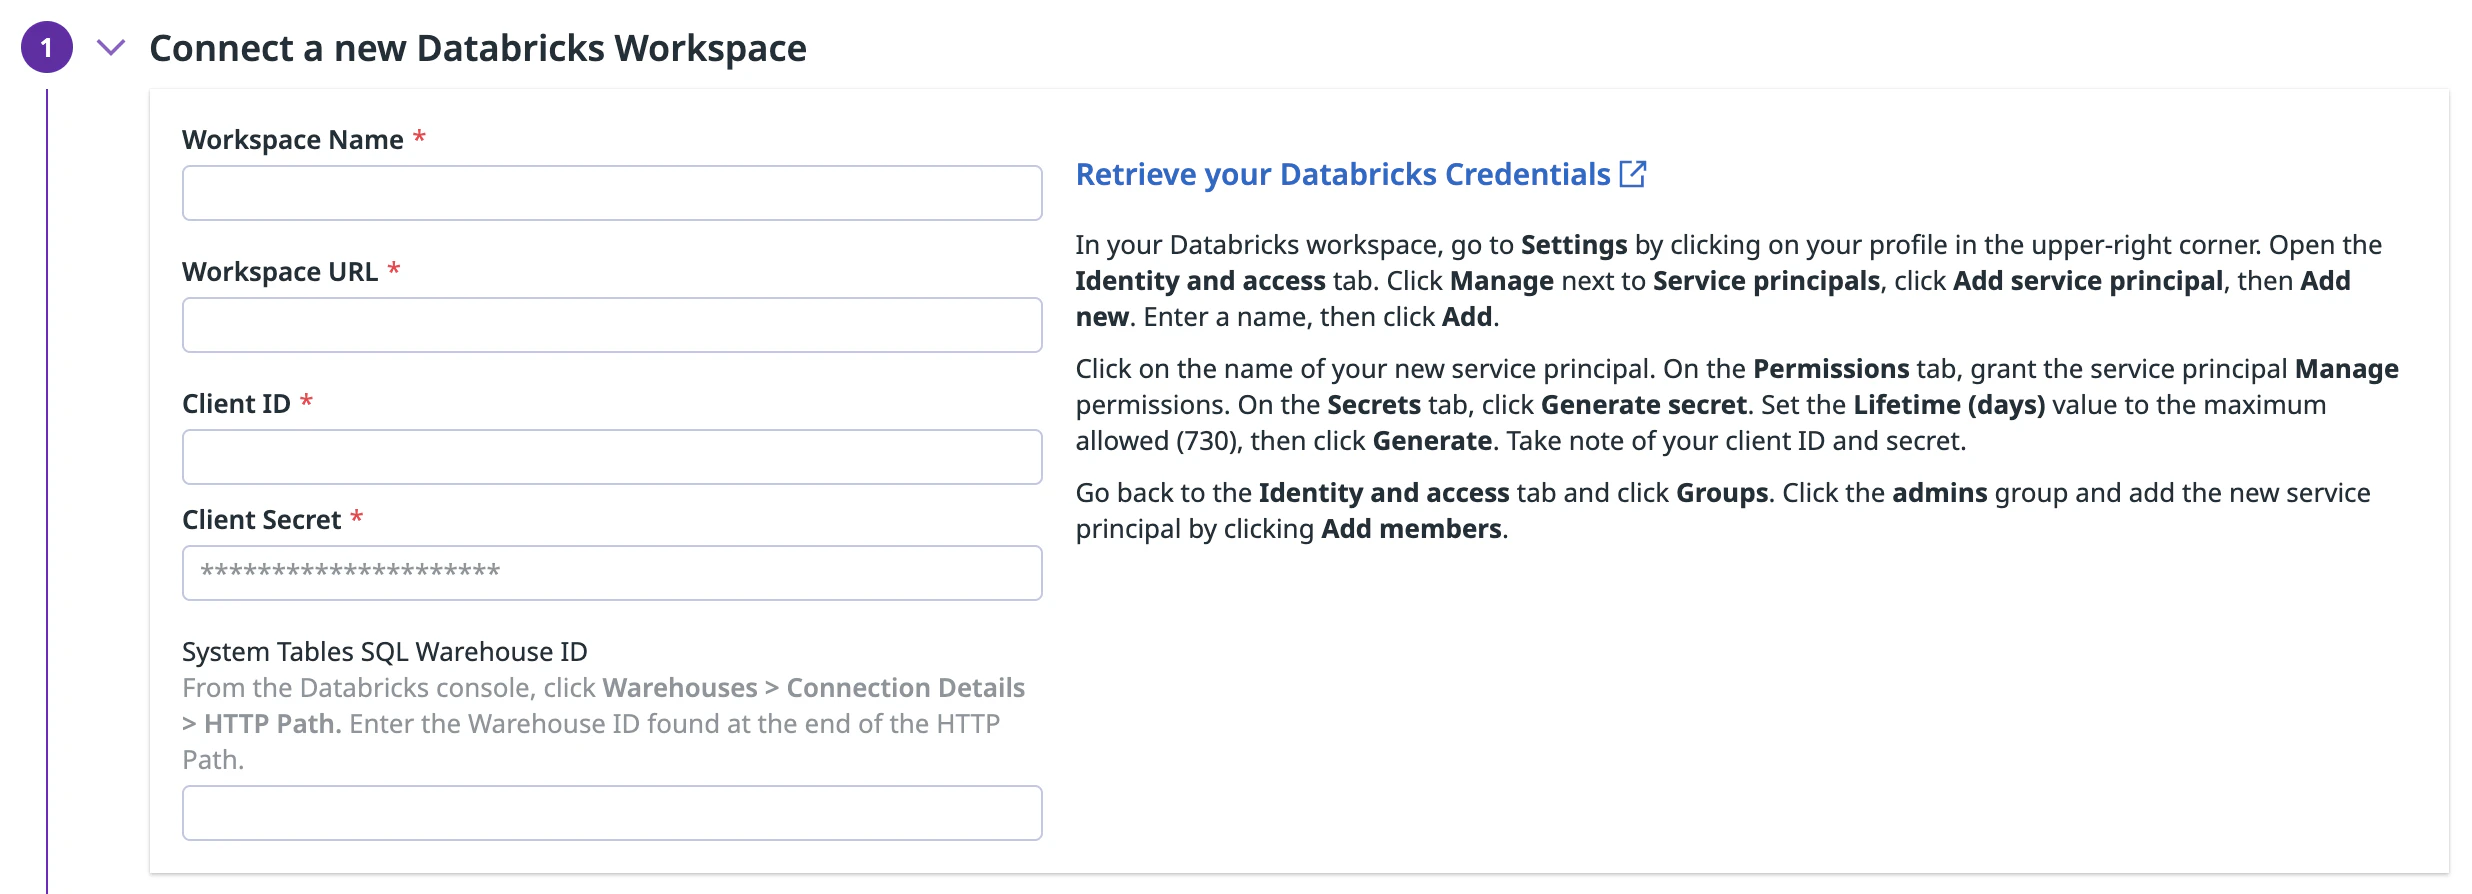
On the Configure tab, click Add Databricks Workspace.
Enter a workspace name, your Databricks workspace URL, and the client ID and secret you generated.
To gain visibility into your Databricks costs in Data Observability: Jobs Monitoring or Cloud Cost Management, provide the ID of a Databricks SQL Warehouse that Datadog can use to query your system tables.
- The service principal must have access to the SQL Warehouse. In the Warehouse configuration page, go to Permissions (top right) and grant it
CAN USEpermission. - Grant the service principal read access to the Unity Catalog system tables by running the following commands:
GRANT USE CATALOG ON CATALOG system TO <service_principal>;
GRANT SELECT ON CATALOG system TO <service_principal>;
GRANT USE SCHEMA ON CATALOG system TO <service_principal>;
The user granting these must have
MANAGEprivilege onCATALOG system.- The SQL Warehouse must be Pro or Serverless. Classic Warehouses are NOT supported. A 2XS warehouse is recommended, with Auto Stop set to 5-10 minutes to reduce cost.
- The service principal must have access to the SQL Warehouse. In the Warehouse configuration page, go to Permissions (top right) and grant it
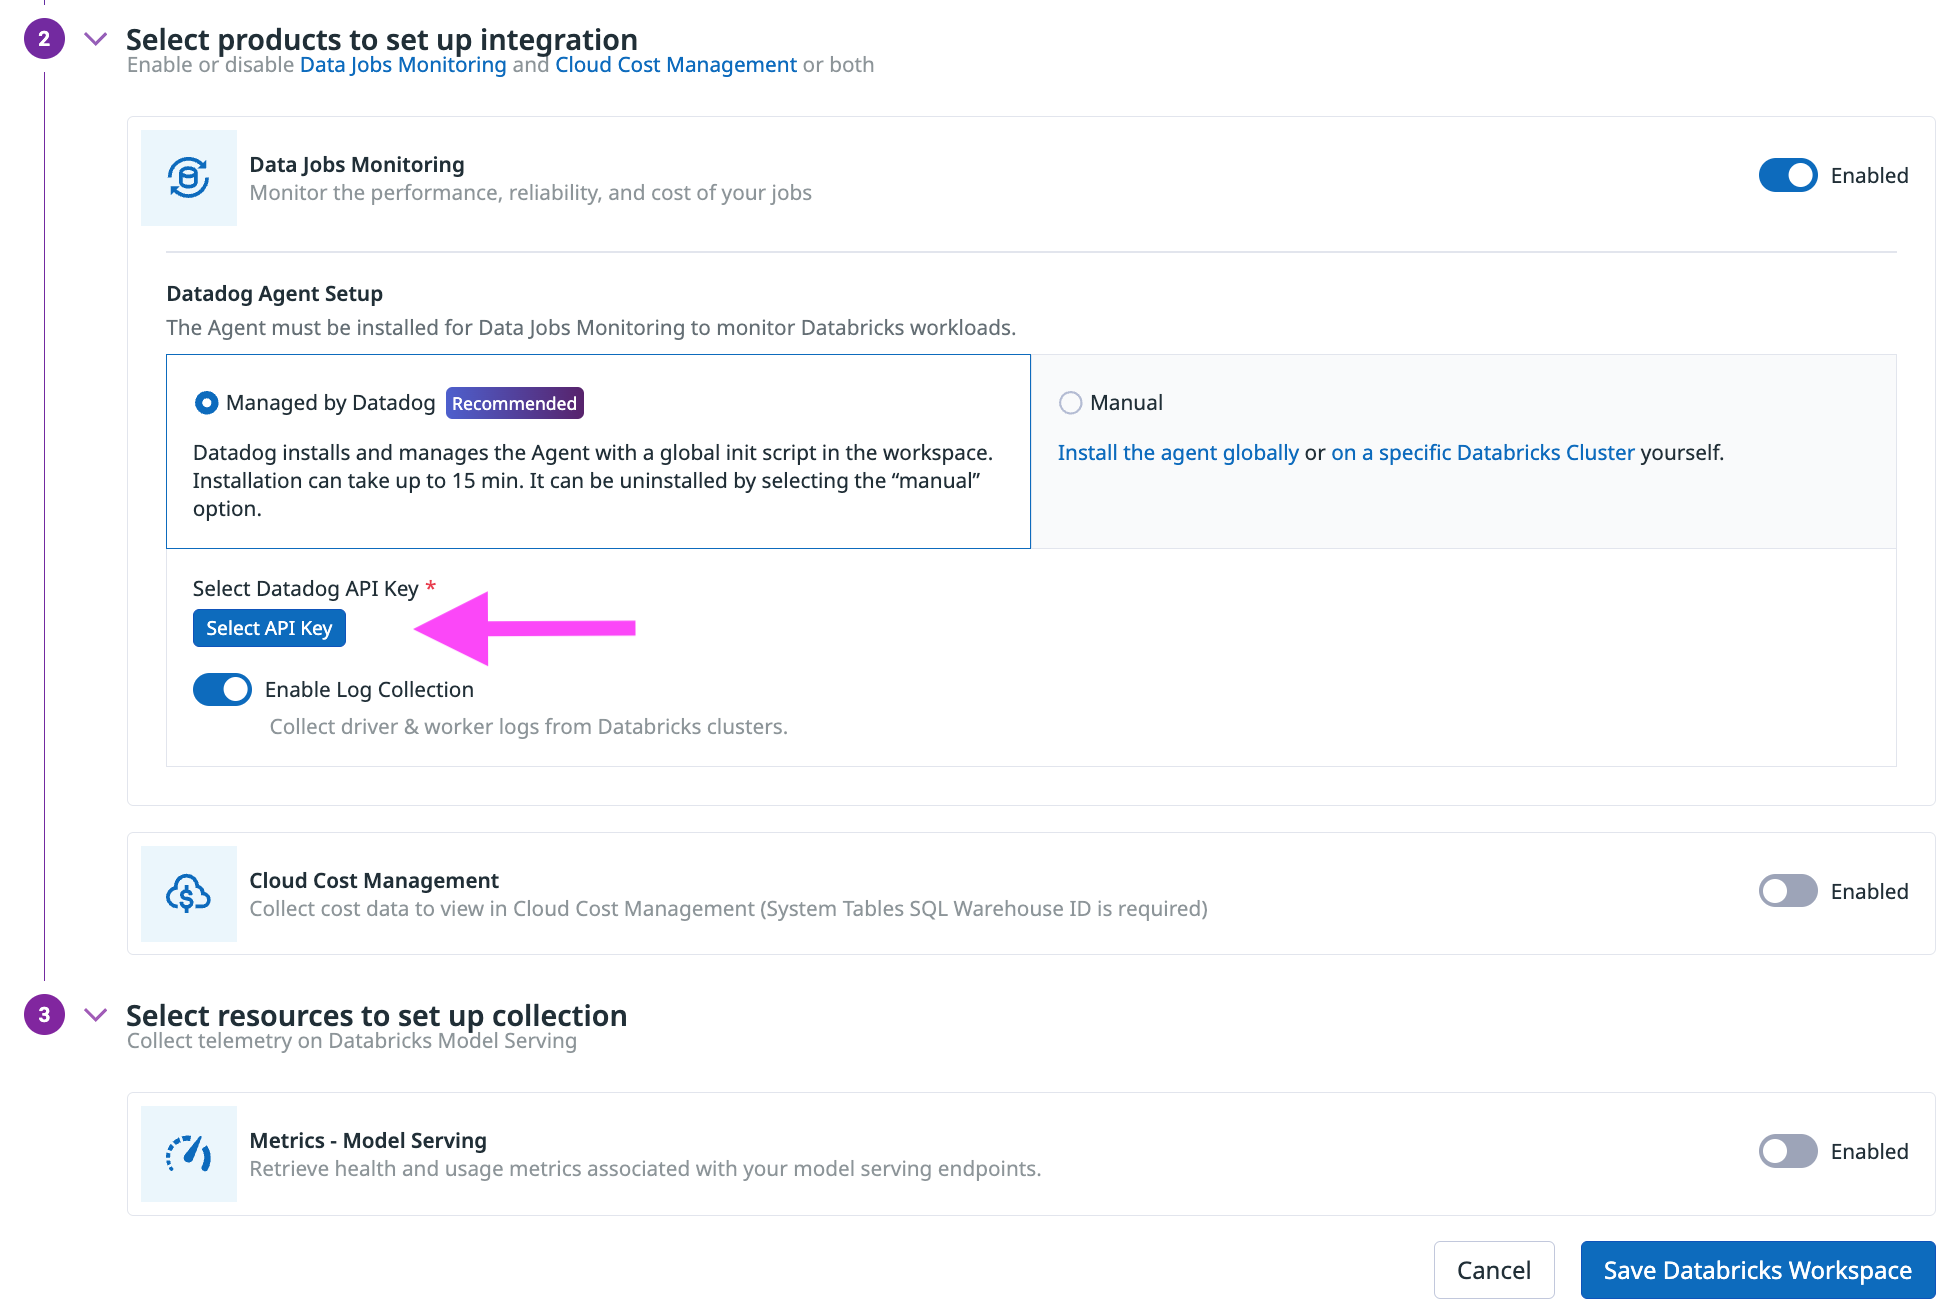
In the Select products to set up integration section, ensure that Data Observability: Jobs Monitoring is Enabled.
In the Datadog Agent Setup section, choose either
- Managed by Datadog (recommended): Datadog installs and manages the Agent with a global init script in the workspace.
- Manually: Follow the instructions below to install and manage the init script for installing the Agent globally or on specific Databricks clusters.
This option is only available for workspace integrations created before July 7, 2025. New workspace integrations must authenticate using OAuth.
In your Databricks workspace, click on your profile in the top right corner and go to Settings. Select Developer in the left side bar. Next to Access tokens, click Manage.
Click Generate new token, enter “Datadog Integration” in the Comment field, set the Lifetime (days) value to the maximum allowed (730 days), and create a reminder to update the token before it expires. Then click Generate. Take note of your token.
Important:
- For the Datadog managed init script install (recommended), ensure the token’s Principal is a Workspace Admin.
- For manual init script installation, ensure the token’s Principal has CAN VIEW access for the Databricks jobs and clusters you want to monitor.
As an alternative, follow the official Databricks documentation to generate an access token for a service principal. The service principal must have the Workspace access entitlement enabled and the Workspace Admin or CAN VIEW access permissions as described above.
In Datadog, open the Databricks integration tile.
On the Configure tab, click Add Databricks Workspace.
Enter a workspace name, your Databricks workspace URL, and the Databricks token you generated.
To gain visibility into your Databricks costs in Data Observability: Jobs Monitoring or Cloud Cost Management, provide the ID of a Databricks SQL Warehouse that Datadog can use to query your system tables.
- The token’s principal must have access to the SQL Warehouse. Give it
CAN USEpermission from Permissions at the top right of the Warehouse configuration page. - Grant the service principal read access to the Unity Catalog system tables by running the following commands::
GRANT USE CATALOG ON CATALOG system TO <token_principal>;
GRANT SELECT ON CATALOG system TO <token_principal>;
GRANT USE SCHEMA ON CATALOG system TO <token_principal>;
The user granting these must have
MANAGEprivilege onCATALOG system.- The SQL Warehouse must be Pro or Serverless. Classic Warehouses are NOT supported. A 2XS size warehouse is recommended, with Auto Stop configured for 5-10 minutes to minimize cost.
- The token’s principal must have access to the SQL Warehouse. Give it
In the Select products to set up integration section, make sure the Data Observability: Jobs Monitoring product is Enabled.
In the Datadog Agent Setup section, choose either
- Managed by Datadog (recommended): Datadog installs and manages the Agent with a global init script in the workspace.
- Manually: Follow the instructions below to install and manage the init script for installing the Agent globally or on specific Databricks clusters.
Install the Datadog Agent
The Datadog Agent must be installed on Databricks clusters to monitor Databricks jobs that run on all-purpose or job clusters. This step is not required to monitor jobs on serverless compute.
Datadog can install and manage a global init script in the Databricks workspace. The Datadog Agent is installed on all clusters in the workspace, when they start.
- This setup does not work on Databricks clusters in Standard access mode, because global init scripts cannot be installed on those clusters. If you are using clusters with the Standard access mode, Datadog recommends to Manually configure a cluster policy across multiple clusters or Manually install on a specific cluster.
- This install option, in which Datadog installs and manages your Datadog global init script, requires a Databricks Access Token with Workspace Admin permissions. A token with CAN VIEW access does not allow Datadog to manage the global init script of your Databricks account.
When integrating a workspace with Datadog
In the Select products to set up integration section, make sure the Data Observability: Jobs Monitoring product is Enabled.
In the Datadog Agent Setup section, select the Managed by Datadog toggle button.
Click Select API Key to either select an existing Datadog API key or create a new Datadog API key.
(Optional) Disable Enable Log Collection if you do not want to collect driver and worker logs for correlating with jobs.
Click Save Databricks Workspace.
When adding the init script to a Databricks workspace already integrated with Datadog
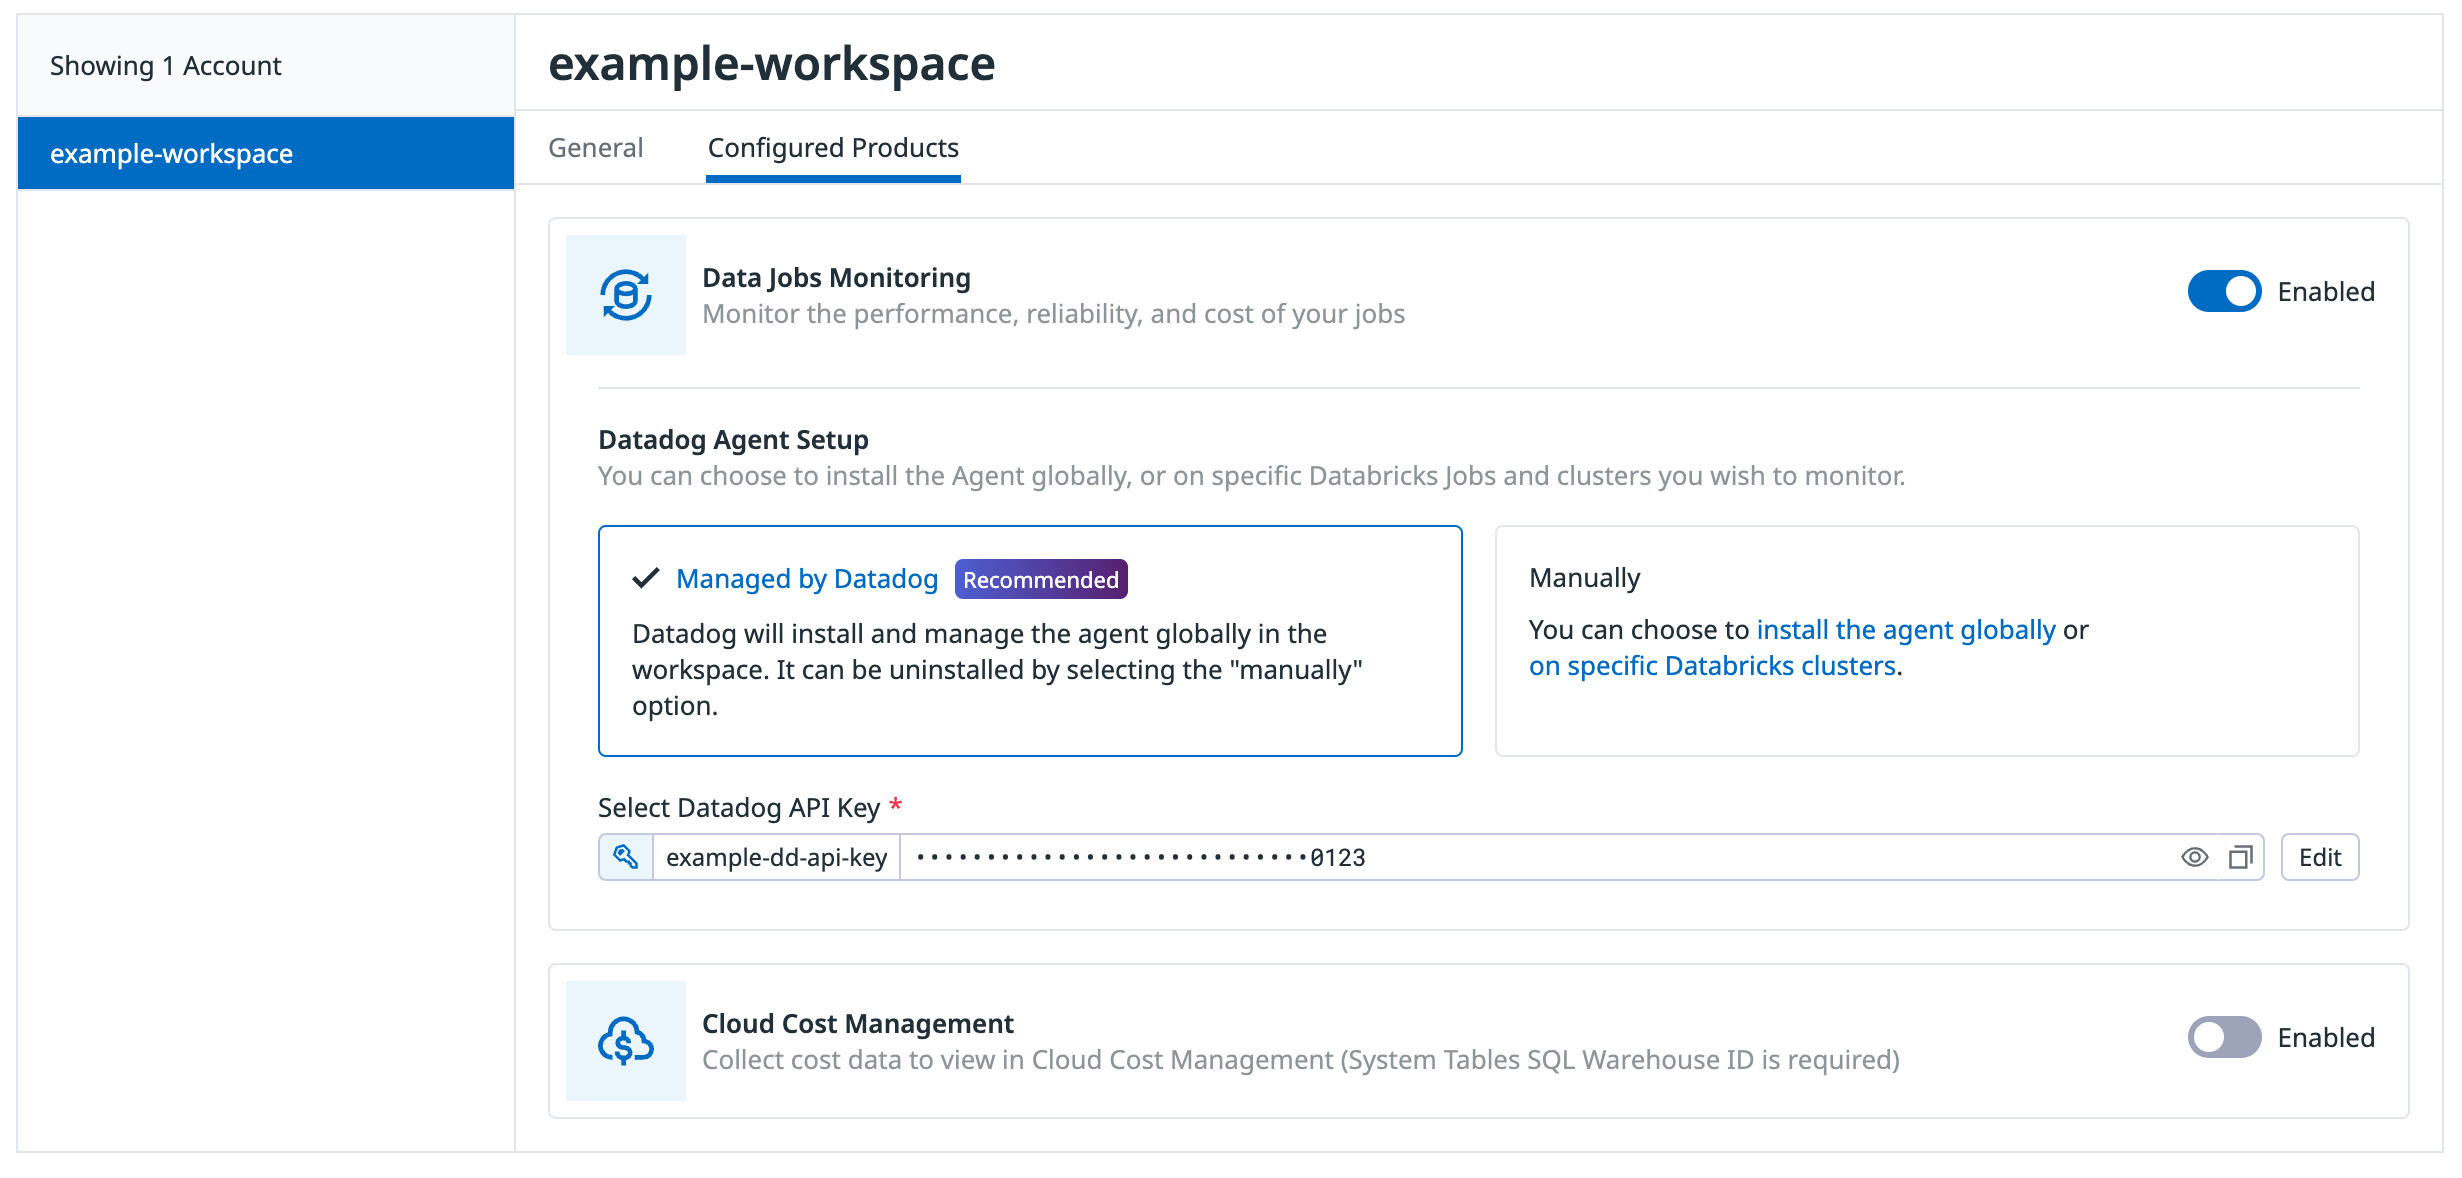
On the Configure tab, click the workspace in the list of workspaces
Click the Configured Products tab
Make sure the Data Observability: Jobs Monitoring product is Enabled.
In the Datadog Agent Setup section, select the Managed by Datadog toggle button.
Click Select API Key to either select an existing Datadog API key or create a new Datadog API key.
(Optional) Disable Enable Log Collection if you do not want to collect driver and worker logs for correlating with jobs.
Click Save Databricks Workspace at the bottom of the browser window.
Optionally, you can add tags to your Databricks cluster and Spark performance metrics by configuring the following environment variable in the Advanced Configuration section of your cluster in the Databricks UI or as Spark env vars with the Databricks API:
| Variable | Description |
|---|---|
| DD_TAGS | Add tags to Databricks cluster and Spark performance metrics. Comma or space separated key:value pairs. Follow Datadog tag conventions. Example: env:staging,team:data_engineering |
| DD_ENV | Set the env environment tag on metrics, traces, and logs from this cluster. |
| DD_LOGS_CONFIG_PROCESSING_RULES | Filter the logs collected with processing rules. See Advanced Log Collection for more details. |
This approach is recommended for clusters in Standard access mode.
Create the init script
In Databricks, create an init script file in a Unity Catalog volume with the following content. Be sure to make note of the volume path (for example,
/Volumes/catalog_name/schema_name/volume_name/datadog-init-script.sh).#!/bin/bash # Download and run the latest init script curl -L https://install.datadoghq.com/scripts/install-databricks.sh > djm-install-script bash djm-install-script || trueThe script above downloads and runs the latest init script for Data Observability: Jobs Monitoring in Databricks. If you want to pin your script to a specific version, you can replace the filename in the URL with
install-databricks-0.14.0.shto use version0.14.0, for example. The source code used to generate this script, and the changes between script versions, can be found on the Datadog Agent repository.Grant read-only permissions to the init script:
- At the volume level, grant the
READ VOLUMEpermission to all account users. - At the catalog level, grant the
USE CATALOGpermission to all account users.
- At the volume level, grant the
Add the init script to the allowlist: For clusters in Standard access mode, you must add the init script path to the Unity Catalog allowlist. Follow the instructions in the Databricks documentation to add your init script path to the allowlist.
Configure the compute policy
In Compute, navigate to the Policies tab. If you already have a cluster policy applied to your clusters, navigate to that existing policy to edit it. This is the simpler approach as the policy automatically applies to all clusters using it. Otherwise, click Create Policy to create a new policy.
To add the init script to the cluster policy, in the Definition section, click Add Definition. In the modal that opens, fill in the fields:
- In the Field dropdown, select init_scripts.
- In the Source dropdown, select Volume.
- Under Destination, enter the volume path to your init script.
- Click Add.
Configure the environment variables. You must add each of the following environment variables to the cluster policy you created:
Key Description DD_API_KEY Your Datadog API key. DD_SITE Your Datadog site. DATABRICKS_WORKSPACE Name of your Databricks Workspace. It should match the name provided in the Datadog-Databricks integration step. Enclose the name in double quotes if it contains whitespaces. - For each of the above variables, in the Definition section, click Add Definition. In the modal that opens, fill in the fields:
- In the Field dropdown, select spark_env_vars.
- In the Key field, enter the environment variable key.
- In the Value field, enter the environment variable value.
- Under the Type drop-down, select
Fixed. - Check the Hidden checkbox to reduce exposure of sensitive values.
- Optionally, set other init script parameters and Datadog environment variables, such as
DD_ENVandDD_SERVICE. You can configure the script using the following parameters:Variable Description Default DRIVER_LOGS_ENABLED Collect spark driver logs in Datadog. false WORKER_LOGS_ENABLED Collect spark workers logs in Datadog. false DD_TAGS Add tags to Databricks cluster and Spark performance metrics, using comma- or space-separated key:value pairs. Follow Datadog tag conventions. Example: env:staging,team:data_engineeringDD_ENV Set the envenvironment tag on metrics, traces, and logs from this cluster.DD_LOGS_CONFIG_PROCESSING_RULES Filter the logs collected with processing rules. See Advanced Log Collection for more details.
- For each of the above variables, in the Definition section, click Add Definition. In the modal that opens, fill in the fields:
Click Create if creating a new policy or Save if updating an existing policy. If you update an existing policy, all clusters using that policy automatically apply the changes on their next restart. If you create a new policy, follow the steps below to apply it to your clusters.
Apply the cluster policy to clusters
- In Compute, select the cluster you want to update or click Create Compute for a new cluster.
- In the Policy dropdown at the top, select the policy you created.
- Click Confirm to save the changes. The cluster needs to be restarted for the policy to take effect.
This setup does not work on Databricks clusters in Standard access mode, because global init scripts cannot be installed on those clusters. If you are using clusters with the Standard access mode, Datadog recommends to Manually configure a cluster policy or Manually install on a specific cluster.
In Databricks, click your display name (email address) in the upper right corner of the page.
Select Settings and click the Compute tab.
In the All purpose clusters section, next to Global init scripts, click Manage.
Click Add. Name your script. Then, in the Script field, copy and paste the following script, remembering to replace the placeholders with your parameter values.
#!/bin/bash

# Required parameters
export DD_API_KEY=<YOUR API KEY>
export DD_SITE=<YOUR DATADOG SITE>
export DATABRICKS_WORKSPACE="<YOUR WORKSPACE NAME>"

# Download and run the latest init script
curl -L https://install.datadoghq.com/scripts/install-databricks.sh > djm-install-script
bash djm-install-script || true
The script above sets the required parameters, and downloads and runs the latest init script for Data Observability: Jobs Monitoring in Databricks. If you want to pin your script to a specific version, you can replace the filename in the URL with
install-databricks-0.14.0.shto use version0.14.0, for example. The source code used to generate this script, and the changes between script versions, can be found on the Datadog Agent repository.To enable the script for all new and restarted clusters, toggle Enabled.
Click Add.
Set the required init script parameters
Provide the values for the init script parameters at the beginning of the global init script.
export DD_API_KEY=<YOUR API KEY>
export DD_SITE=<YOUR DATADOG SITE>
export DATABRICKS_WORKSPACE="<YOUR WORKSPACE NAME>"
Optionally, you can also set other init script parameters and Datadog environment variables here, such as DD_ENV and DD_SERVICE. The script can be configured using the following parameters:
| Variable | Description | Default |
|---|---|---|
| DD_API_KEY | Your Datadog API key. | |
| DD_SITE | Your Datadog site. | |
| DATABRICKS_WORKSPACE | Name of your Databricks Workspace. It should match the name provided in the Datadog-Databricks integration step. Enclose the name in double quotes if it contains whitespace. | |
| DRIVER_LOGS_ENABLED | Collect spark driver logs in Datadog. | false |
| WORKER_LOGS_ENABLED | Collect spark workers logs in Datadog. | false |
| DD_TAGS | Add tags to Databricks cluster and Spark performance metrics. Comma or space separated key:value pairs. Follow Datadog tag conventions. Example: env:staging,team:data_engineering | |
| DD_ENV | Set the env environment tag on metrics, traces, and logs from this cluster. | |
| DD_LOGS_CONFIG_PROCESSING_RULES | Filter the logs collected with processing rules. See Advanced Log Collection for more details. |
In Databricks, create an init script file in a Unity Catalog volume with the following content. Be sure to make note of the volume path (for example,
/Volumes/catalog_name/schema_name/volume_name/datadog-init-script.sh).#!/bin/bash # Download and run the latest init script curl -L https://install.datadoghq.com/scripts/install-databricks.sh > djm-install-script bash djm-install-script || trueThe script above downloads and runs the latest init script for Data Observability: Jobs Monitoring in Databricks. If you want to pin your script to a specific version, you can replace the filename in the URL (for example,
install-databricks-0.14.0.shto use version0.14.0). You can find the source code used to generate this script, and the changes between script versions, on the Datadog Agent repository.Add the init script to the allowlist (required for Standard access mode clusters): If your cluster uses Standard access mode, you must add the init script path to the Unity Catalog allowlist. Follow the instructions in the Databricks documentation to add your init script path to the allowlist.
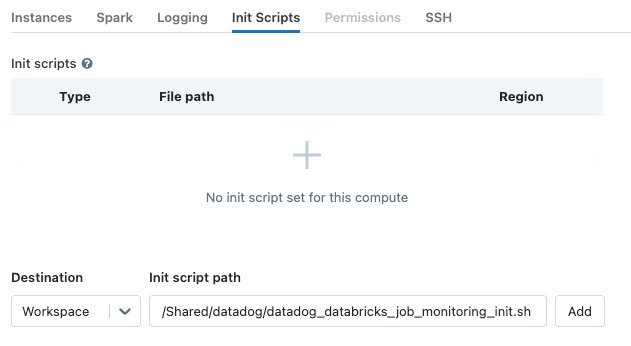
On the cluster configuration page, click the Advanced options toggle.
At the bottom of the page, go to the Init Scripts tab.
- Under the Destination drop-down, select
Volume. - Under Init script path, enter the volume path to your init script.
- Click Add.
- Under the Destination drop-down, select
Set the required init script parameters
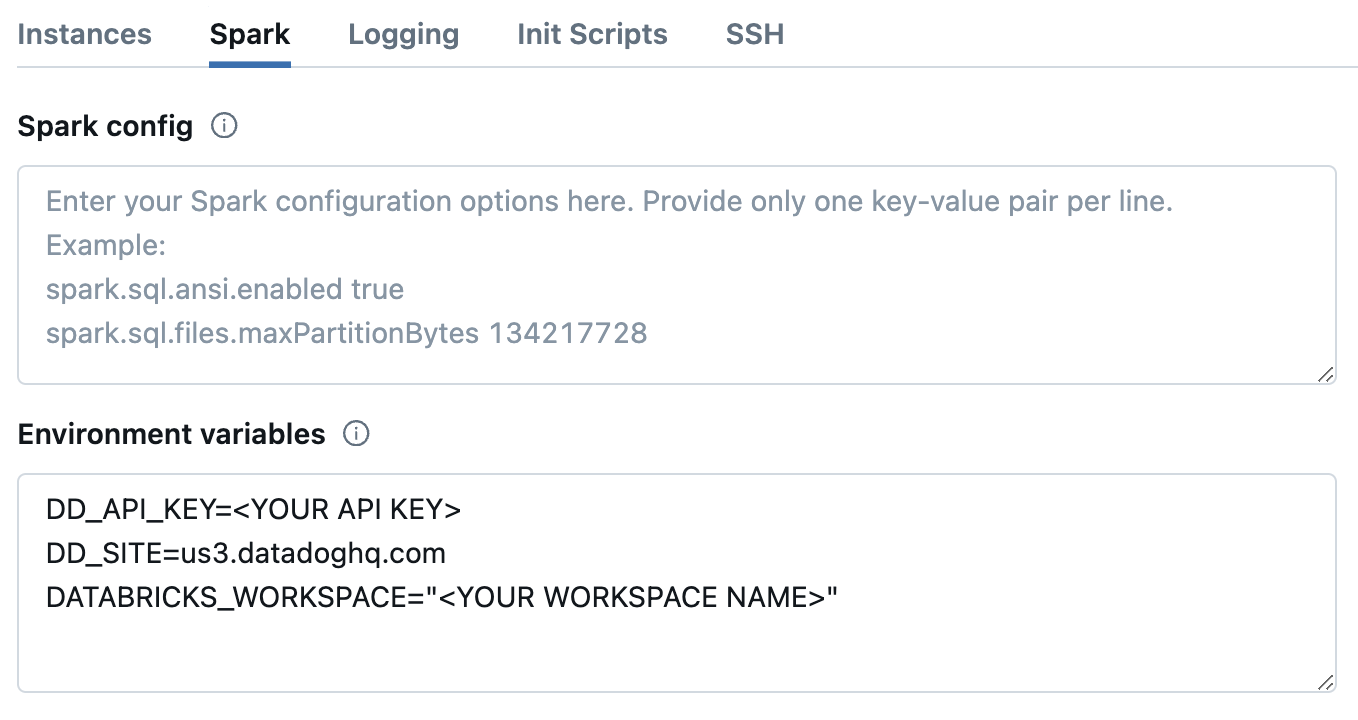
In Databricks, on the cluster configuration page, click the Advanced options toggle.
At the bottom of the page, go to the Spark tab.
In the Environment variables textbox, provide the values for the init script parameters.
DD_API_KEY=<YOUR API KEY>
DD_SITE=<YOUR DATADOG SITE>
DATABRICKS_WORKSPACE="<YOUR WORKSPACE NAME>"
Optionally, you can also set other init script parameters and Datadog environment variables here, such as
DD_ENVandDD_SERVICE. The script can be configured using the following parameters:
| Variable | Description | Default |
|---|---|---|
| DD_API_KEY | Your Datadog API key. | |
| DD_SITE | Your Datadog site. | |
| DATABRICKS_WORKSPACE | Name of your Databricks Workspace. It should match the name provided in the Datadog-Databricks integration step. Enclose the name in double quotes if it contains whitespace. | |
| DRIVER_LOGS_ENABLED | Collect spark driver logs in Datadog. | false |
| WORKER_LOGS_ENABLED | Collect spark workers logs in Datadog. | false |
| DD_TAGS | Add tags to Databricks cluster and Spark performance metrics. Comma or space separated key:value pairs. Follow Datadog tag conventions. Example: env:staging,team:data_engineering | |
| DD_ENV | Set the env environment tag on metrics, traces, and logs from this cluster. | |
| DD_LOGS_CONFIG_PROCESSING_RULES | Filter the logs collected with processing rules. See Advanced Log Collection for more details. |
- Click Confirm.
Restart already-running clusters
The init script installs the Agent when clusters start.
Already-running all-purpose clusters or long-lived job clusters must be manually restarted for the init script to install the Datadog Agent.
For scheduled jobs that run on job clusters, the init script installs the Datadog Agent automatically on the next run.
Validation
In Datadog, view the Data Observability: Jobs Monitoring page to see a list of all your Databricks jobs.
If some jobs are not visible, navigate to the Configuration page to understand why. This page lists all your Databricks jobs not yet configured with the Agent on their clusters, along with guidance for completing setup.
Troubleshooting
If you don’t see any data in DJM after installing the product, follow these steps.
- API Key Validation: If the init script was manually installed, but cluster data still isn’t showing up in the DJM product, use the Validate API key endpoint to ensure that the Datadog API key specified in the script is valid.
- Agent Validation: The init script installs the Datadog Agent. To make sure it is properly installed, connect to the cluster with SSH and run the Agent status command:
sudo datadog-agent status
Advanced Configuration
Filter log collection on clusters
Exclude all log collection from an individual cluster
Configure the following environment variable in the Advanced Configuration section of your cluster in the Databricks UI or as a Spark environment variable in the Databricks API.
DD_LOGS_CONFIG_PROCESSING_RULES=[{\"type\": \"exclude_at_match\",\"name\": \"drop_all_logs\",\"pattern\": \".*\"}]
Permissions
Grant Workspace Admin privileges to the user or service principal that connects to your Databricks workspace. This allows Datadog to manage init script installations and updates automatically, reducing the risk of misconfiguration.
If you need more granular control, grant these minimal permissions to the following workspace level objects to still be able to monitor all jobs, clusters, and queries within a workspace:
| Object | Permission |
|---|---|
| Job | CAN VIEW |
| Compute | CAN ATTACH TO |
| Lakeflow Declarative Pipelines | CAN VIEW |
| Query | CAN VIEW |
| SQL warehouse | CAN MONITOR |
Additionally, for Datadog to access your Databricks cost data in Data Observability: Jobs Monitoring or Cloud Cost Management, the user or service principal used to query system tables must have the following permissions:
CAN USEpermission on the SQL Warehouse.- Read access to the system tables within Unity Catalog. This can be granted with:
GRANT USE CATALOG ON CATALOG system TO <service_principal>;
GRANT SELECT ON CATALOG system TO <service_principal>;
GRANT USE SCHEMA ON CATALOG system TO <service_principal>;
The user granting these must have MANAGE privilege on CATALOG system.
Tag spans at runtime
You can set tags on Spark spans at runtime. These tags are applied only to spans that start after the tag is added.
// Add tag for all next Spark computations
sparkContext.setLocalProperty("spark.datadog.tags.key", "value")
spark.read.parquet(...)
To remove a runtime tag:
// Remove tag for all next Spark computations
sparkContext.setLocalProperty("spark.datadog.tags.key", null)
Aggregate cluster metrics from one-time job runs
This configuration is applicable if you want cluster resource utilization data about your jobs and create a new job and cluster for each run via the one-time run API endpoint (common when using orchestration tools outside of Databricks such as Airflow or Azure Data Factory).
If you are submitting Databricks Jobs through the one-time run API endpoint, each job run has a unique job ID. This can make it difficult to group and analyze cluster metrics for jobs that use ephemeral clusters. To aggregate cluster utilization from the same job and assess performance across multiple runs, you must set the DD_JOB_NAME variable inside the spark_env_vars of every new_cluster to the same value as your request payload’s run_name.
Here’s an example of a one-time job run request body:
{
   "run_name": "Example Job",
   "idempotency_token": "8f018174-4792-40d5-bcbc-3e6a527352c8",
   "tasks": [
      {
         "task_key": "Example Task",
         "description": "Description of task",
         "depends_on": [],
         "notebook_task": {
            "notebook_path": "/Path/to/example/task/notebook",
            "source": "WORKSPACE"
         },
         "new_cluster": {
            "num_workers": 1,
            "spark_version": "13.3.x-scala2.12",
            "node_type_id": "i3.xlarge",
            "spark_env_vars": {
               "DD_JOB_NAME": "Example Job"
            }
         }
      }
   ]
}
Set up Data Observability: Jobs Monitoring with Databricks Networking Restrictions
With Databricks Networking Restrictions, Datadog may not have access to your Databricks APIs, which is required to collect traces for Databricks job executions along with tags and other metadata.
If you are controlling Databricks API access with IP access lists, allow-listing Datadog’s specific webhook IP addresses allows Datadog to connect to the Databricks APIs in your workspace. See Databricks’s documentation for configuring IP access lists for individual workspaces to give Datadog API access.
Note: Monitoring workspaces that use Databricks Private Link connectivity is not supported.
Further Reading
Additional helpful documentation, links, and articles:
