- Agents
- Essentials
- Getting Started
- Agent
- API
- APM Tracing
- Containers
- Dashboards
- Database Monitoring
- Datadog
- Datadog Site
- DevSecOps
- Incident Management
- Integrations
- Internal Developer Portal
- Logs
- Monitors
- Notebooks
- OpenTelemetry
- Profiler
- Search
- Session Replay
- Security
- Serverless for AWS Lambda
- Software Delivery
- Synthetic Monitoring and Testing
- Tags
- Workflow Automation
- Learning Center
- Support
- Glossary
- Standard Attributes
- Guides
- Agent
- Integrations
- Extend Datadog
- Authorization
- DogStatsD
- Custom Checks
- Integrations
- Build an Integration with Datadog
- Create an Agent-based Integration
- Create an API-based Integration
- Create a Log Pipeline
- Integration Assets Reference
- Build a Marketplace Offering
- Create an Integration Dashboard
- Create a Monitor Template
- Create a Cloud SIEM Detection Rule
- Install Agent Integration Developer Tool
- Service Checks
- Community
- Guides
- OpenTelemetry
- Administrator's Guide
- API
- Partners
- Datadog Mobile App
- DDSQL Reference
- CoScreen
- CoTerm
- Remote Configuration
- Cloudcraft (Standalone)
- In The App
- Dashboards
- Notebooks
- DDSQL Editor
- Reference Tables
- Sheets
- Monitors and Alerting
- Service Level Objectives
- Metrics
- Watchdog
- Bits AI
- Internal Developer Portal
- Error Tracking
- Change Tracking
- Event Management
- Incident Response
- Actions & Remediations
- Infrastructure
- Cloudcraft
- Resource Catalog
- Universal Service Monitoring
- End User Device Monitoring
- Hosts
- Containers
- Processes
- Serverless
- Network Monitoring
- Storage Management
- Cloud Cost
- Application Performance
- APM
- Continuous Profiler
- Database Monitoring
- Agent Integration Overhead
- Setup Architectures
- Setting Up Postgres
- Setting Up MySQL
- Setting Up SQL Server
- Setting Up Oracle
- Setting Up Amazon DocumentDB
- Setting Up MongoDB
- Setting Up ClickHouse
- Connecting DBM and Traces
- Data Collected
- Exploring Database Hosts
- Exploring Query Metrics
- Exploring Query Samples
- Exploring Database Schemas
- Exploring Recommendations
- Troubleshooting
- Guides
- Data Streams Monitoring
- Data Observability
- Digital Experience
- Real User Monitoring
- Synthetic Testing and Monitoring
- Continuous Testing
- Experiments
- Product Analytics
- Session Replay
- Software Delivery
- CI Visibility
- CD Visibility
- Deployment Gates
- Test Optimization
- Code Coverage
- PR Gates
- DORA Metrics
- Feature Flags
- Developer Integrations
- Security
- Security Overview
- Cloud SIEM
- Code Security
- Cloud Security
- App and API Protection
- AI Guard
- Workload Protection
- Sensitive Data Scanner
- AI Observability
- Log Management
- Observability Pipelines
- Configuration
- Sources
- Processors
- Destinations
- Packs
- Akamai CDN
- Amazon CloudFront
- Amazon VPC Flow Logs
- AWS Application Load Balancer Logs
- AWS CloudTrail
- AWS Elastic Load Balancer Logs
- AWS Network Load Balancer Logs
- Cisco ASA
- Cloudflare
- F5
- Fastly
- Fortinet Firewall
- HAProxy Ingress
- Istio Proxy
- Juniper SRX Firewall Traffic Logs
- Netskope
- NGINX
- Okta
- Palo Alto Firewall
- Windows XML
- ZScaler ZIA DNS
- Zscaler ZIA Firewall
- Zscaler ZIA Tunnel
- Zscaler ZIA Web Logs
- Search Syntax
- Scaling and Performance
- Monitoring and Troubleshooting
- Guides and Resources
- Log Management
- CloudPrem
- Administration
Data Observability: Jobs Monitoring
This product is not supported for your selected Datadog site. ().
Data Observability: Jobs Monitoring provides visibility into the performance, reliability, and cost efficiency of your data processing jobs, along with the underlying infrastructure. Data Observability: Jobs Monitoring enables you to:
- Track the health and performance of data processing jobs across your accounts and workspaces. See which take up the most compute resources or have inefficiencies.
- Receive an alert when a job fails—or when a job is taking too long to complete.
- Analyze job execution details and stack traces.
- Correlate infrastructure metrics, Spark metrics from the Spark UI, logs, and cluster configuration.
- Compare multiple runs to facilitate troubleshooting, and to optimize provisioning and configuration during deployment.
Setup
Data Observability: Jobs Monitoring supports multiple job technologies. To get started, select your technology and follow the installation instructions:
Data Observability: Jobs Monitoring also supports Apache Spark jobs on the following platforms:
Explore Data Observability: Jobs Monitoring
Easily identify unreliable and inefficient jobs
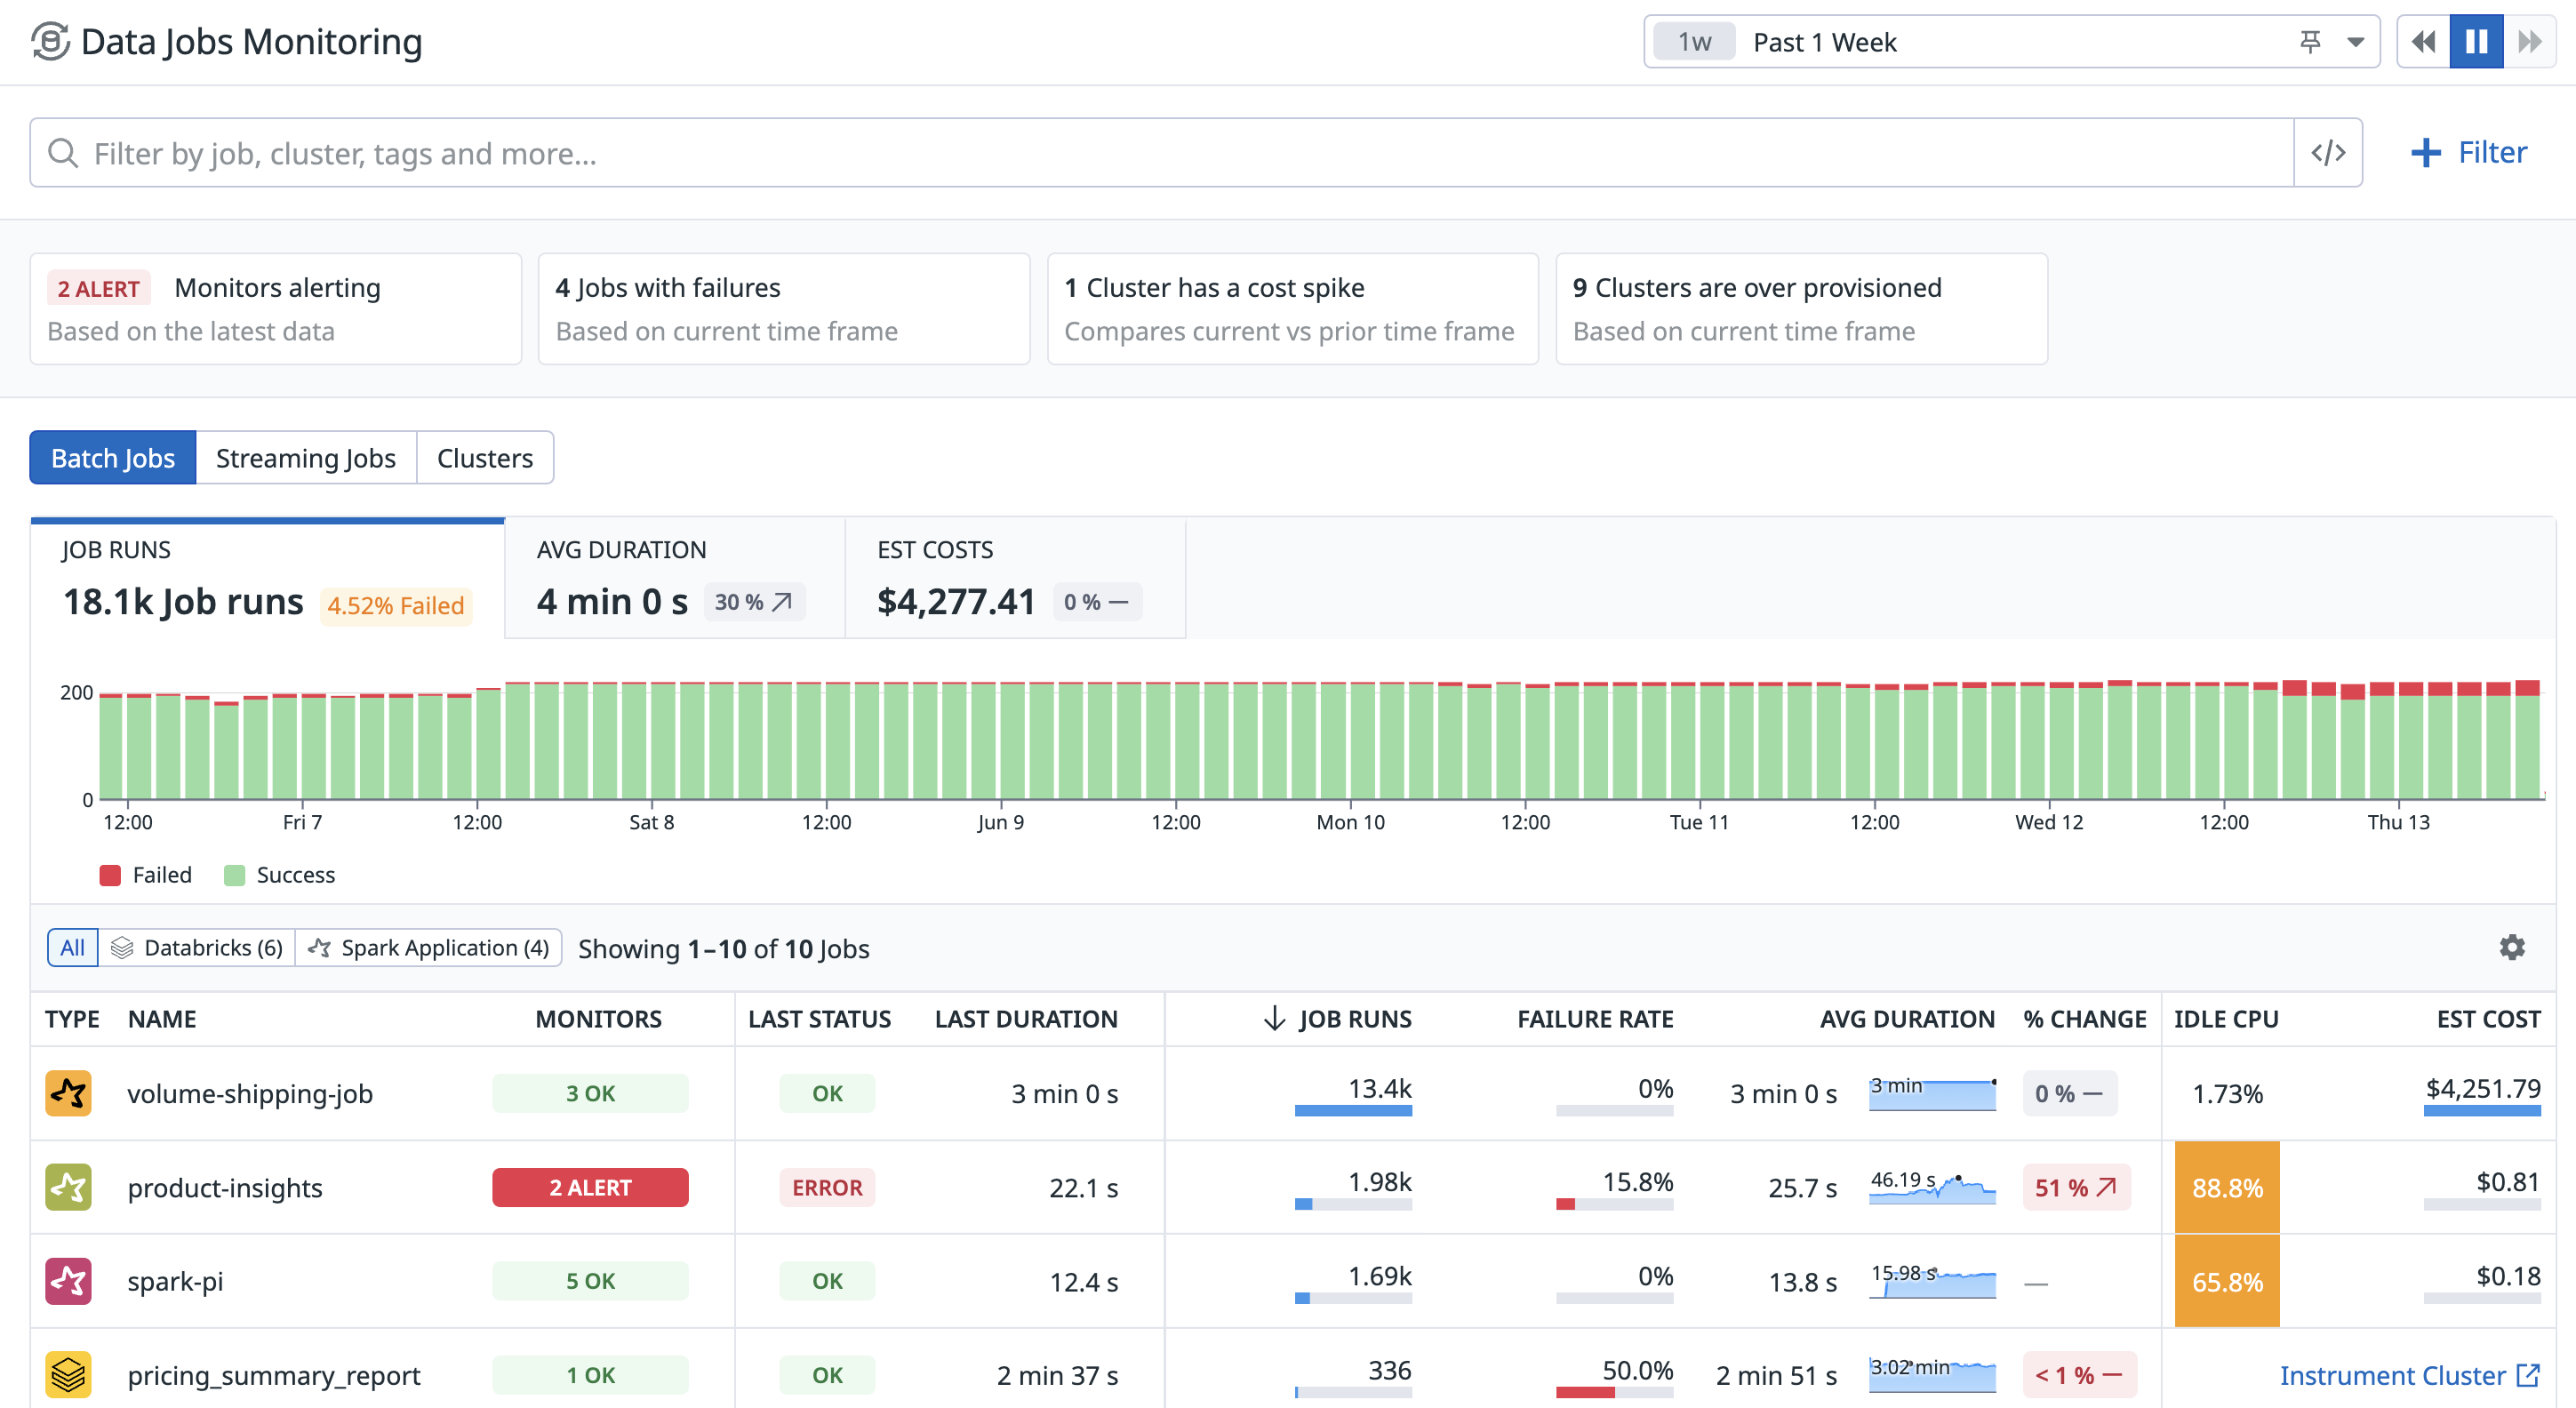
View all jobs across cloud accounts and workspaces. Identify failing jobs to take action on, or find jobs with high idle CPU that are using a lot of compute and should be optimized.
Receive alerts on problematic jobs
Datadog monitors send alerts when a job fails, or is running beyond its completion time. Browse monitor templates to monitor data jobs specific to your installed integrations.
Analyze and troubleshoot individual jobs
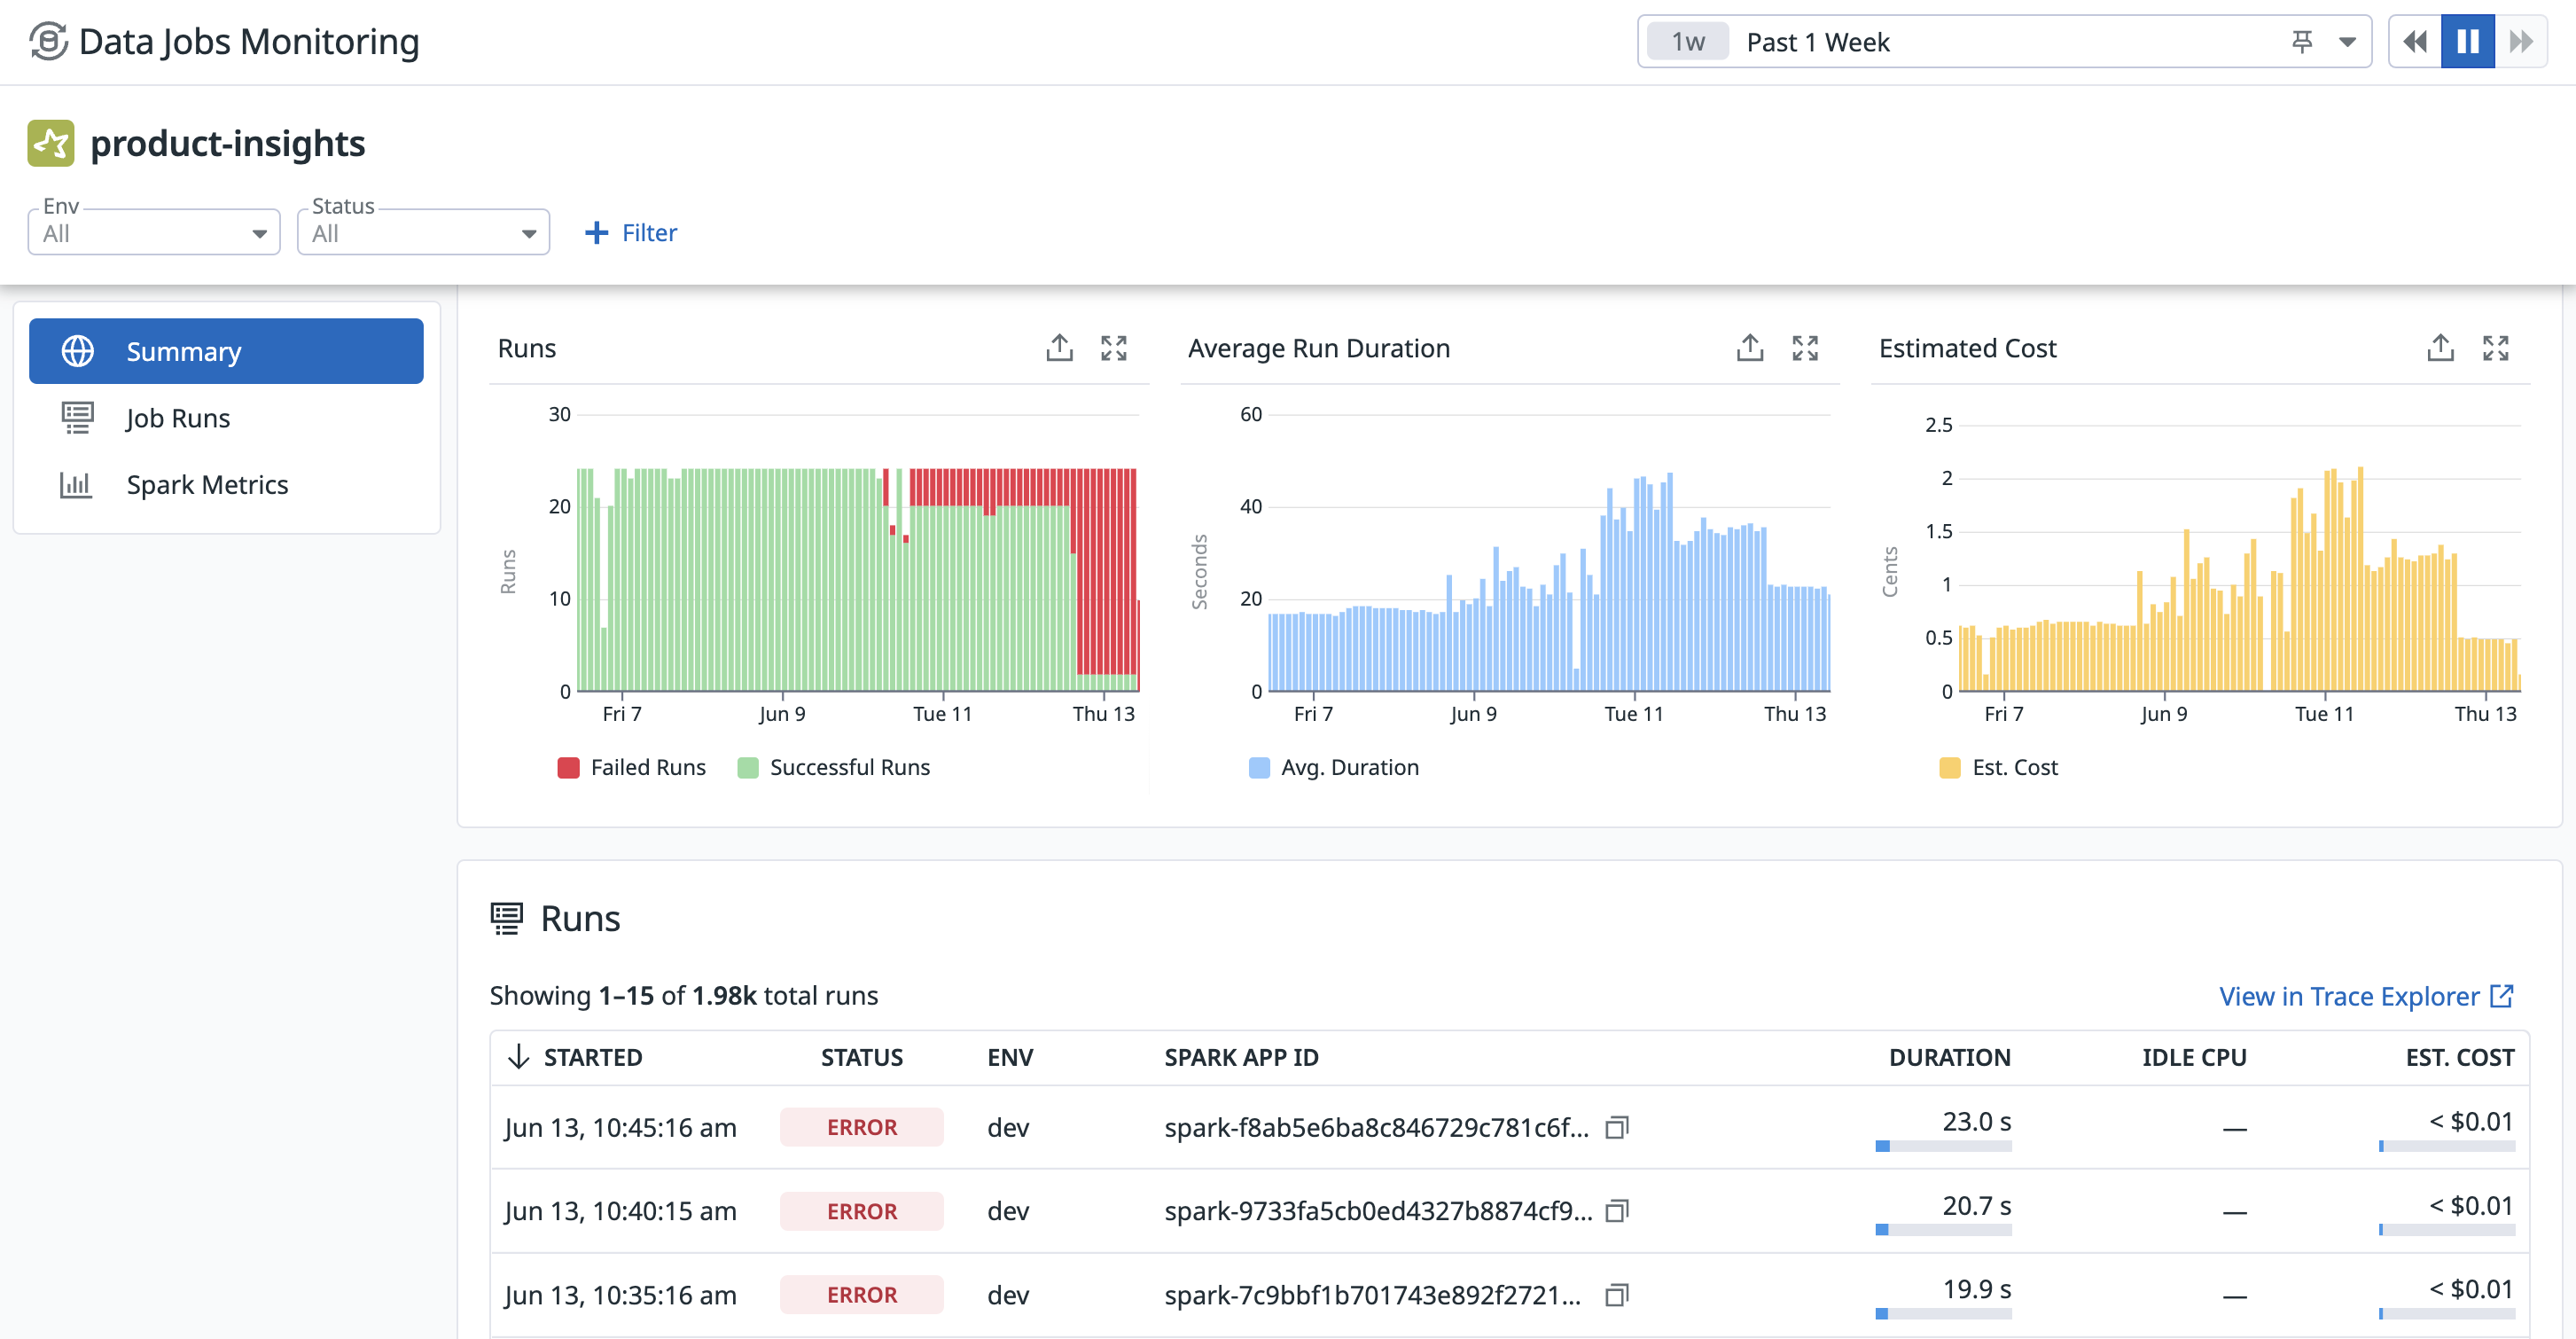
Click on a job to see how it performed across multiple runs, as well as error messages for failed runs.
Analyze an individual run
Clicking on a run opens a side panel with details of how much time was spent on each Spark job and stage, along with a breakdown of resource consumption and Spark metrics, such as idle executor CPU, input/output data volume, shuffling, and disk spill. From this panel, you can correlate the execution with executor and driver node resource utilization, logs, and the job and cluster configuration.
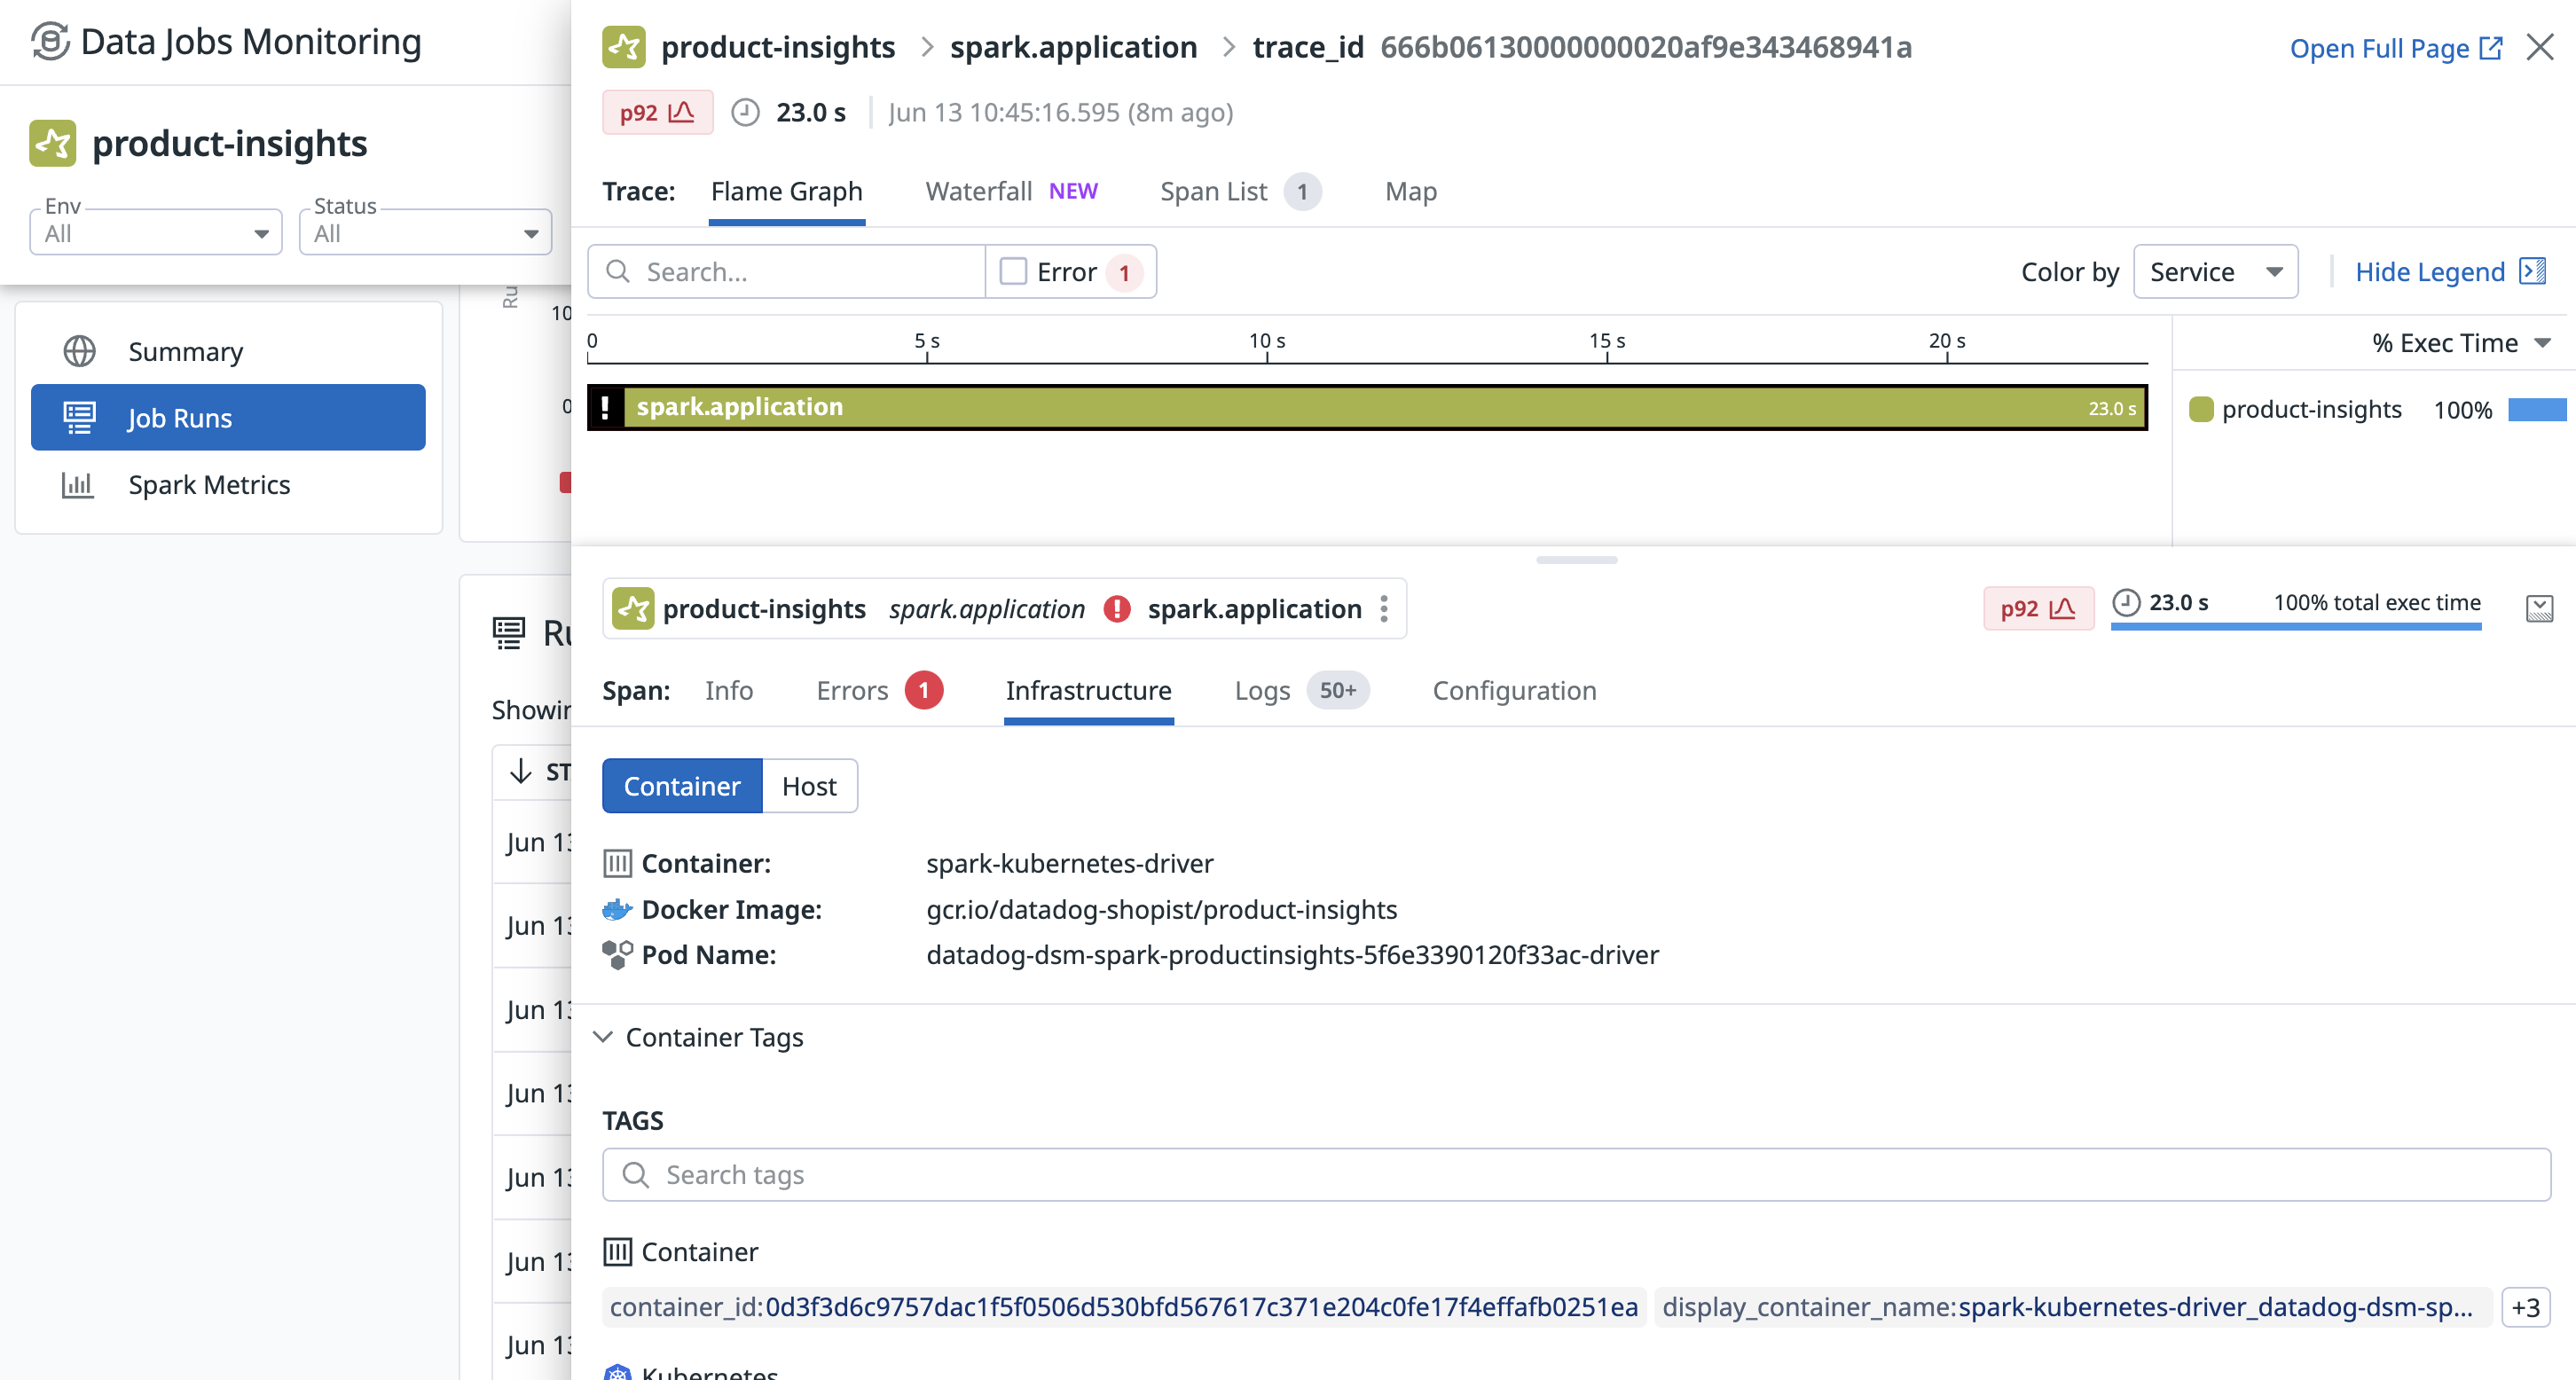
On the Infrastructure tab, you can correlate the execution to infrastructure metrics.
For a failed run, look at the Errors tab to see the stack trace, which can help you determine where and how this failure occurred.
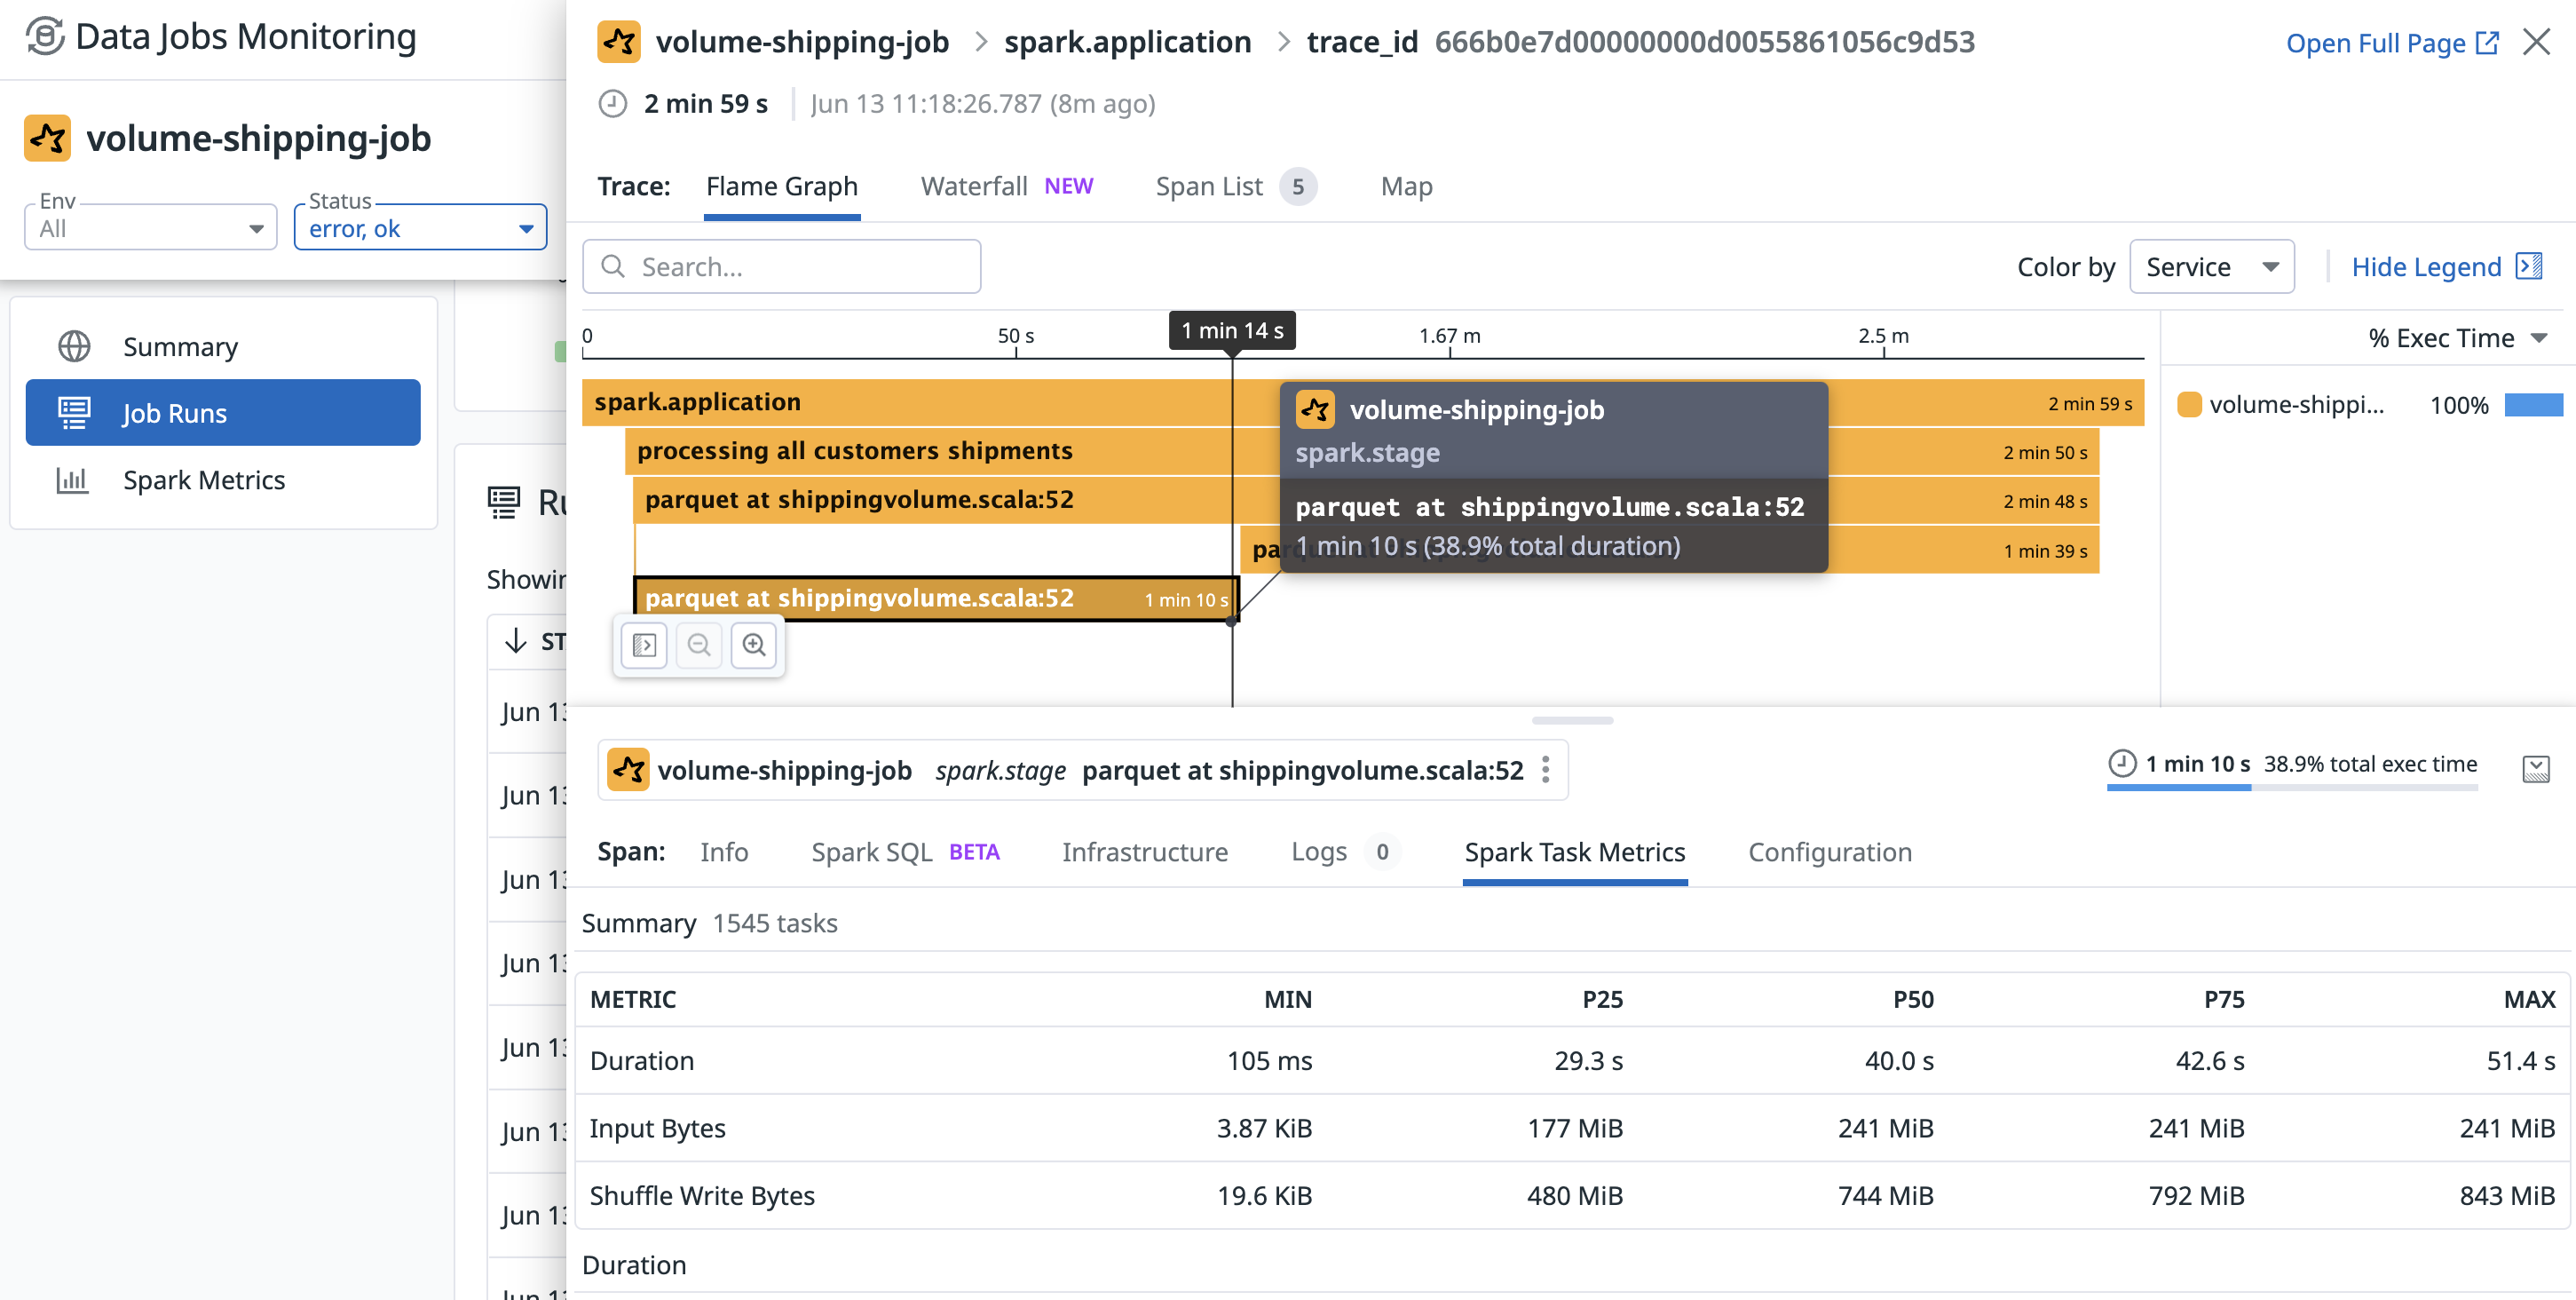
To determine why a stage is taking a long time to complete, you can use the Spark Task Metrics tab to view task-level metrics for a specific Spark stage, so that you can identify data skew. See the distribution of time spent and data consumed by different tasks.
Further Reading
Additional helpful documentation, links, and articles:


