- Essentials
- Getting Started
- Agent
- API
- APM Tracing
- Containers
- Dashboards
- Database Monitoring
- Datadog
- Datadog Site
- DevSecOps
- Incident Management
- Integrations
- Internal Developer Portal
- Logs
- Monitors
- Notebooks
- OpenTelemetry
- Profiler
- Search
- Session Replay
- Security
- Serverless for AWS Lambda
- Software Delivery
- Synthetic Monitoring and Testing
- Tags
- Workflow Automation
- Learning Center
- Support
- Glossary
- Standard Attributes
- Guides
- Agent
- Integrations
- Developers
- Authorization
- DogStatsD
- Custom Checks
- Integrations
- Build an Integration with Datadog
- Create an Agent-based Integration
- Create an API-based Integration
- Create a Log Pipeline
- Integration Assets Reference
- Build a Marketplace Offering
- Create an Integration Dashboard
- Create a Monitor Template
- Create a Cloud SIEM Detection Rule
- Install Agent Integration Developer Tool
- Service Checks
- IDE Plugins
- Community
- Guides
- OpenTelemetry
- Administrator's Guide
- API
- Partners
- Datadog Mobile App
- DDSQL Reference
- CoScreen
- CoTerm
- Remote Configuration
- Cloudcraft (Standalone)
- In The App
- Dashboards
- Notebooks
- DDSQL Editor
- Reference Tables
- Sheets
- Monitors and Alerting
- Service Level Objectives
- Metrics
- Watchdog
- Bits AI
- Internal Developer Portal
- Error Tracking
- Change Tracking
- Event Management
- Incident Response
- Actions & Remediations
- Infrastructure
- Cloudcraft
- Resource Catalog
- Universal Service Monitoring
- End User Device Monitoring
- Hosts
- Containers
- Processes
- Serverless
- Network Monitoring
- Storage Management
- Cloud Cost
- Application Performance
- APM
- Continuous Profiler
- Database Monitoring
- Agent Integration Overhead
- Setup Architectures
- Setting Up Postgres
- Setting Up MySQL
- Setting Up SQL Server
- Setting Up Oracle
- Setting Up Amazon DocumentDB
- Setting Up MongoDB
- Connecting DBM and Traces
- Data Collected
- Exploring Database Hosts
- Exploring Query Metrics
- Exploring Query Samples
- Exploring Database Schemas
- Exploring Recommendations
- Troubleshooting
- Guides
- Data Streams Monitoring
- Data Observability
- Digital Experience
- Real User Monitoring
- Synthetic Testing and Monitoring
- Continuous Testing
- Product Analytics
- Session Replay
- Software Delivery
- CI Visibility
- CD Visibility
- Deployment Gates
- Test Optimization
- Code Coverage
- PR Gates
- DORA Metrics
- Feature Flags
- Security
- Security Overview
- Cloud SIEM
- Code Security
- Cloud Security
- App and API Protection
- AI Guard
- Workload Protection
- Sensitive Data Scanner
- AI Observability
- Log Management
- Observability Pipelines
- Configuration
- Sources
- Processors
- Destinations
- Packs
- Akamai CDN
- Amazon CloudFront
- Amazon VPC Flow Logs
- AWS Application Load Balancer Logs
- AWS CloudTrail
- AWS Elastic Load Balancer Logs
- AWS Network Load Balancer Logs
- Cisco ASA
- Cloudflare
- F5
- Fastly
- Fortinet Firewall
- HAProxy Ingress
- Istio Proxy
- Juniper SRX Firewall Traffic Logs
- Netskope
- NGINX
- Okta
- Palo Alto Firewall
- Windows XML
- ZScaler ZIA DNS
- Zscaler ZIA Firewall
- Zscaler ZIA Tunnel
- Zscaler ZIA Web Logs
- Search Syntax
- Scaling and Performance
- Monitoring and Troubleshooting
- Guides and Resources
- Log Management
- CloudPrem
- Administration
Compatible semantic tags
Overview
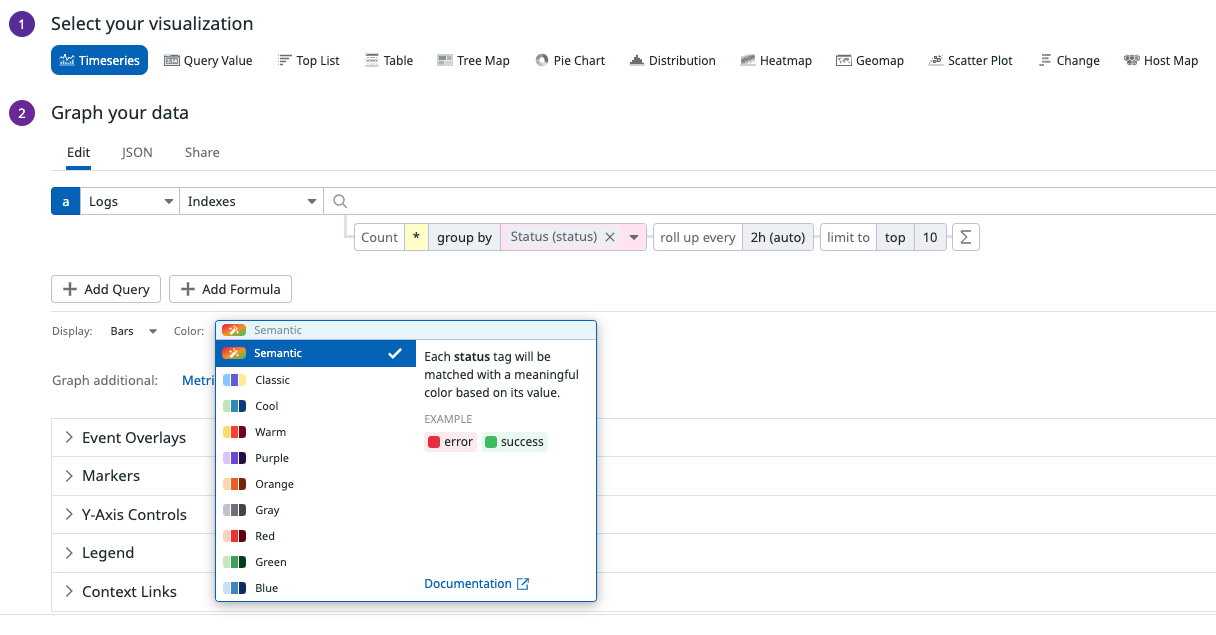
For compatible series of data, Datadog can map colors to meaning. When a compatible tag is detected, Datadog suggests the Semantic color palette. This automatically maps data to meaning-driven colors.
Note: To use the Semantic color palette, a query must be grouped with a single set of tags.
Map compatible tags to colors based on their meaning
For example, an error status code is mapped to red, and success to green.
Ensure consistent coloring across charts
Charts with a semantic palette use the same, stable color for each tag. This allows you to easily trace a given tag across different graphs.
Grouping behavior
Queries grouped with a single set of tags are supported. If multiple groupers are used with the semantic palette, coloring is consistent, but not meaning-driven.
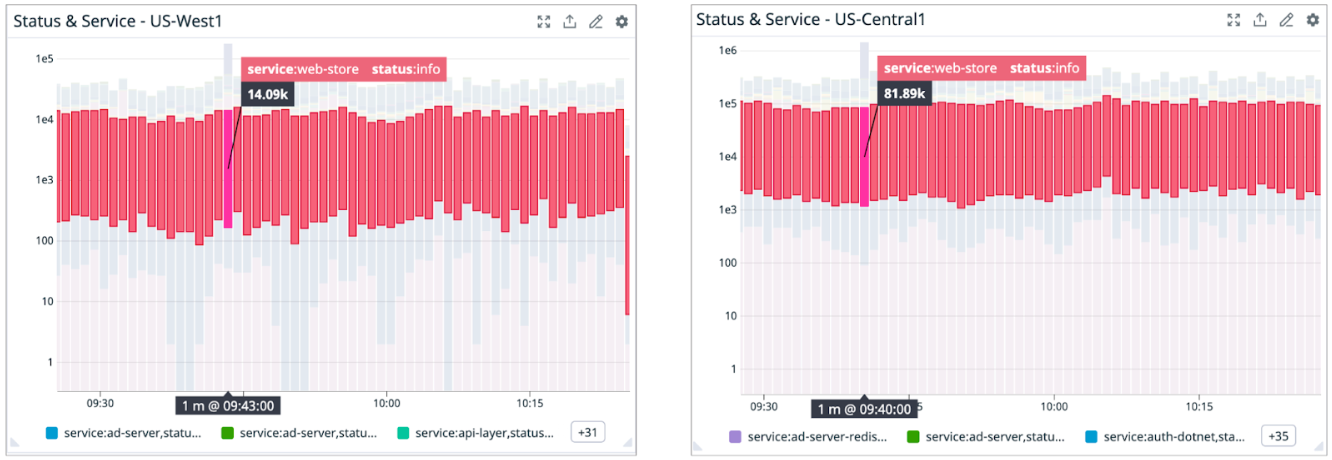
For example, consider a query that uses both the Status and Service tags. Even if the semantic palette is selected, the colors in the chart no longer correspond to a specific meaning (as in, red no longer necessarily indicates “bad”). However, each status/service combination retains consistent coloring for all charts.
Supported tag keys
| Tag key | Description |
|---|---|
status | Used by Logs standard attributes and Datadog Security for severity level. Also supports generic success, fail, pass, error for convenience with custom metrics. |
http.status_code | Standard tag used in many integrations. Colors are assigned based on HTTP status code family (1xx, 2xx, 3xx, 4xx, 5xx) |
@ci.status | Used by CI Visibility |
@test.status | Used by Test Optimization |
@static_analysis.result.status | Used by Code Security |
@static_analysis.result.k9_severity | Used by Code Security and CSM IaC |
@dependency.severity | Used by Code Security |
@dependency.datadog_severity | Used by Code Security |
@deployment.status | Used by CD Visibility |
@evaluation.status | Used by Quality Gates |
evaluation | Used by Cloud Security |
severity | Used by Cloud Security |
@resource.status_code | Used by RUM & Session Replay. Uses the same colors as http.status_code. |
@error.resource.status_code | Used by RUM & Session Replay. Uses the same colors as http.status_code. |
@batch.status | Used by Synthetic Monitoring for test batch results. |
@suite.status | Used by Synthetic Monitoring for test suite results. |
@result.status | Used by Synthetic Monitoring for test run results. |
Further reading
Additional helpful documentation, links, and articles:


