- Agents
- Essentials
- Getting Started
- Agent
- API
- APM Tracing
- Containers
- Dashboards
- Database Monitoring
- Datadog
- Datadog Site
- DevSecOps
- Incident Management
- Integrations
- Internal Developer Portal
- Logs
- Monitors
- Notebooks
- OpenTelemetry
- Profiler
- Search
- Session Replay
- Security
- Serverless for AWS Lambda
- Software Delivery
- Synthetic Monitoring and Testing
- Tags
- Workflow Automation
- Learning Center
- Support
- Glossary
- Standard Attributes
- Guides
- Agent
- Integrations
- Extend Datadog
- Authorization
- DogStatsD
- Custom Checks
- Integrations
- Build an Integration with Datadog
- Create an Agent-based Integration
- Create an API-based Integration
- Create a Log Pipeline
- Integration Assets Reference
- Build a Marketplace Offering
- Create an Integration Dashboard
- Create a Monitor Template
- Create a Cloud SIEM Detection Rule
- Install Agent Integration Developer Tool
- Service Checks
- Community
- Guides
- OpenTelemetry
- Administrator's Guide
- API
- Partners
- Datadog Mobile App
- DDSQL Reference
- CoScreen
- CoTerm
- Remote Configuration
- Cloudcraft (Standalone)
- In The App
- Dashboards
- Notebooks
- DDSQL Editor
- Reference Tables
- Sheets
- Monitors and Alerting
- Service Level Objectives
- Metrics
- Watchdog
- Bits AI
- Internal Developer Portal
- Error Tracking
- Change Tracking
- Event Management
- Incident Response
- Actions & Remediations
- Infrastructure
- Cloudcraft
- Resource Catalog
- Universal Service Monitoring
- End User Device Monitoring
- Hosts
- Containers
- Processes
- Serverless
- Network Monitoring
- Storage Management
- Cloud Cost
- Application Performance
- APM
- Continuous Profiler
- Database Monitoring
- Agent Integration Overhead
- Setup Architectures
- Setting Up Postgres
- Setting Up MySQL
- Setting Up SQL Server
- Setting Up Oracle
- Setting Up Amazon DocumentDB
- Setting Up MongoDB
- Setting Up ClickHouse
- Connecting DBM and Traces
- Data Collected
- Exploring Database Hosts
- Exploring Query Metrics
- Exploring Query Samples
- Exploring Database Schemas
- Exploring Recommendations
- Troubleshooting
- Guides
- Data Streams Monitoring
- Data Observability
- Digital Experience
- Real User Monitoring
- Synthetic Testing and Monitoring
- Continuous Testing
- Experiments
- Product Analytics
- Session Replay
- Software Delivery
- CI Visibility
- CD Visibility
- Deployment Gates
- Test Optimization
- Code Coverage
- PR Gates
- DORA Metrics
- Feature Flags
- Developer Integrations
- Security
- Security Overview
- Cloud SIEM
- Code Security
- Cloud Security
- App and API Protection
- AI Guard
- Workload Protection
- Sensitive Data Scanner
- AI Observability
- Log Management
- Observability Pipelines
- Configuration
- Sources
- Processors
- Destinations
- Packs
- Akamai CDN
- Amazon CloudFront
- Amazon VPC Flow Logs
- AWS Application Load Balancer Logs
- AWS CloudTrail
- AWS Elastic Load Balancer Logs
- AWS Network Load Balancer Logs
- Cisco ASA
- Cloudflare
- F5
- Fastly
- Fortinet Firewall
- HAProxy Ingress
- Istio Proxy
- Juniper SRX Firewall Traffic Logs
- Netskope
- NGINX
- Okta
- Palo Alto Firewall
- Windows XML
- ZScaler ZIA DNS
- Zscaler ZIA Firewall
- Zscaler ZIA Tunnel
- Zscaler ZIA Web Logs
- Search Syntax
- Scaling and Performance
- Monitoring and Troubleshooting
- Guides and Resources
- Log Management
- CloudPrem
- Administration
Watchdog Explains
Overview
Watchdog Explains is an investigation assistant that detects anomalies on timeseries graphs and identifies which tags contribute to them. This allows you to immediately focus your investigation on problematic areas of your infrastructure or software stack.
To disable Watchdog Explains, see Disabling anomaly detection.
Watchdog Explains is available for Timeseries widgets with Metric data (avg, sum, min, and max aggregation).
How Watchdog Explains detects anomalies
Watchdog Explains applies anomaly detection to graphs on your dashboard by analyzing both the shape and value of the underlying timeseries. It identifies deviations from historical patterns, flagging spikes, dips, or gradual drifts that don’t align with expected behavior.
To account for seasonality, the algorithm looks back up to three weeks in time. For example, if a spike appears on a Monday at 9:00 a.m., Watchdog compares that datapoint against previous Mondays at the same hour. If similar patterns appear consistently, the spike is treated as seasonal and not flagged as an anomaly. This helps reduce false positives and ensures that only unexpected deviations are surfaced.
Anomalies can be sharp spikes or drops, but may also be more subtle trends like step changes or slope shifts.
Anomaly detection in Watchdog Explains works with Metrics data (avg, sum, min, and max aggregation).
Watchdog Explains isolates the cause with dimensional analysis
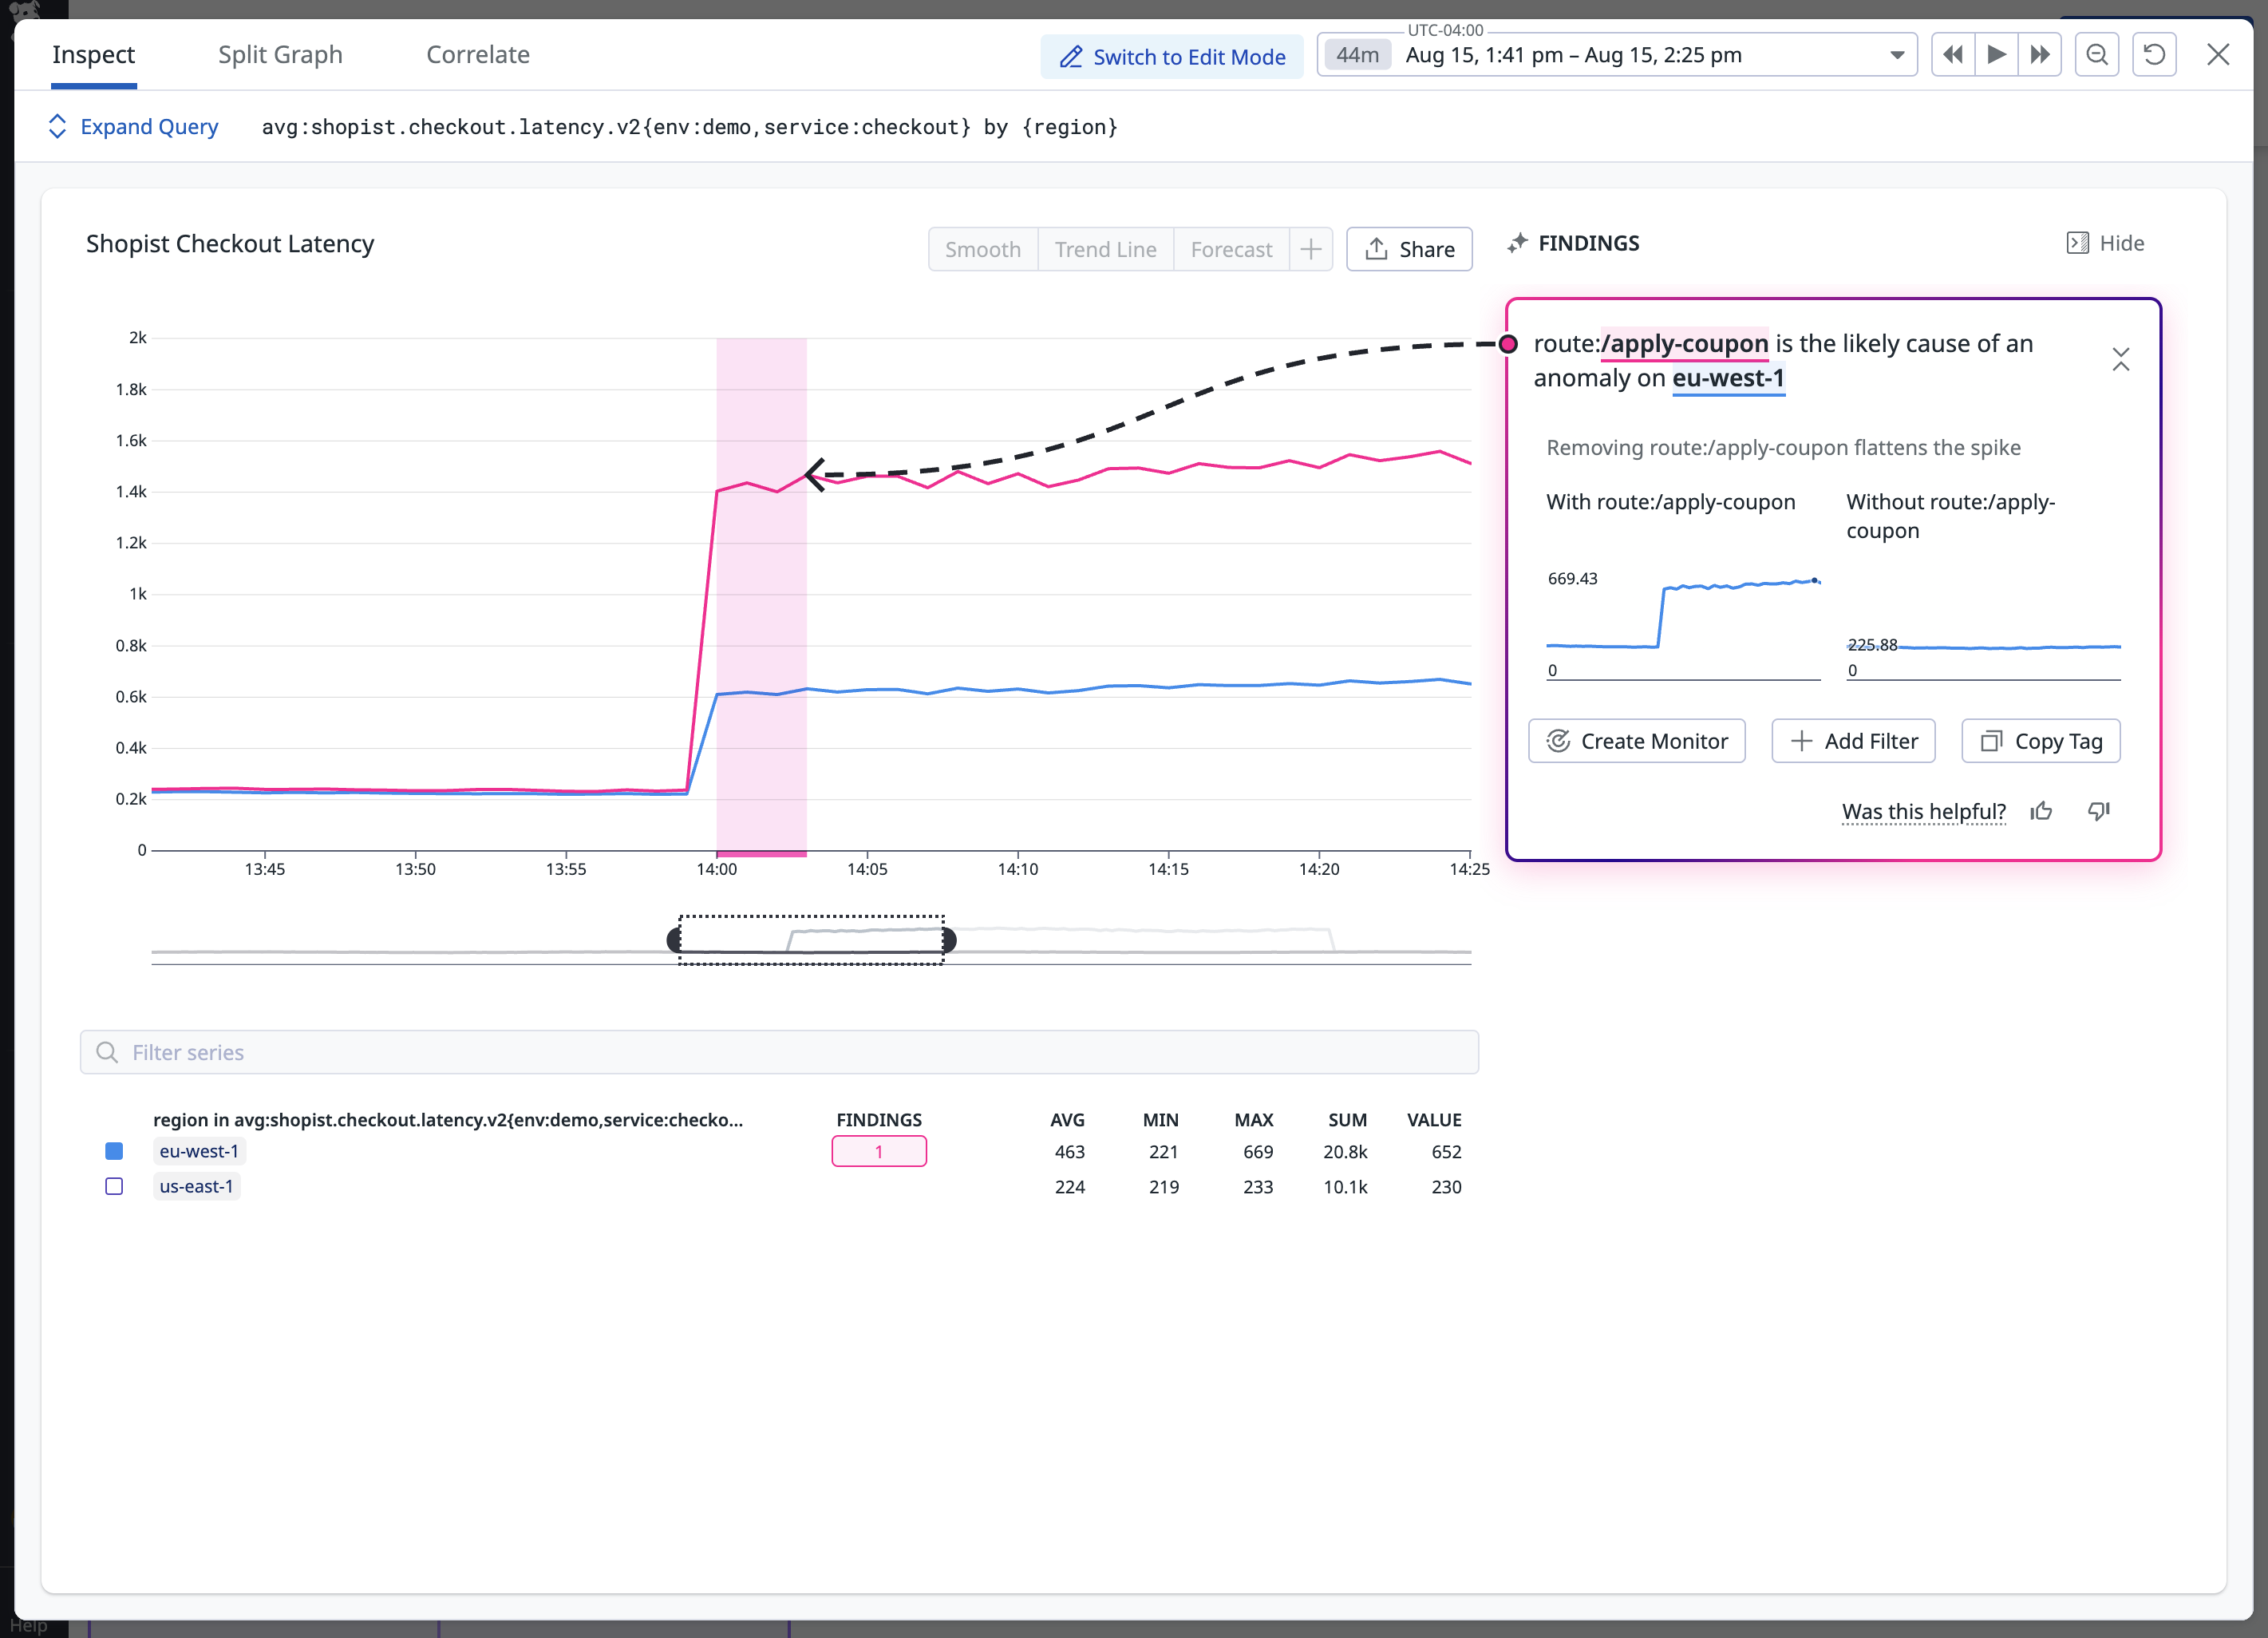
You can start your investigation from any timeseries graph that uses metric data. When Watchdog Explains detects an anomaly, it highlights the affected region with a pink box. To begin investigating, click Investigate Anomaly.
This opens a full-screen investigation view. Watchdog analyzes the anomaly and surfaces any tag groups that significantly contributed to the shape or scale of the anomaly. Click on a tag to see how removing or isolating that dimension affects the graph. Use this to identify root causes like specific customers, services, or environments.
Disabling anomaly detection
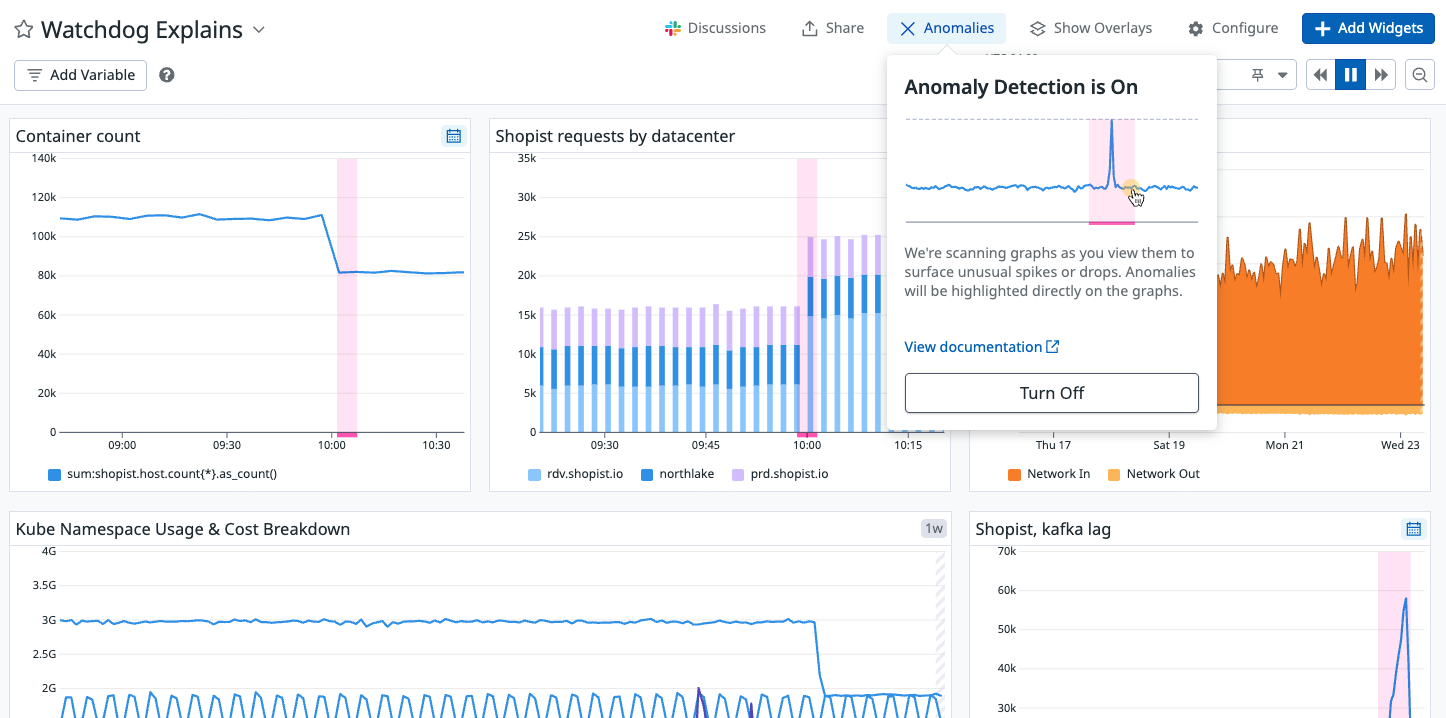
You can disable anomaly scanning on any dashboard. This only affects your view, other dashboard viewers still see anomalies unless they turn it off.
To disable anomaly detection on a dashboard, open Anomalies at the top of the dashboard and click Turn Off.
Further reading
Additional helpful documentation, links, and articles:


