- Essentials
- Getting Started
- Agent
- API
- APM Tracing
- Containers
- Dashboards
- Database Monitoring
- Datadog
- Datadog Site
- DevSecOps
- Incident Management
- Integrations
- Internal Developer Portal
- Logs
- Monitors
- Notebooks
- OpenTelemetry
- Profiler
- Search
- Session Replay
- Security
- Serverless for AWS Lambda
- Software Delivery
- Synthetic Monitoring and Testing
- Tags
- Workflow Automation
- Learning Center
- Support
- Glossary
- Standard Attributes
- Guides
- Agent
- Integrations
- Developers
- Authorization
- DogStatsD
- Custom Checks
- Integrations
- Build an Integration with Datadog
- Create an Agent-based Integration
- Create an API-based Integration
- Create a Log Pipeline
- Integration Assets Reference
- Build a Marketplace Offering
- Create an Integration Dashboard
- Create a Monitor Template
- Create a Cloud SIEM Detection Rule
- Install Agent Integration Developer Tool
- Service Checks
- IDE Plugins
- Community
- Guides
- OpenTelemetry
- Administrator's Guide
- API
- Partners
- Datadog Mobile App
- DDSQL Reference
- CoScreen
- CoTerm
- Remote Configuration
- Cloudcraft (Standalone)
- In The App
- Dashboards
- Notebooks
- DDSQL Editor
- Reference Tables
- Sheets
- Monitors and Alerting
- Service Level Objectives
- Metrics
- Watchdog
- Bits AI
- Internal Developer Portal
- Error Tracking
- Change Tracking
- Event Management
- Incident Response
- Actions & Remediations
- Infrastructure
- Cloudcraft
- Resource Catalog
- Universal Service Monitoring
- End User Device Monitoring
- Hosts
- Containers
- Processes
- Serverless
- Network Monitoring
- Storage Management
- Cloud Cost
- Application Performance
- APM
- Continuous Profiler
- Database Monitoring
- Agent Integration Overhead
- Setup Architectures
- Setting Up Postgres
- Setting Up MySQL
- Setting Up SQL Server
- Setting Up Oracle
- Setting Up Amazon DocumentDB
- Setting Up MongoDB
- Connecting DBM and Traces
- Data Collected
- Exploring Database Hosts
- Exploring Query Metrics
- Exploring Query Samples
- Exploring Database Schemas
- Exploring Recommendations
- Troubleshooting
- Guides
- Data Streams Monitoring
- Data Observability
- Digital Experience
- Real User Monitoring
- Synthetic Testing and Monitoring
- Continuous Testing
- Product Analytics
- Session Replay
- Software Delivery
- CI Visibility
- CD Visibility
- Deployment Gates
- Test Optimization
- Code Coverage
- PR Gates
- DORA Metrics
- Feature Flags
- Security
- Security Overview
- Cloud SIEM
- Code Security
- Cloud Security
- App and API Protection
- Workload Protection
- Sensitive Data Scanner
- AI Observability
- Log Management
- Administration
Annotations
Overview
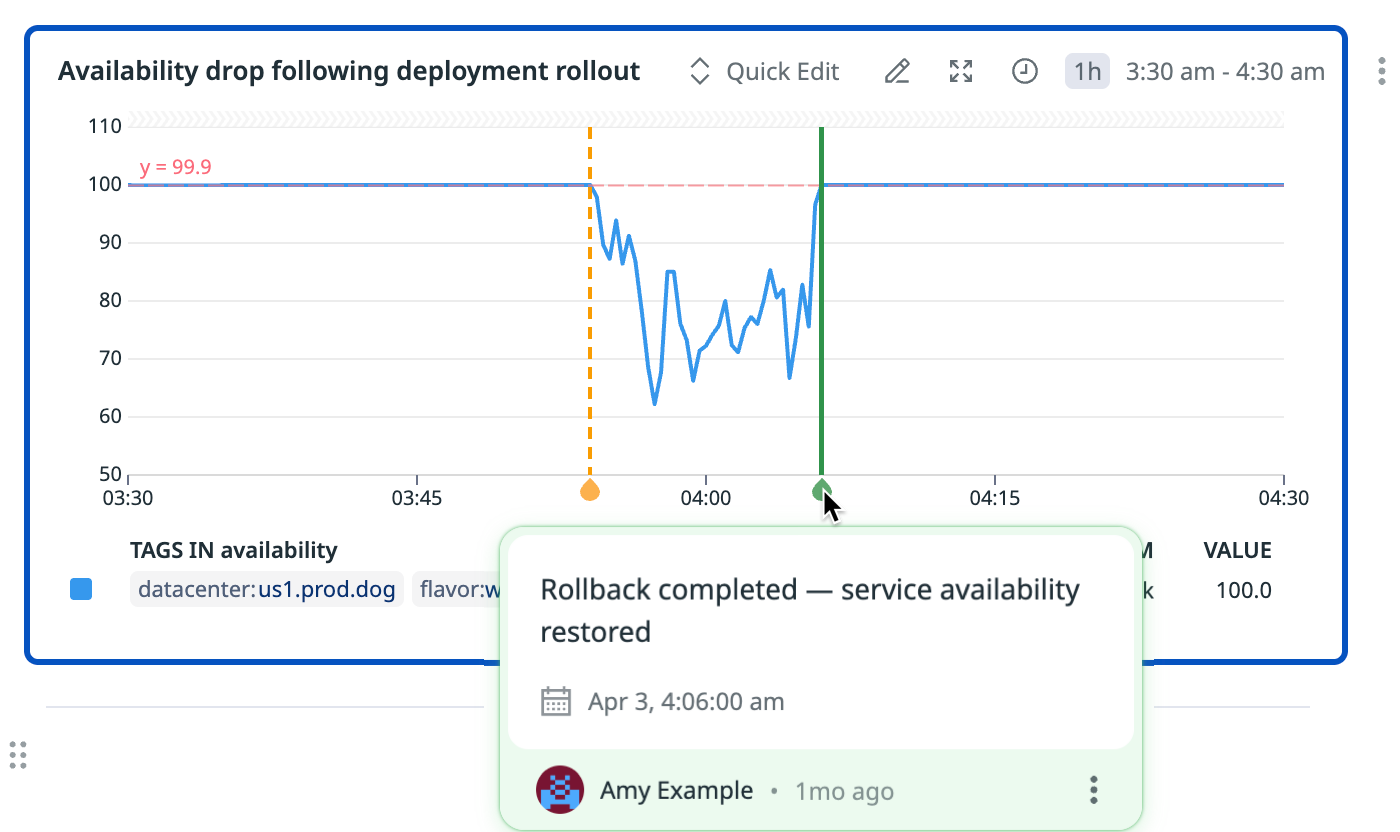
Annotations let you manually place vertical markers with descriptions on timeseries widgets. Adding annotations can be useful to visually call out key events like deploys, incidents, or spikes. Click any point in time and add a note.
Annotations are available in both dashboards and notebooks. If you export a widget from a dashboard to a notebook, any annotations you’ve added to the widget persist.
Adding an annotation
- Create an annotation by:
- Left-clicking anywhere on a timeseries widget and selecting Add annotation from the context menu that appears, or
- Clicking the x-axis on a timeseries graph
- Type your comment, and optionally click the timestamp field to manually adjust to the precise time you want to annotate.
- (Optional) Change the color of the annotation from the dropdown in the bottom left.
- Click Save.
Adding multiple annotations
To apply an annotation to multiple timeseries at once:
- Follow steps 1-4 in Adding an annotation to create an annotation.
- From the Applying to dropdown, choose All widgets or Selected widgets.
If you choose Selected widgets, you see a list of all the widgets in the dashboard or notebook and can check or uncheck the widgets you want to apply the annotation to. - Click Save.
Editing an annotation
To edit an annotation, hover over the annotation line, click the three dots menu, and choose Edit or Edit for all widgets.
Deleting an annotation
To delete an annotation you’ve created, hover over the annotation line, click the three dots menu, and choose Delete or Delete from all widgets.

