- Essentials
- Getting Started
- Agent
- API
- APM Tracing
- Containers
- Dashboards
- Database Monitoring
- Datadog
- Datadog Site
- DevSecOps
- Incident Management
- Integrations
- Internal Developer Portal
- Logs
- Monitors
- Notebooks
- OpenTelemetry
- Profiler
- Search
- Session Replay
- Security
- Serverless for AWS Lambda
- Software Delivery
- Synthetic Monitoring and Testing
- Tags
- Workflow Automation
- Learning Center
- Support
- Glossary
- Standard Attributes
- Guides
- Agent
- Integrations
- Extend Datadog
- Authorization
- DogStatsD
- Custom Checks
- Integrations
- Build an Integration with Datadog
- Create an Agent-based Integration
- Create an API-based Integration
- Create a Log Pipeline
- Integration Assets Reference
- Build a Marketplace Offering
- Create an Integration Dashboard
- Create a Monitor Template
- Create a Cloud SIEM Detection Rule
- Install Agent Integration Developer Tool
- Service Checks
- Community
- Guides
- OpenTelemetry
- Administrator's Guide
- API
- Partners
- Datadog Mobile App
- DDSQL Reference
- CoScreen
- CoTerm
- Remote Configuration
- Cloudcraft (Standalone)
- In The App
- Dashboards
- Notebooks
- DDSQL Editor
- Reference Tables
- Sheets
- Monitors and Alerting
- Service Level Objectives
- Metrics
- Watchdog
- Bits AI
- Internal Developer Portal
- Error Tracking
- Change Tracking
- Event Management
- Incident Response
- Actions & Remediations
- Infrastructure
- Cloudcraft
- Resource Catalog
- Universal Service Monitoring
- End User Device Monitoring
- Hosts
- Containers
- Processes
- Serverless
- Network Monitoring
- Storage Management
- Cloud Cost
- Application Performance
- APM
- Continuous Profiler
- Database Monitoring
- Agent Integration Overhead
- Setup Architectures
- Setting Up Postgres
- Setting Up MySQL
- Setting Up SQL Server
- Setting Up Oracle
- Setting Up Amazon DocumentDB
- Setting Up MongoDB
- Setting Up ClickHouse
- Connecting DBM and Traces
- Data Collected
- Exploring Database Hosts
- Exploring Query Metrics
- Exploring Query Samples
- Exploring Database Schemas
- Exploring Recommendations
- Troubleshooting
- Guides
- Data Streams Monitoring
- Data Observability
- Digital Experience
- Real User Monitoring
- Synthetic Testing and Monitoring
- Continuous Testing
- Product Analytics
- Session Replay
- Software Delivery
- CI Visibility
- CD Visibility
- Deployment Gates
- Test Optimization
- Code Coverage
- PR Gates
- DORA Metrics
- Feature Flags
- Developer Integrations
- Security
- Security Overview
- Cloud SIEM
- Code Security
- Cloud Security
- App and API Protection
- AI Guard
- Workload Protection
- Sensitive Data Scanner
- AI Observability
- Log Management
- Observability Pipelines
- Configuration
- Sources
- Processors
- Destinations
- Packs
- Akamai CDN
- Amazon CloudFront
- Amazon VPC Flow Logs
- AWS Application Load Balancer Logs
- AWS CloudTrail
- AWS Elastic Load Balancer Logs
- AWS Network Load Balancer Logs
- Cisco ASA
- Cloudflare
- F5
- Fastly
- Fortinet Firewall
- HAProxy Ingress
- Istio Proxy
- Juniper SRX Firewall Traffic Logs
- Netskope
- NGINX
- Okta
- Palo Alto Firewall
- Windows XML
- ZScaler ZIA DNS
- Zscaler ZIA Firewall
- Zscaler ZIA Tunnel
- Zscaler ZIA Web Logs
- Search Syntax
- Scaling and Performance
- Monitoring and Troubleshooting
- Guides and Resources
- Log Management
- CloudPrem
- Administration
- Account Management
- Data Security
- Help
- feature_flags_client
Code Coverage in Datadog
This product is not supported for your selected Datadog site. ().
This Test Optimization feature is legacy. Use the new dedicated Code Coverage product instead.
Overview
Code coverage is a measure of the total code coverage percentage that a module or session exercises.
Ensure that Test Optimization is already set up for your language.
Report code coverage
Compatibility
dd-trace>=4.45.0anddd-trace>=5.21.0.jest>=24.8.0, only when run withjest-circus.mocha>=5.2.0.cucumber-js>=7.0.0.vitest>=2.0.0.
Note: The DataDog Tracer does not generate code coverage. If your tests are run with code coverage enabled,
dd-trace reports it under the test.code_coverage.lines_pct tag for your test sessions automatically.Mocha/Cucumber-js
Only Istanbul code coverage is supported for mocha and cucumber-js.
To report total code coverage from your mocha and cucumber-js test sessions, install nyc and wrap your test commands:
- Install
nyc:
npm install --save-dev nyc
- Wrap your test commands with
nyc:
{
  "scripts": {
    "test": "mocha",
    "coverage": "nyc npm run test"
  }
}
Jest
Jest includes Istanbul by default, so you don’t need to install nyc. Simply pass --coverage:
{
  "scripts": {
    "coverage": "jest --coverage"
  }
}
The only supported coverageProvider is babel, which is the default.
Vitest
Vitest requires extra dependencies for running with code coverage. See vitest docs for more information. After the dependencies are installed, pass --coverage to your test command:
{
  "scripts": {
    "coverage": "vitest run --coverage"
  }
}
After modifying your test commands, run your tests with the new coverage command:
NODE_OPTIONS="-r dd-trace/ci/init" DD_ENV=ci DD_SERVICE=my-javascript-service npm run coverage
Compatibility
dd-trace>=2.31.0.
When code coverage is available, the Datadog Tracer (v2.31.0 or later) reports it under the test.code_coverage.lines_pct tag for your test sessions.
If you are using Coverlet to compute your code coverage, indicate the path to the report file in the DD_CIVISIBILITY_EXTERNAL_CODE_COVERAGE_PATH environment variable when running dd-trace. The report file must be in the OpenCover or Cobertura formats. Alternatively, you can enable the Datadog Tracer’s built-in code coverage calculation with the DD_CIVISIBILITY_CODE_COVERAGE_ENABLED=true environment variable.
Note: DD_CIVISIBILITY_EXTERNAL_CODE_COVERAGE_PATH is only used when the command instrumented by dd-trace ci run is dotnet test, dotnet vstest, or vstest.console. For example, the results in the variable are ignored when running dd-trace ci run -- coverlet TestAssembly.dll --target dotnet --targetargs "test TestAssembly.dll".
Advanced options
The Datadog Tracer’s built-in code coverage has support for both Coverlet and VS Code Coverage options through the .runsettings file.
File structure
<?xml version="1.0" encoding="utf-8"?>
<RunSettings>
    <DataCollectionRunSettings>
        <DataCollectors>
            <DataCollector friendlyName="DatadogCoverage">
                <Configuration>
                    <!-- Datadog Code Coverage settings -->
                    ...
                </Configuration>
            </DataCollector>
        </DataCollectors>
    </DataCollectionRunSettings>
</RunSettings>
Coverlet options
| Option | Summary |
|---|---|
| ExcludeByAttribute | Exclude methods, classes or assemblies decorated with attributes from code coverage. |
| ExcludeByFile | Exclude specific source files from code coverage. |
| Exclude | Exclude from code coverage analysis using filter expressions. |
Attributes
You can exclude a method, an entire class, or assembly from code coverage by creating and applying the ExcludeFromCodeCoverage attribute present in the System.Diagnostics.CodeAnalysis namespace.
Exclude additional attributes with the ExcludeByAttribute property and the short name of the attribute (the type name without the namespace).
Source files
Exclude specific source files from code coverage with the ExcludeByFile property.
- Use a single or multiple paths, separated by comma.
- Use the file path or directory path with a wildcard (
*), for example:dir1/*.cs.
Filters
Filters provide fine-grained control over what gets excluded using filter expressions with the following syntax:
[<ASSEMBLY_FILTER>]<TYPE_FILTER>
Wildcards are supported:
*=> matches zero or more characters?=> the prefixed character is optional
Examples:
[*]*=> Excludes all types in all assemblies (nothing is instrumented)[coverlet.*]Coverlet.Core.Coverage=> Excludes theCoverageclass in theCoverlet.Corenamespace belonging to any assembly that matchescoverlet.*(for example,coverlet.core)[*]Coverlet.Core.Instrumentation.*=> Excludes all types belonging to theCoverlet.Core.Instrumentationnamespace in any assembly[coverlet.*.tests?]*=> Excludes all types in any assembly starting withcoverlet.and ending with.testor.tests(the?makes thesoptional)[coverlet.*]*,[*]Coverlet.Core*\=> Excludes assemblies matchingcoverlet.*and excludes all types belonging to theCoverlet.Corenamespace in any assembly
VS code coverage options
See Customize code coverage analysis in the Microsoft documentation for additional information.
| Option | Summary |
|---|---|
| Attributes\Exclude | Exclude methods, classes, or assemblies decorated with attributes from code coverage. |
| Sources\Exclude | Exclude specific source files from code coverage. |
Runsettings example
<?xml version="1.0" encoding="utf-8"?>
<RunSettings>
    <DataCollectionRunSettings>
        <DataCollectors>
            <DataCollector friendlyName="DatadogCoverage">
                <Configuration>
                    <!-- Coverlet configuration -->
                    <ExcludeByAttribute>CompilerGeneratedAttribute</ExcludeByAttribute>
                    <ExcludeByFile>**/Fibonorial.cs</ExcludeByFile>
                    <Exclude>[myproject.*.tests?]*</Exclude>

                    <!-- VS Code Coverage configuration -->
                    <CodeCoverage>
                        <Attributes>
                            <Exclude>
                                <Attribute>^System\.ObsoleteAttribute$</Attribute>
                            </Exclude>
                        </Attributes>
                        <Sources>
                            <Exclude>
                                <Source>^MyFile\.cs$</Source>
                            </Exclude>
                        </Sources>
                    </CodeCoverage>
                </Configuration>
            </DataCollector>
        </DataCollectors>
    </DataCollectionRunSettings>
</RunSettings>
Compatibility
dd-trace-java >= 1.24.2.
When code coverage is available, the Datadog Tracer reports it under the test.code_coverage.lines_pct tag for your test sessions.
Jacoco is supported as a code coverage library.
If your project already has Jacoco configured, the Datadog Tracer instruments it and reports the coverage data to Datadog automatically.
Otherwise, you can configure the tracer to add Jacoco to your test runs at runtime.
Use DD_CIVISIBILITY_JACOCO_PLUGIN_VERSION environment variable to specify which version of Jacoco you want to have injected (for example: DD_CIVISIBILITY_JACOCO_PLUGIN_VERSION=0.8.11).
Compatibility
dd-trace>=2.5.0.Python>=3.7.coverage>=4.4.2.pytest>=3.0.0.pytest-cov>=2.7.0.unittest>=3.8.- Only
coverage.pyandpytest-covcode coverage are supported.
When tests are instrumented with coverage.py or pytest-cov, the Datadog Tracer reports code coverage under the test.code_coverage.lines_pct tag for your test sessions automatically.
To report total code coverage from your test sessions with coverage.py, follow these steps:
- Install
coverage:
python3 -m pip install coverage
- Run your test with the new
coveragecommand:
DD_ENV=ci DD_SERVICE=my-python-service coverage run -m pytest
Alternatively, to report total code coverage from your test sessions with pytest-cov, follow these steps:
- Install
pytest:
python3 -m pip install pytest
- Install
pytest-cov:
python3 -m pip install pytest-cov
- Run your test by appending the
--covflag to yourpytestcommand:
DD_ENV=ci DD_SERVICE=my-python-service pytest --cov
Compatibility
datadog-ci-rb>=1.7.0simplecov>=0.18.0.
Note: The DataDog library does not generate total code coverage. If your tests are run with code coverage enabled,
datadog-ci-rb reports it under the test.code_coverage.lines_pct tag for your test sessions automatically.If your project has simplecov configured, the datadog-ci-rb library instruments it and reports the coverage data to Datadog automatically under the test.code_coverage.lines_pct tag for your test sessions.
This feature is enabled by default. Use DD_CIVISIBILITY_SIMPLECOV_INSTRUMENTATION_ENABLED environment variable to disable this feature (for example: DD_CIVISIBILITY_SIMPLECOV_INSTRUMENTATION_ENABLED=0).
Compatibility
go test -cover
Note: The DataDog library does not generate total code coverage. If your tests are run with code coverage enabled,
dd-trace-go reports it under the test.code_coverage.lines_pct tag for your test sessions automatically.If your tests are executed with the -cover flag, the Datadog library instruments it and automatically reports the coverage data to Datadog under the test.code_coverage.lines_pct tag for your test sessions.
Compatibility
dd-sdk-swift-testing>=2.5.3.Xcode>=14.3.
When code coverage is enabled, the Datadog Tracer reports it under the test.code_coverage.lines_pct tag for your test sessions.
To enable code coverage for Xcode projects you can follow this guide from Apple: Enable code coverage in your test plan.
For SPM tests, add the --enable-code-coverage parameter to your swift test invocation.
Compatibility
datadog-ci>=2.17.2.
You can upload a code coverage percentage value when using JUnit Report uploads:
datadog-ci junit upload --service <service_name> --report-measures=test.code_coverage.lines_pct:85 <path>
In this example, 85 is the percentage of lines covered by your tests and needs to be generated with a different tool.
The code coverage report needs to be generated in a different process, otherwise the JUnit report uploads will not generate code coverage reports. The reported metric name must be test.code_coverage.lines_pct.
Graph code coverage
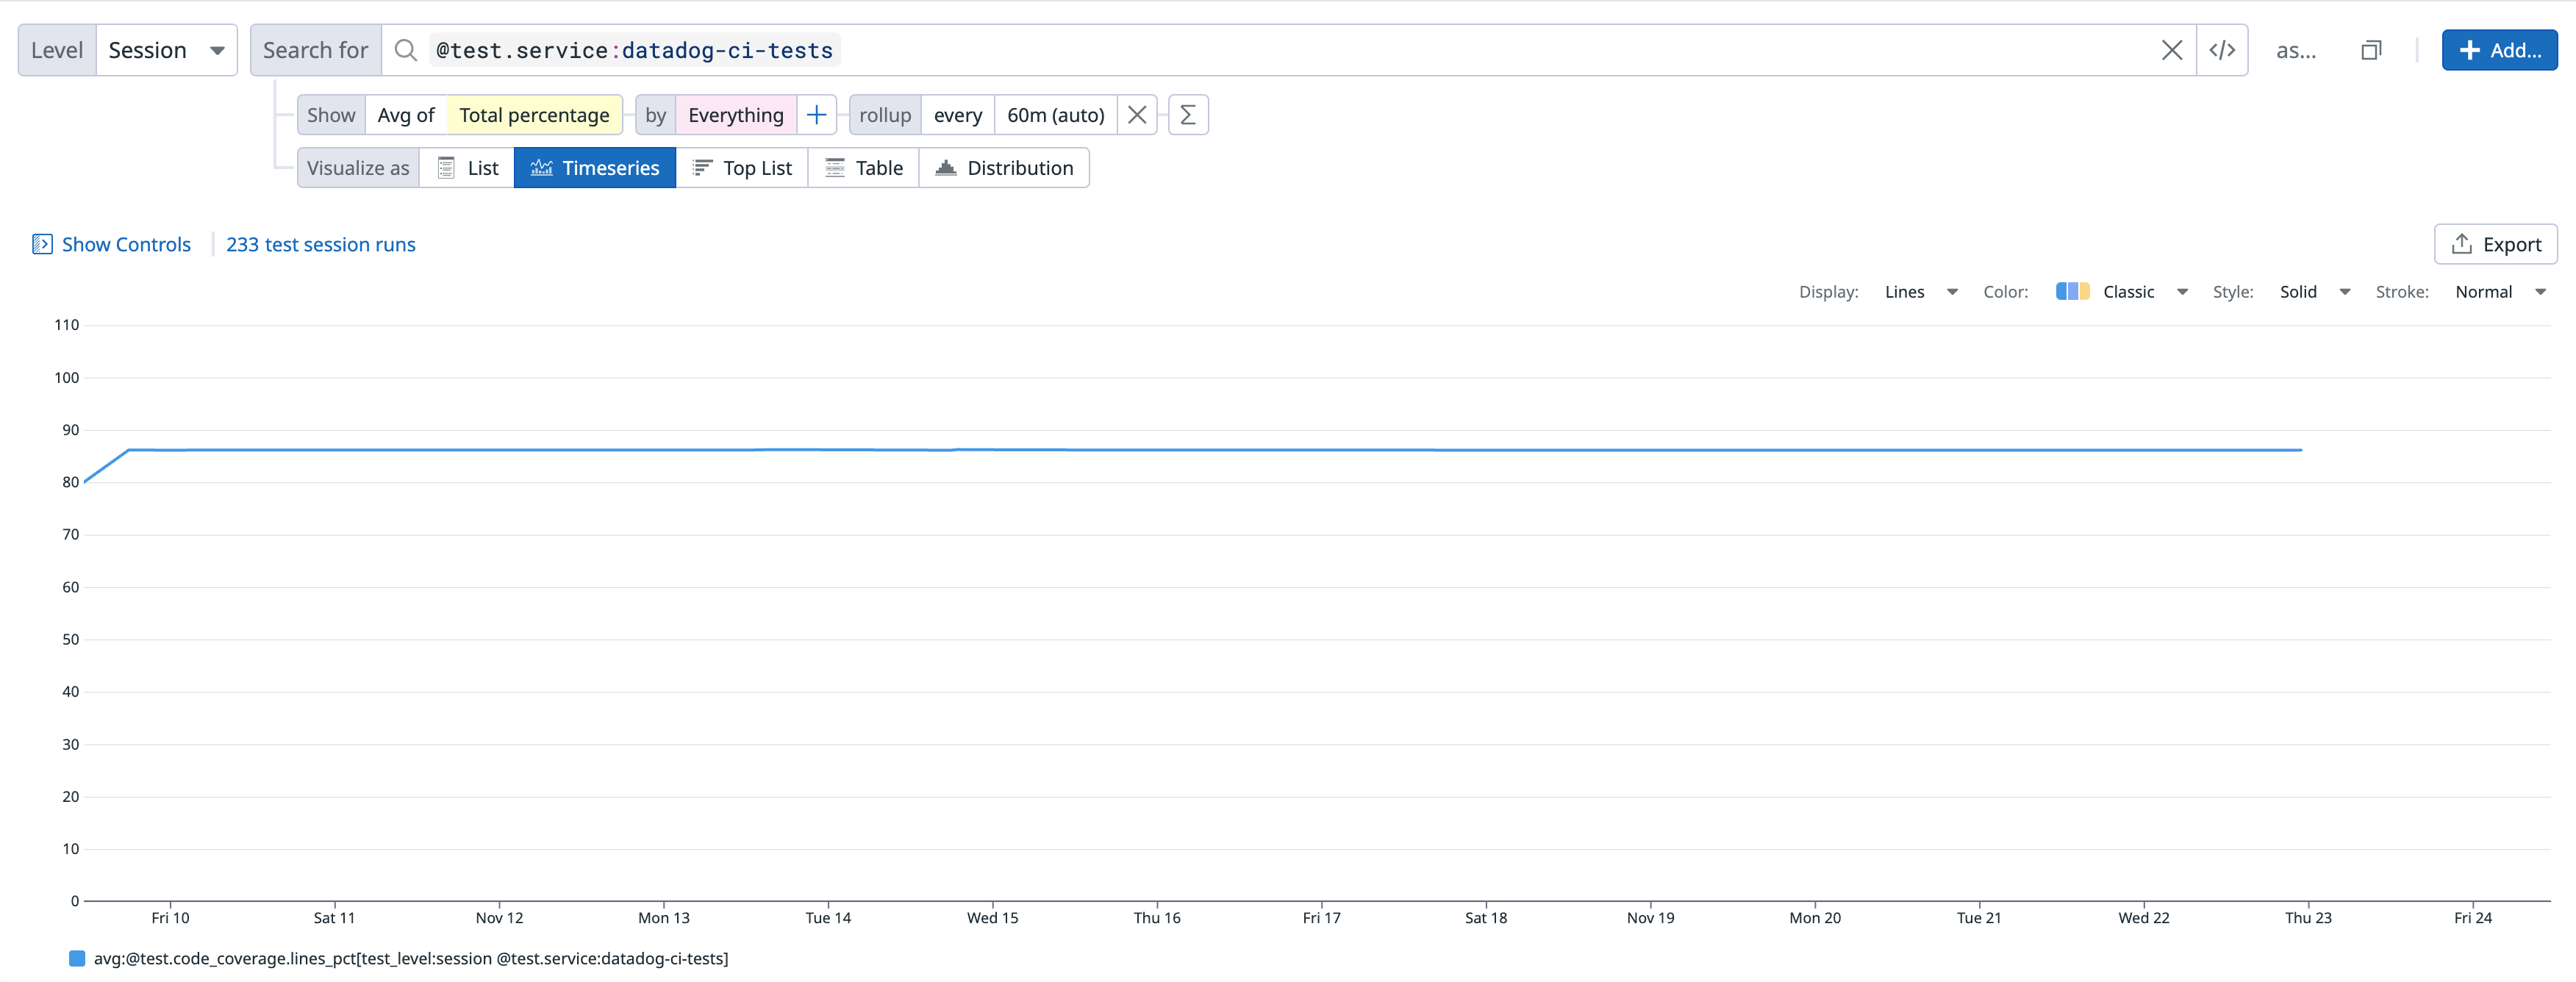
Reported code coverage is reported as @test.code_coverage.lines_pct, which represents the total percentage in the facet, and can be plotted as any other measure facet in the CI Visibility Explorer.
Test Session coverage tab
Reported code coverage also appears on the Coverage tab in a test session’s details page:
Export your graph
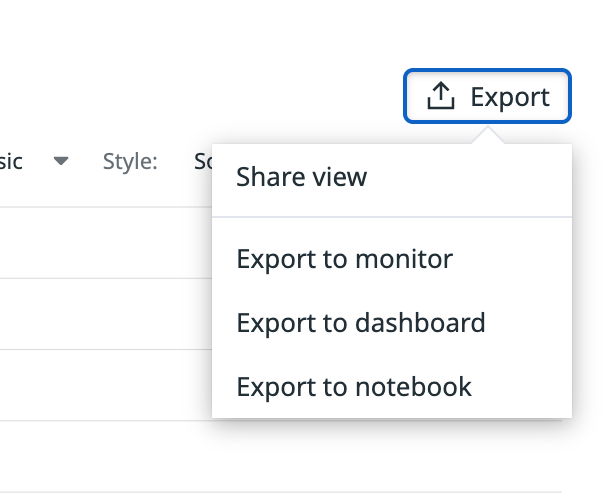
You can export your graph to a dashboard or a notebook, and create a monitor based on it by clicking the Export button:
Add a monitor
Get alerted whenever code coverage for your service drops below a certain threshold by creating a CI Test Monitor:
See your branch’s code coverage evolution
You can also see the code coverage’s evolution on the Branch Overview page and check whether it’s improving or worsening:
Show code coverage change of a pull request
The pull request’s test summary comment shows the code coverage change of a GitHub pull request compared to the default branch.
Test Impact Analysis and total code coverage
Test Impact Analysis does not automatically provide total code coverage measurements, even though it requires per test code coverage to function.
Further reading
Additional helpful documentation, links, and articles:


