- Essentials
- Getting Started
- Agent
- API
- APM Tracing
- Containers
- Dashboards
- Database Monitoring
- Datadog
- Datadog Site
- DevSecOps
- Incident Management
- Integrations
- Internal Developer Portal
- Logs
- Monitors
- Notebooks
- OpenTelemetry
- Profiler
- Search
- Session Replay
- Security
- Serverless for AWS Lambda
- Software Delivery
- Synthetic Monitoring and Testing
- Tags
- Workflow Automation
- Learning Center
- Support
- Glossary
- Standard Attributes
- Guides
- Agent
- Integrations
- Developers
- Authorization
- DogStatsD
- Custom Checks
- Integrations
- Build an Integration with Datadog
- Create an Agent-based Integration
- Create an API-based Integration
- Create a Log Pipeline
- Integration Assets Reference
- Build a Marketplace Offering
- Create an Integration Dashboard
- Create a Monitor Template
- Create a Cloud SIEM Detection Rule
- Install Agent Integration Developer Tool
- Service Checks
- IDE Plugins
- Community
- Guides
- OpenTelemetry
- Administrator's Guide
- API
- Partners
- Datadog Mobile App
- DDSQL Reference
- CoScreen
- CoTerm
- Remote Configuration
- Cloudcraft (Standalone)
- In The App
- Dashboards
- Notebooks
- DDSQL Editor
- Reference Tables
- Sheets
- Monitors and Alerting
- Service Level Objectives
- Metrics
- Watchdog
- Bits AI
- Internal Developer Portal
- Error Tracking
- Change Tracking
- Event Management
- Incident Response
- Actions & Remediations
- Infrastructure
- Cloudcraft
- Resource Catalog
- Universal Service Monitoring
- End User Device Monitoring
- Hosts
- Containers
- Processes
- Serverless
- Network Monitoring
- Storage Management
- Cloud Cost
- Application Performance
- APM
- Continuous Profiler
- Database Monitoring
- Agent Integration Overhead
- Setup Architectures
- Setting Up Postgres
- Setting Up MySQL
- Setting Up SQL Server
- Setting Up Oracle
- Setting Up Amazon DocumentDB
- Setting Up MongoDB
- Connecting DBM and Traces
- Data Collected
- Exploring Database Hosts
- Exploring Query Metrics
- Exploring Query Samples
- Exploring Database Schemas
- Exploring Recommendations
- Troubleshooting
- Guides
- Data Streams Monitoring
- Data Observability
- Digital Experience
- Real User Monitoring
- Synthetic Testing and Monitoring
- Continuous Testing
- Product Analytics
- Session Replay
- Software Delivery
- CI Visibility
- CD Visibility
- Deployment Gates
- Test Optimization
- Code Coverage
- PR Gates
- DORA Metrics
- Feature Flags
- Security
- Security Overview
- Cloud SIEM
- Code Security
- Cloud Security
- App and API Protection
- AI Guard
- Workload Protection
- Sensitive Data Scanner
- AI Observability
- Log Management
- Observability Pipelines
- Configuration
- Sources
- Processors
- Destinations
- Packs
- Akamai CDN
- Amazon CloudFront
- Amazon VPC Flow Logs
- AWS Application Load Balancer Logs
- AWS CloudTrail
- AWS Elastic Load Balancer Logs
- AWS Network Load Balancer Logs
- Cisco ASA
- Cloudflare
- F5
- Fastly
- Fortinet Firewall
- HAProxy Ingress
- Istio Proxy
- Juniper SRX Firewall Traffic Logs
- Netskope
- NGINX
- Okta
- Palo Alto Firewall
- Windows XML
- ZScaler ZIA DNS
- Zscaler ZIA Firewall
- Zscaler ZIA Tunnel
- Zscaler ZIA Web Logs
- Search Syntax
- Scaling and Performance
- Monitoring and Troubleshooting
- Guides and Resources
- Log Management
- CloudPrem
- Administration
Search and Manage CI Pipelines
This product is not supported for your selected Datadog site. ().
Overview
The Pipelines page is useful for developers who want to keep an eye on the build pipeline for their service.
This page answers the following questions:
- Is the pipeline for your service performant and reliable, especially on the default branch?
- If not, what’s the root cause?
You can access high-level accumulation and trends, including:
- An overview of the health of the whole build system, with aggregated stats for pipeline runs and branches.
- A window to quickly spotting and fixing immediate, urgent issues like broken pipelines to production.
- How each pipeline has run, over time, and with what results and trends.
- The breakdown of where time is spent in each build stage, over time, so you can focus your improvement efforts where it makes the biggest difference.
Search for pipelines
To see your pipelines, navigate to Software Delivery > CI Visibility > CI Pipeline List.
The Pipelines page shows aggregate stats for the default branch of each pipeline over the selected time frame, as well as the status of the latest pipeline execution. Use this page to see all your pipelines and get a quick view of their health. Only pipelines with Git information associated to the default branch (usually named main or prod), as well as pipelines without any Git information, are displayed on this page.
The metrics shown include build frequency, failure rate, median duration, and change in median duration on both an absolute and relative basis. This information reveals which pipelines are high-usage and potentially high-resource consumers, or are experiencing regressions. The last build result, duration, and last runtime shows you the effect of the last commit.
You can filter the page by pipeline name to see the pipelines you’re most concerned with. Click on a pipeline that is slow or failing to dig into details that show what commit might have introduced the performance regression or build error. If you are using Datadog Teams, you can filter for specific pipelines associated to your team using custom tags that match team handles.
Pipeline details and executions
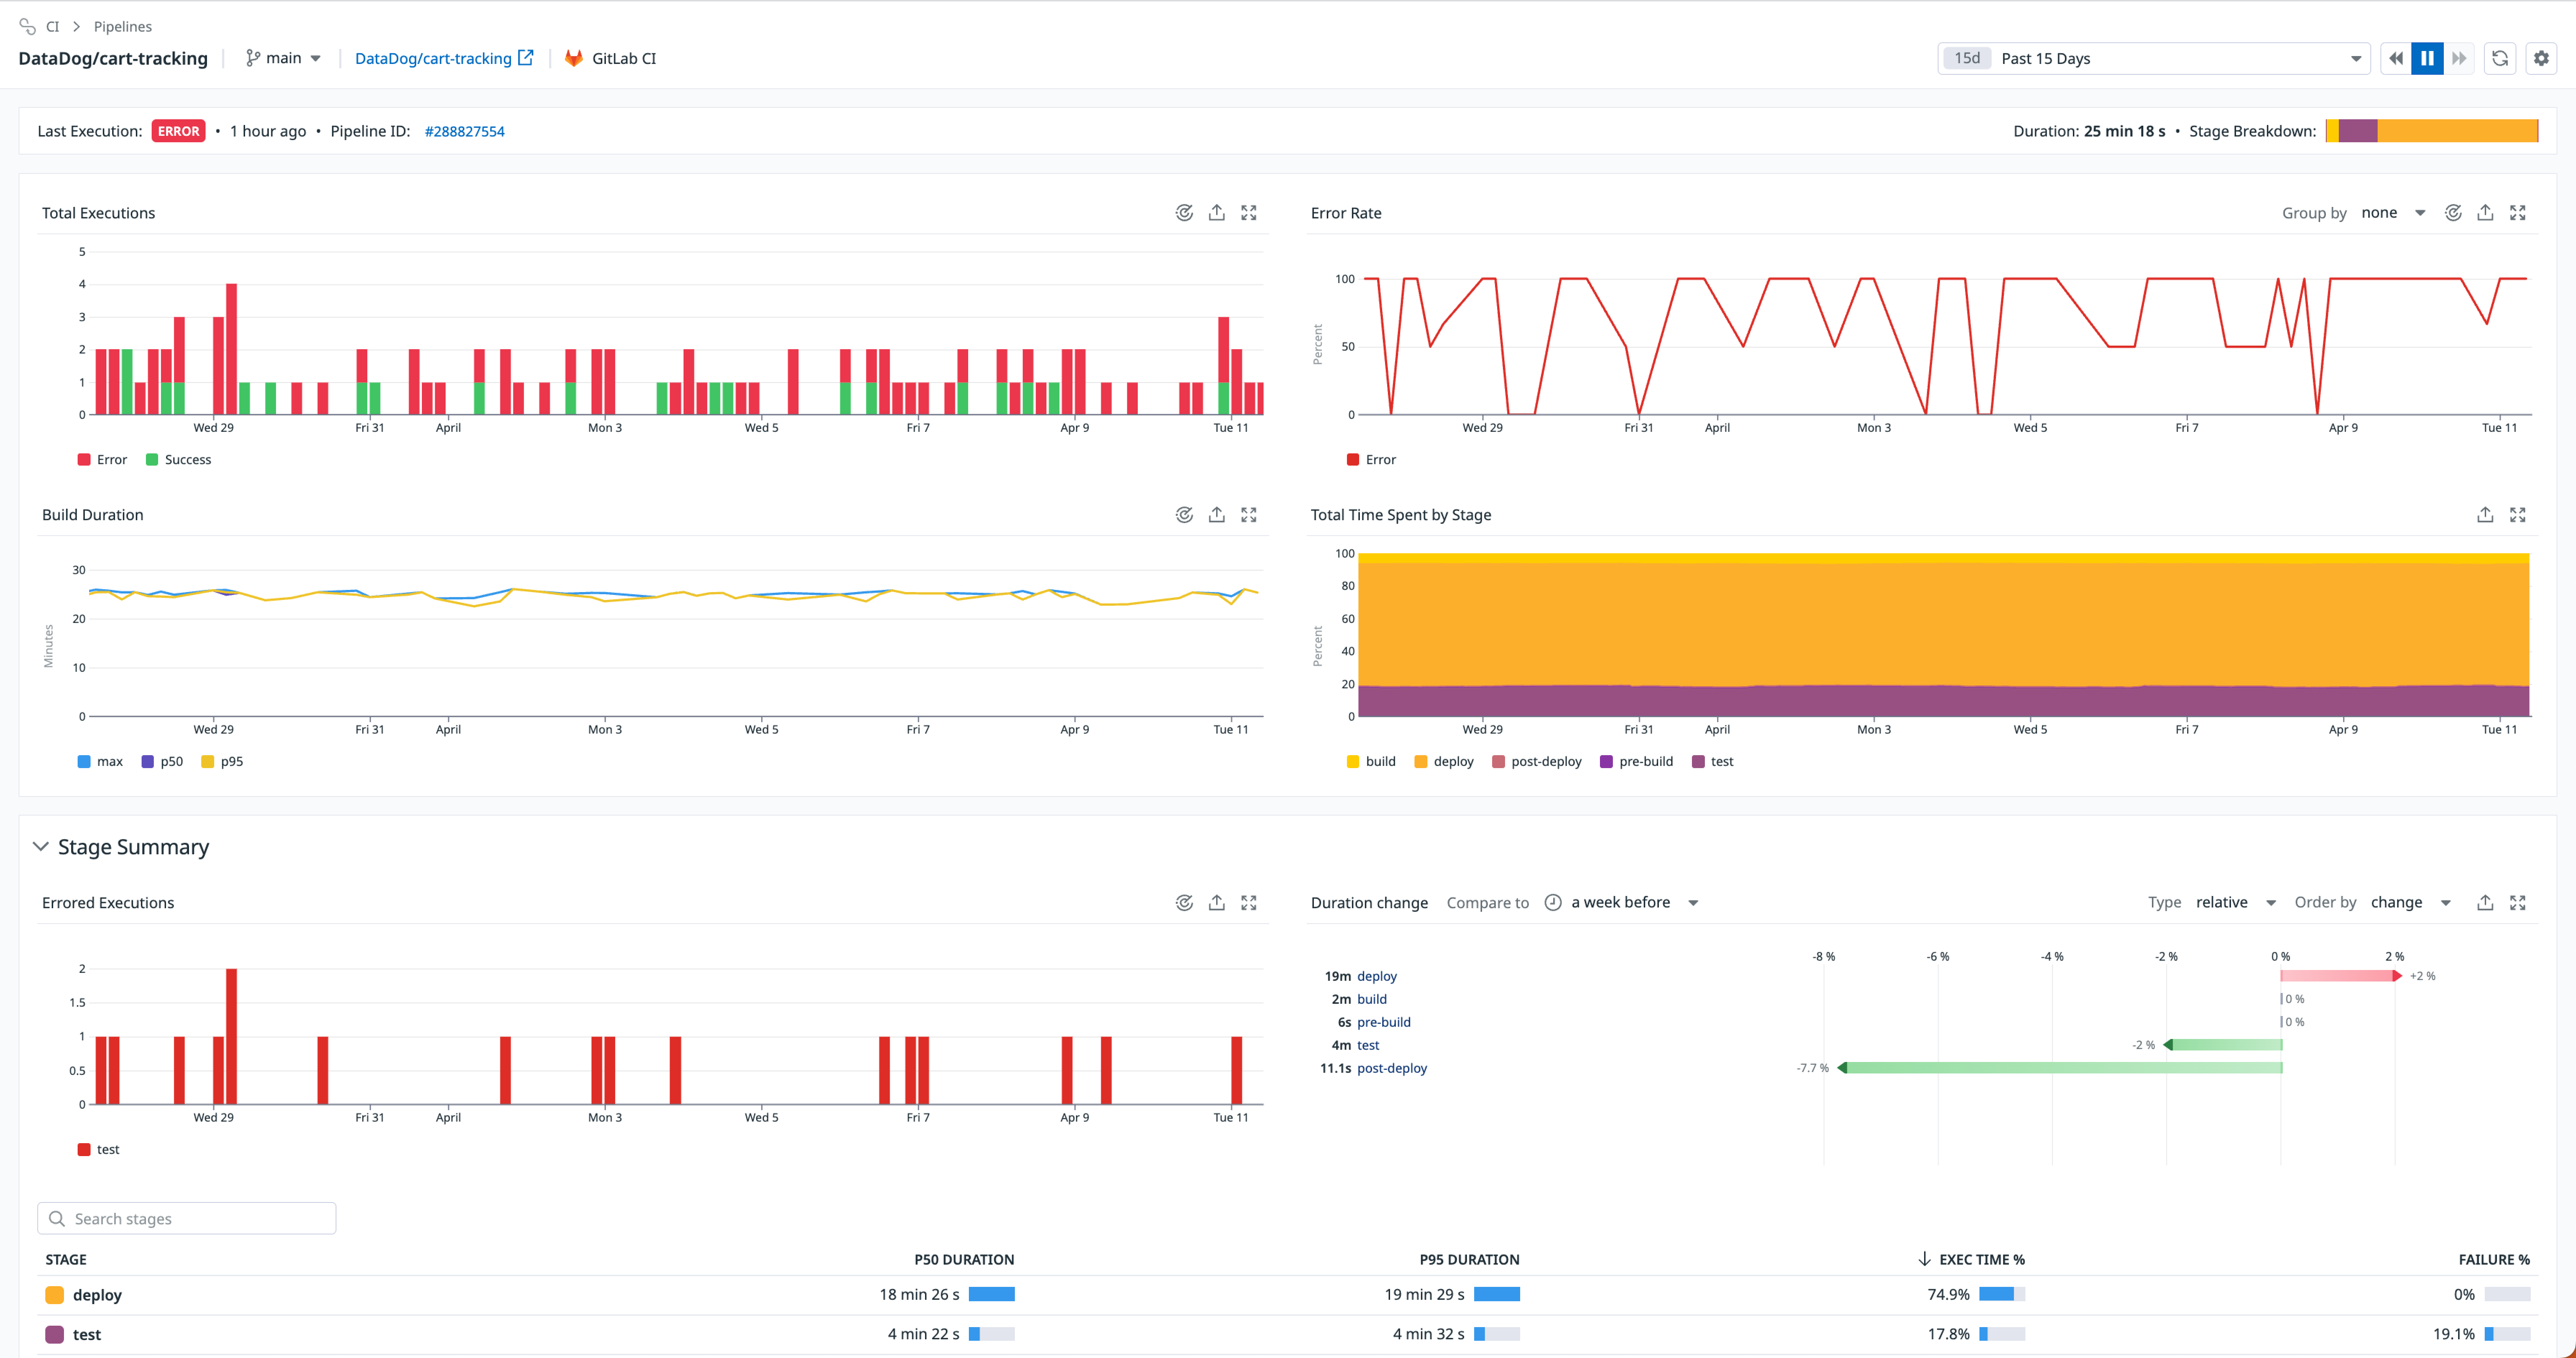
Click into a specific pipeline to see the Pipeline Details page which provides views of the data for the pipeline you selected over a specified time frame.
Get insights on the selected pipeline such as total and failed executions over time, build duration percentiles, error rates, and total time spent breakdown by stage. There are also summary tables for stages and jobs so you can quickly sort them in terms of duration, percentage of overall execution time, or failure rate.
The pipeline execution list shows all the times that pipeline (or its stages or jobs) ran during the selected time frame, for the selected branch. Use the facets on the left side to filter the list to exactly the pipelines, stages, or jobs you want to see.
Highlight critical path
To highlight the critical path on the trace, click on the Critical path checkbox on the pipeline execution page.
The critical path highlights the spans that you need to speed up if you want to reduce the overall execution time of your pipeline. If a CI job is on the critical path, it means it is part of the longest path through the trace in terms of execution time. Speeding up the CI Jobs on the critical path is strictly necessary to speed up the CI pipeline.
You can use this guide to identify the CI jobs on the critical path to help you determine which jobs to prioritize in order to reduce the overall duration of the CI pipelines.
Explore connections to services, resources, and network events
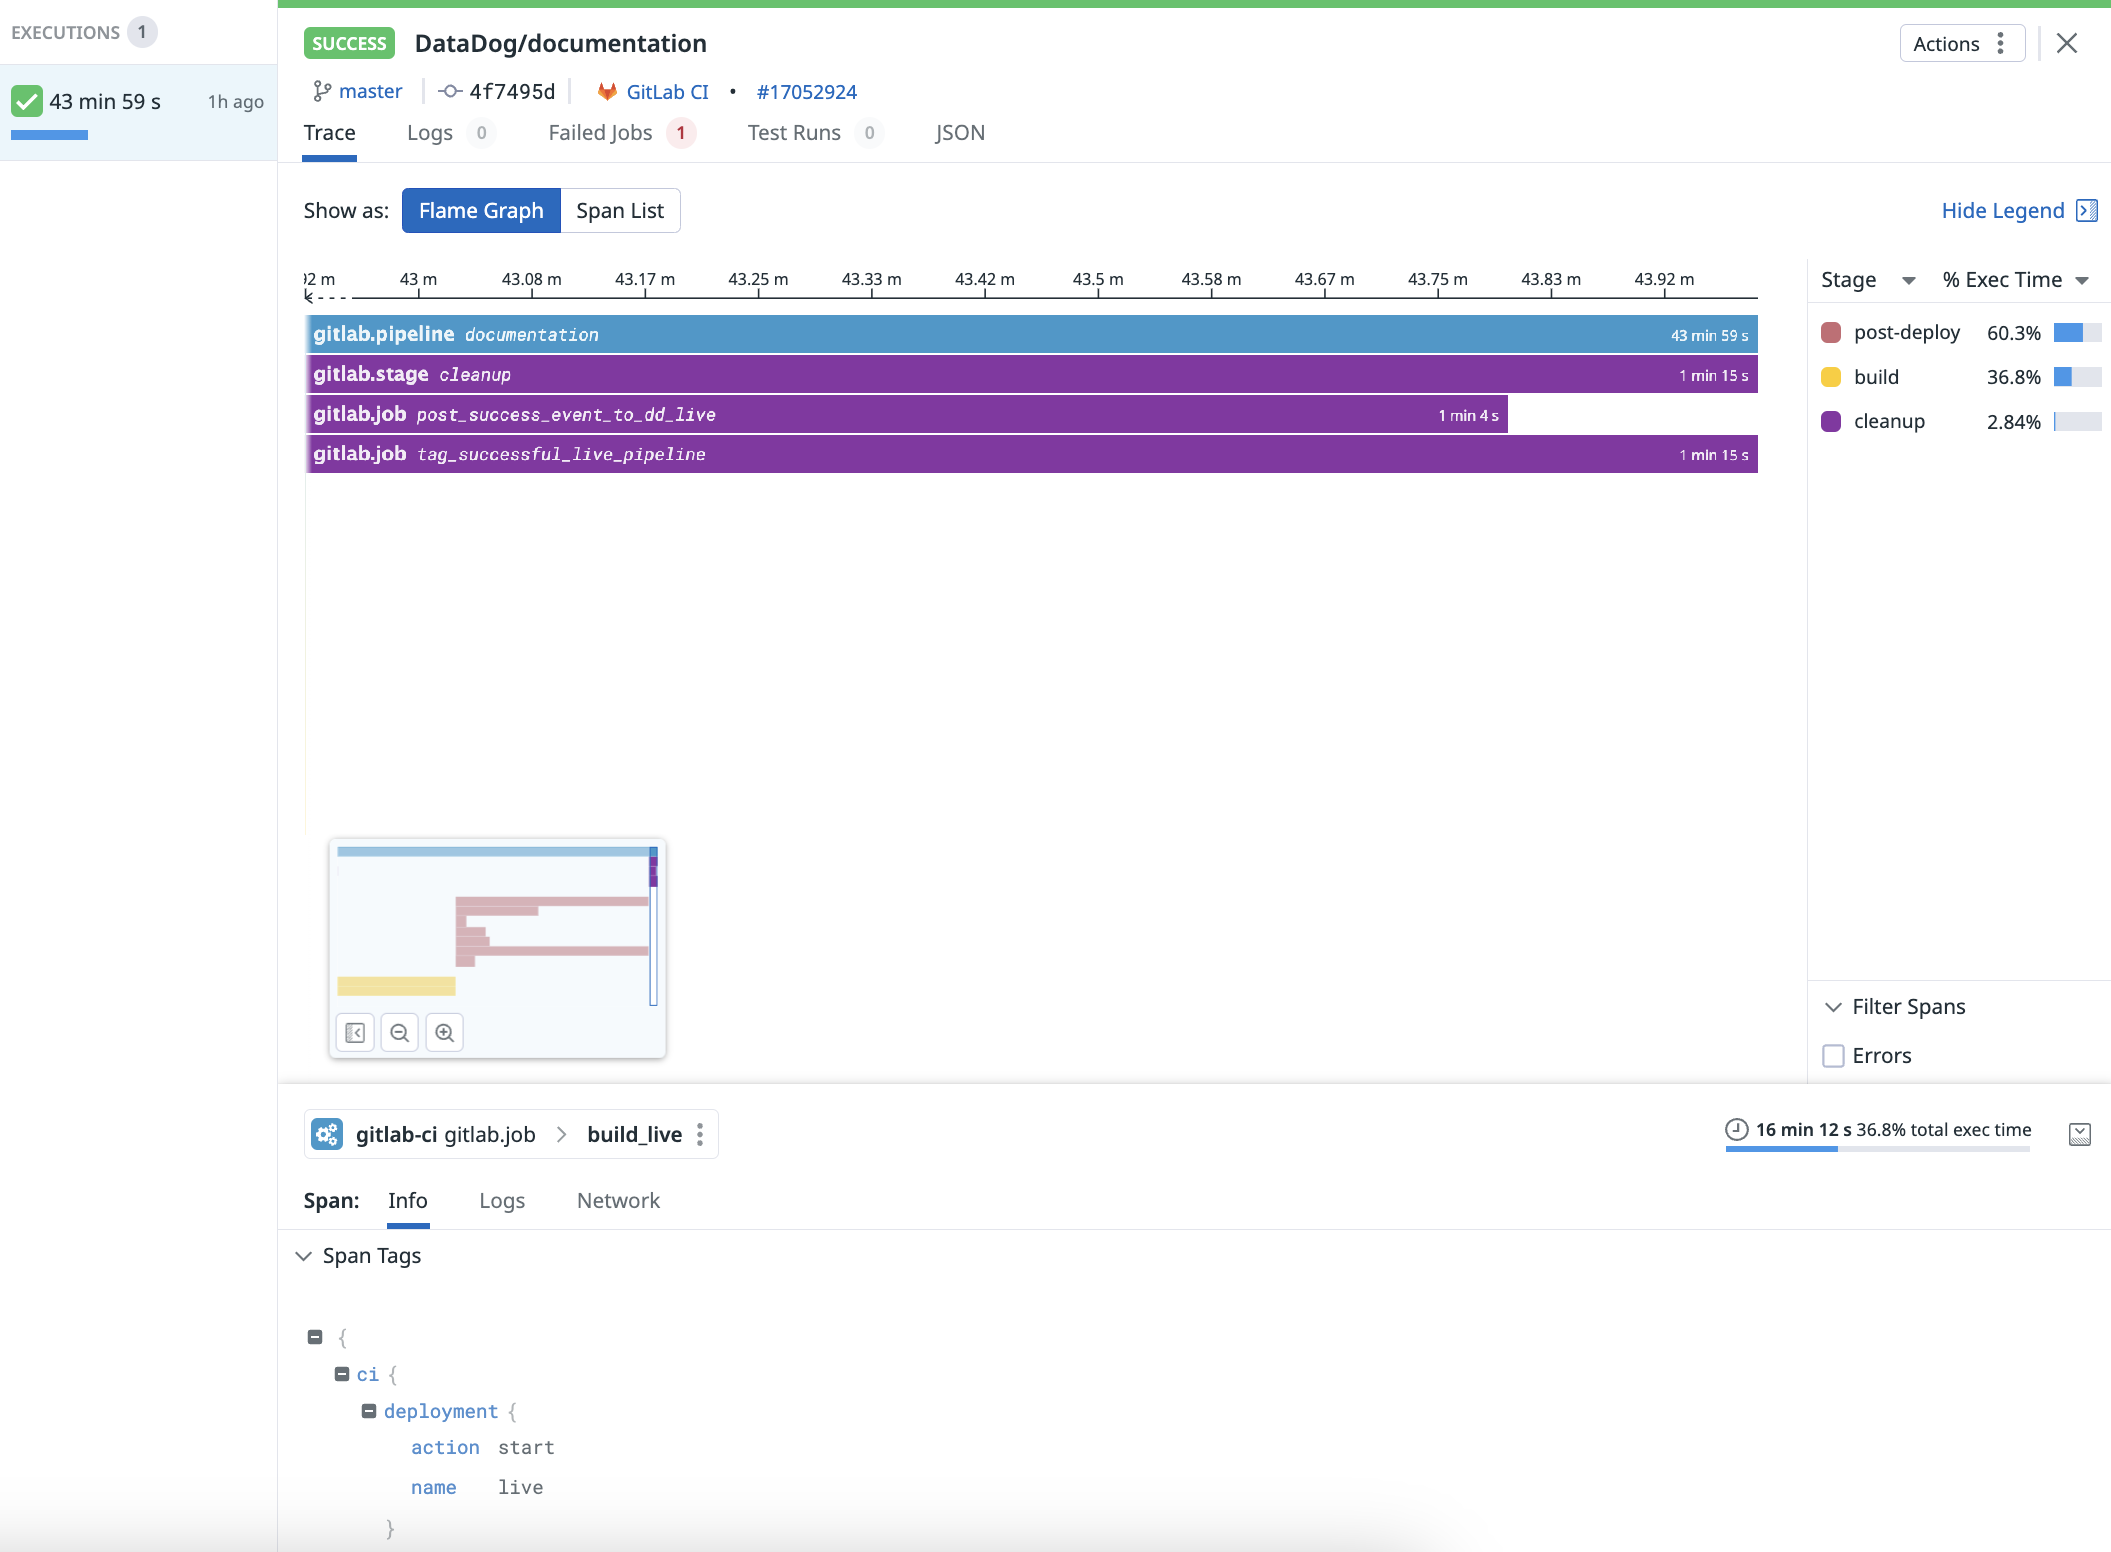
Click one of the executions to open the pipeline execution view and see the flame graph or span list for the pipeline and its stages. The Executions (n) list on the left side gives you quick access to the data for each retry of the pipeline for the same commit.
Click the CI provider link (gitlab-ci gitlab.pipeline > documentation in the following image) to investigate the Resource, Service, or Analytics page for the pipeline, stage, or job specifically. You can also find complete tags information and links to network monitoring events.
Explore connections to logs
If job log collection is supported and enabled for the CI provider, related log events can be found in the Logs tab of the pipeline execution view.
Job log collection is supported for the following providers:
CI jobs failure analysis based on relevant logs
CI Visibility uses an LLM model to generate enhanced error messages and categorize them with a domain and subdomain, based on the relevant logs collected from every failed CI job.
Use CI jobs failure analysis to identify the most common root causes of failure for your CI jobs.
Further reading
Additional helpful documentation, links, and articles:


