- Agents
- Essentials
- Getting Started
- Agent
- API
- APM Tracing
- Containers
- Dashboards
- Database Monitoring
- Datadog
- Datadog Site
- DevSecOps
- Incident Management
- Integrations
- Internal Developer Portal
- Logs
- Monitors
- Notebooks
- OpenTelemetry
- Profiler
- Search
- Session Replay
- Security
- Serverless for AWS Lambda
- Software Delivery
- Synthetic Monitoring and Testing
- Tags
- Workflow Automation
- Learning Center
- Support
- Glossary
- Standard Attributes
- Guides
- Agent
- Integrations
- Extend Datadog
- Authorization
- DogStatsD
- Custom Checks
- Integrations
- Build an Integration with Datadog
- Create an Agent-based Integration
- Create an API-based Integration
- Create a Log Pipeline
- Integration Assets Reference
- Build a Marketplace Offering
- Create an Integration Dashboard
- Create a Monitor Template
- Create a Cloud SIEM Detection Rule
- Install Agent Integration Developer Tool
- Service Checks
- Community
- Guides
- OpenTelemetry
- Administrator's Guide
- API
- Partners
- Datadog Mobile App
- DDSQL Reference
- CoScreen
- CoTerm
- Remote Configuration
- Cloudcraft (Standalone)
- In The App
- Dashboards
- Notebooks
- DDSQL Editor
- Reference Tables
- Sheets
- Monitors and Alerting
- Service Level Objectives
- Metrics
- Watchdog
- Bits AI
- Internal Developer Portal
- Error Tracking
- Change Tracking
- Event Management
- Incident Response
- Actions & Remediations
- Infrastructure
- Cloudcraft
- Resource Catalog
- Universal Service Monitoring
- End User Device Monitoring
- Hosts
- Containers
- Processes
- Serverless
- Network Monitoring
- Storage Management
- Cloud Cost
- Application Performance
- APM
- Continuous Profiler
- Database Monitoring
- Agent Integration Overhead
- Setup Architectures
- Setting Up Postgres
- Setting Up MySQL
- Setting Up SQL Server
- Setting Up Oracle
- Setting Up Amazon DocumentDB
- Setting Up MongoDB
- Setting Up ClickHouse
- Connecting DBM and Traces
- Data Collected
- Exploring Database Hosts
- Exploring Query Metrics
- Exploring Query Samples
- Exploring Database Schemas
- Exploring Recommendations
- Troubleshooting
- Guides
- Data Streams Monitoring
- Data Observability
- Digital Experience
- Real User Monitoring
- Synthetic Testing and Monitoring
- Continuous Testing
- Experiments
- Product Analytics
- Session Replay
- Software Delivery
- CI Visibility
- CD Visibility
- Deployment Gates
- Test Optimization
- Code Coverage
- PR Gates
- DORA Metrics
- Feature Flags
- Developer Integrations
- Security
- Security Overview
- Cloud SIEM
- Code Security
- Cloud Security
- App and API Protection
- AI Guard
- Workload Protection
- Sensitive Data Scanner
- AI Observability
- Log Management
- Observability Pipelines
- Configuration
- Sources
- Processors
- Destinations
- Packs
- Akamai CDN
- Amazon CloudFront
- Amazon VPC Flow Logs
- AWS Application Load Balancer Logs
- AWS CloudTrail
- AWS Elastic Load Balancer Logs
- AWS Network Load Balancer Logs
- Cisco ASA
- Cloudflare
- F5
- Fastly
- Fortinet Firewall
- HAProxy Ingress
- Istio Proxy
- Juniper SRX Firewall Traffic Logs
- Netskope
- NGINX
- Okta
- Palo Alto Firewall
- Windows XML
- ZScaler ZIA DNS
- Zscaler ZIA Firewall
- Zscaler ZIA Tunnel
- Zscaler ZIA Web Logs
- Search Syntax
- Scaling and Performance
- Monitoring and Troubleshooting
- Guides and Resources
- Log Management
- CloudPrem
- Administration
Anomalies Page
Overview
Datadog Cloud Cost Management (CCM) continuously monitors your environment to detect and prioritize unexpected cost changes, enabling you to share, investigate, and resolve anomalies. Cost anomalies are available for AWS, Azure, Google Cloud, Oracle Cloud, Datadog, Anthropic, and OpenAI and do not require any additional setup after CCM is set up.
A typical workflow could be the following:
- View anomalies on the Anomalies tab
- Investigate using Watchdog Explains to understand what’s driving the cost changes
- Share with engineering teams who can take action by reviewing details, investigating further, or setting up monitoring
- Resolve anomalies that are expected or not significant
How anomalies are defined
Anomalies are significant, unexpected changes that stand out from typical patterns. Datadog automatically identifies anomalies using machine learning techniques that adapt to your specific usage patterns.
To distinguish between true anomalies and expected fluctuations, Datadog’s algorithm:
- Recognizes recurring cost spikes and dips, such as a cost increase every Monday, or a spike on the fourth day of every month
- Focuses on engineering usage (excludes taxes, credits, refunds, and Reserved Instance fees)
- Filters out low-impact anomalies to reduce noise
View cost anomalies
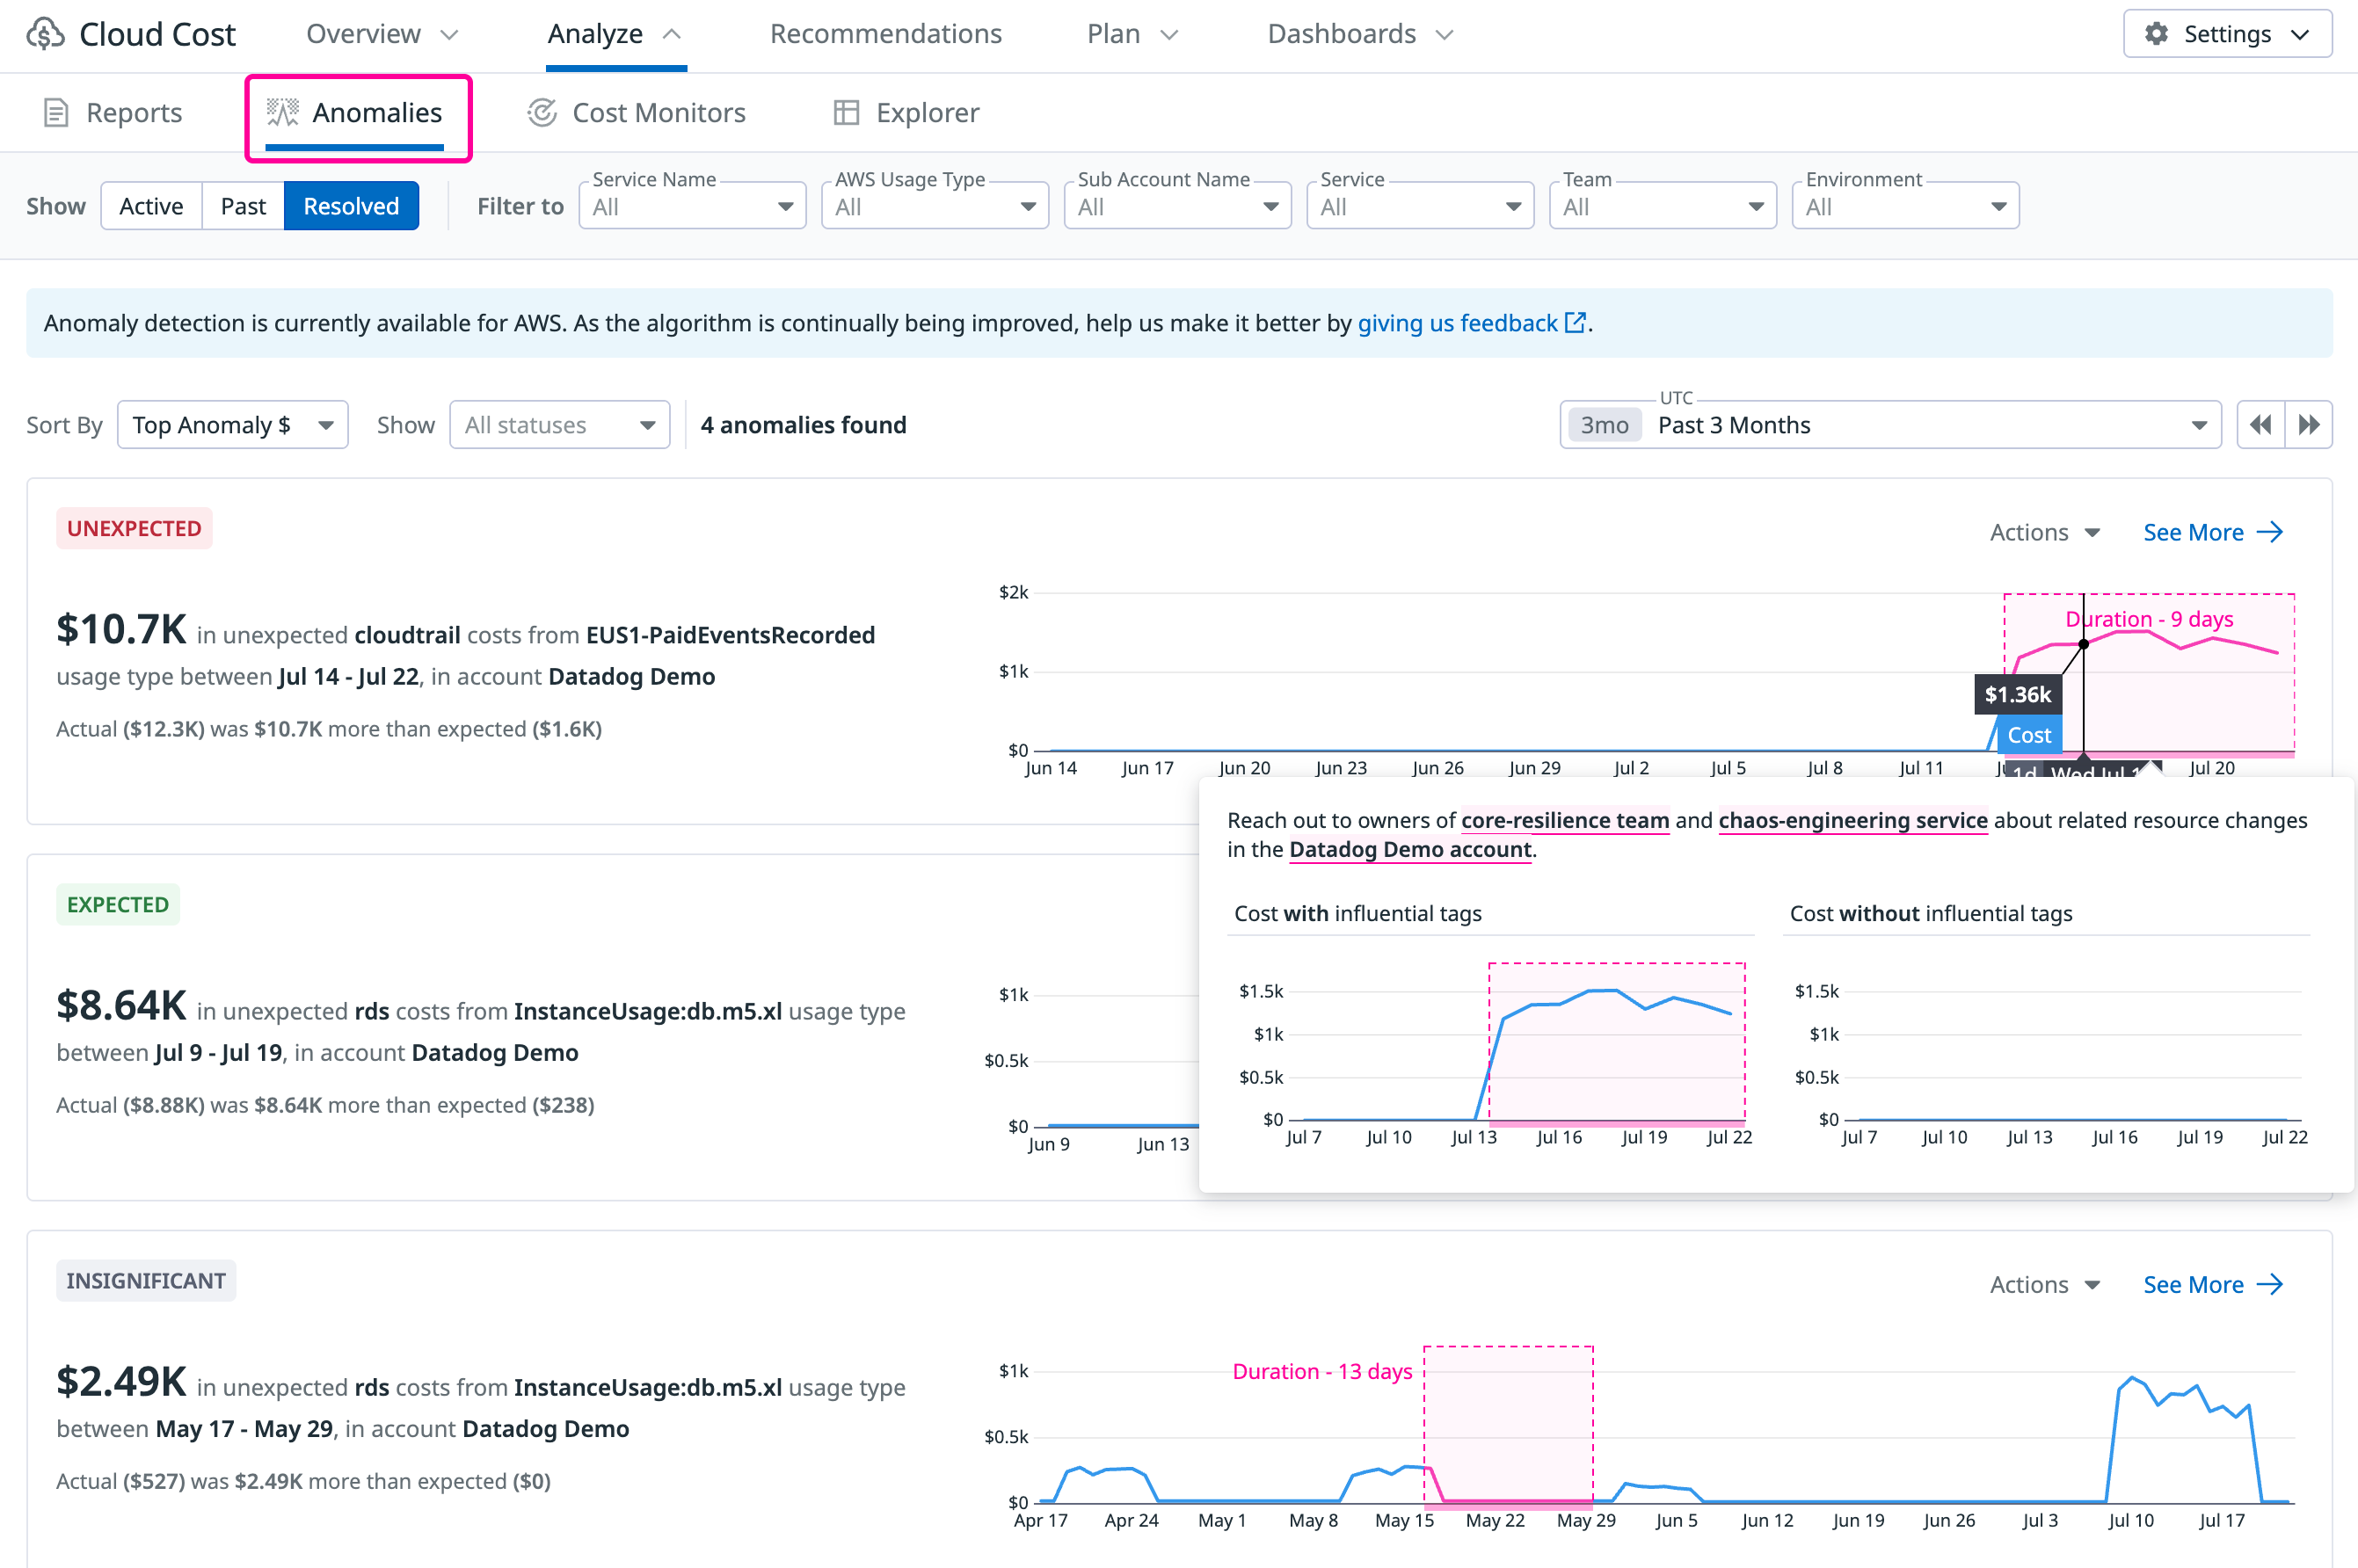
On the Anomalies tab of the Cloud Cost page in Datadog, you can view and filter anomalies:
- Active: Anomalies from the last full day of cost data (typically 2-3 days prior).
- Past: Anomalies that lasted more than 7 days or are no longer detected as anomalous. Past anomalies can be useful to report on, but are often less urgent and actionable.
- Resolved: Anomalies that you’ve marked as resolved with context.
Each anomaly card shows:
- Service name (
rds, for example) - Usage type
- Cloud accounts affected
- Expected vs. actual costs
- Cost trend graph (past 1 month)
Anomalies are sorted by cost impact, with the most significant changes at the top.
Investigate anomalies
Understand what drives anomalies
CCM automatically uses Watchdog Explains, an investigation assistant, to help you identify what is driving cost anomalies. Watchdog Explains analyzes and identifies the specific:
- accounts
- teams
- services
- Kubernetes or ECS clusters
- regions
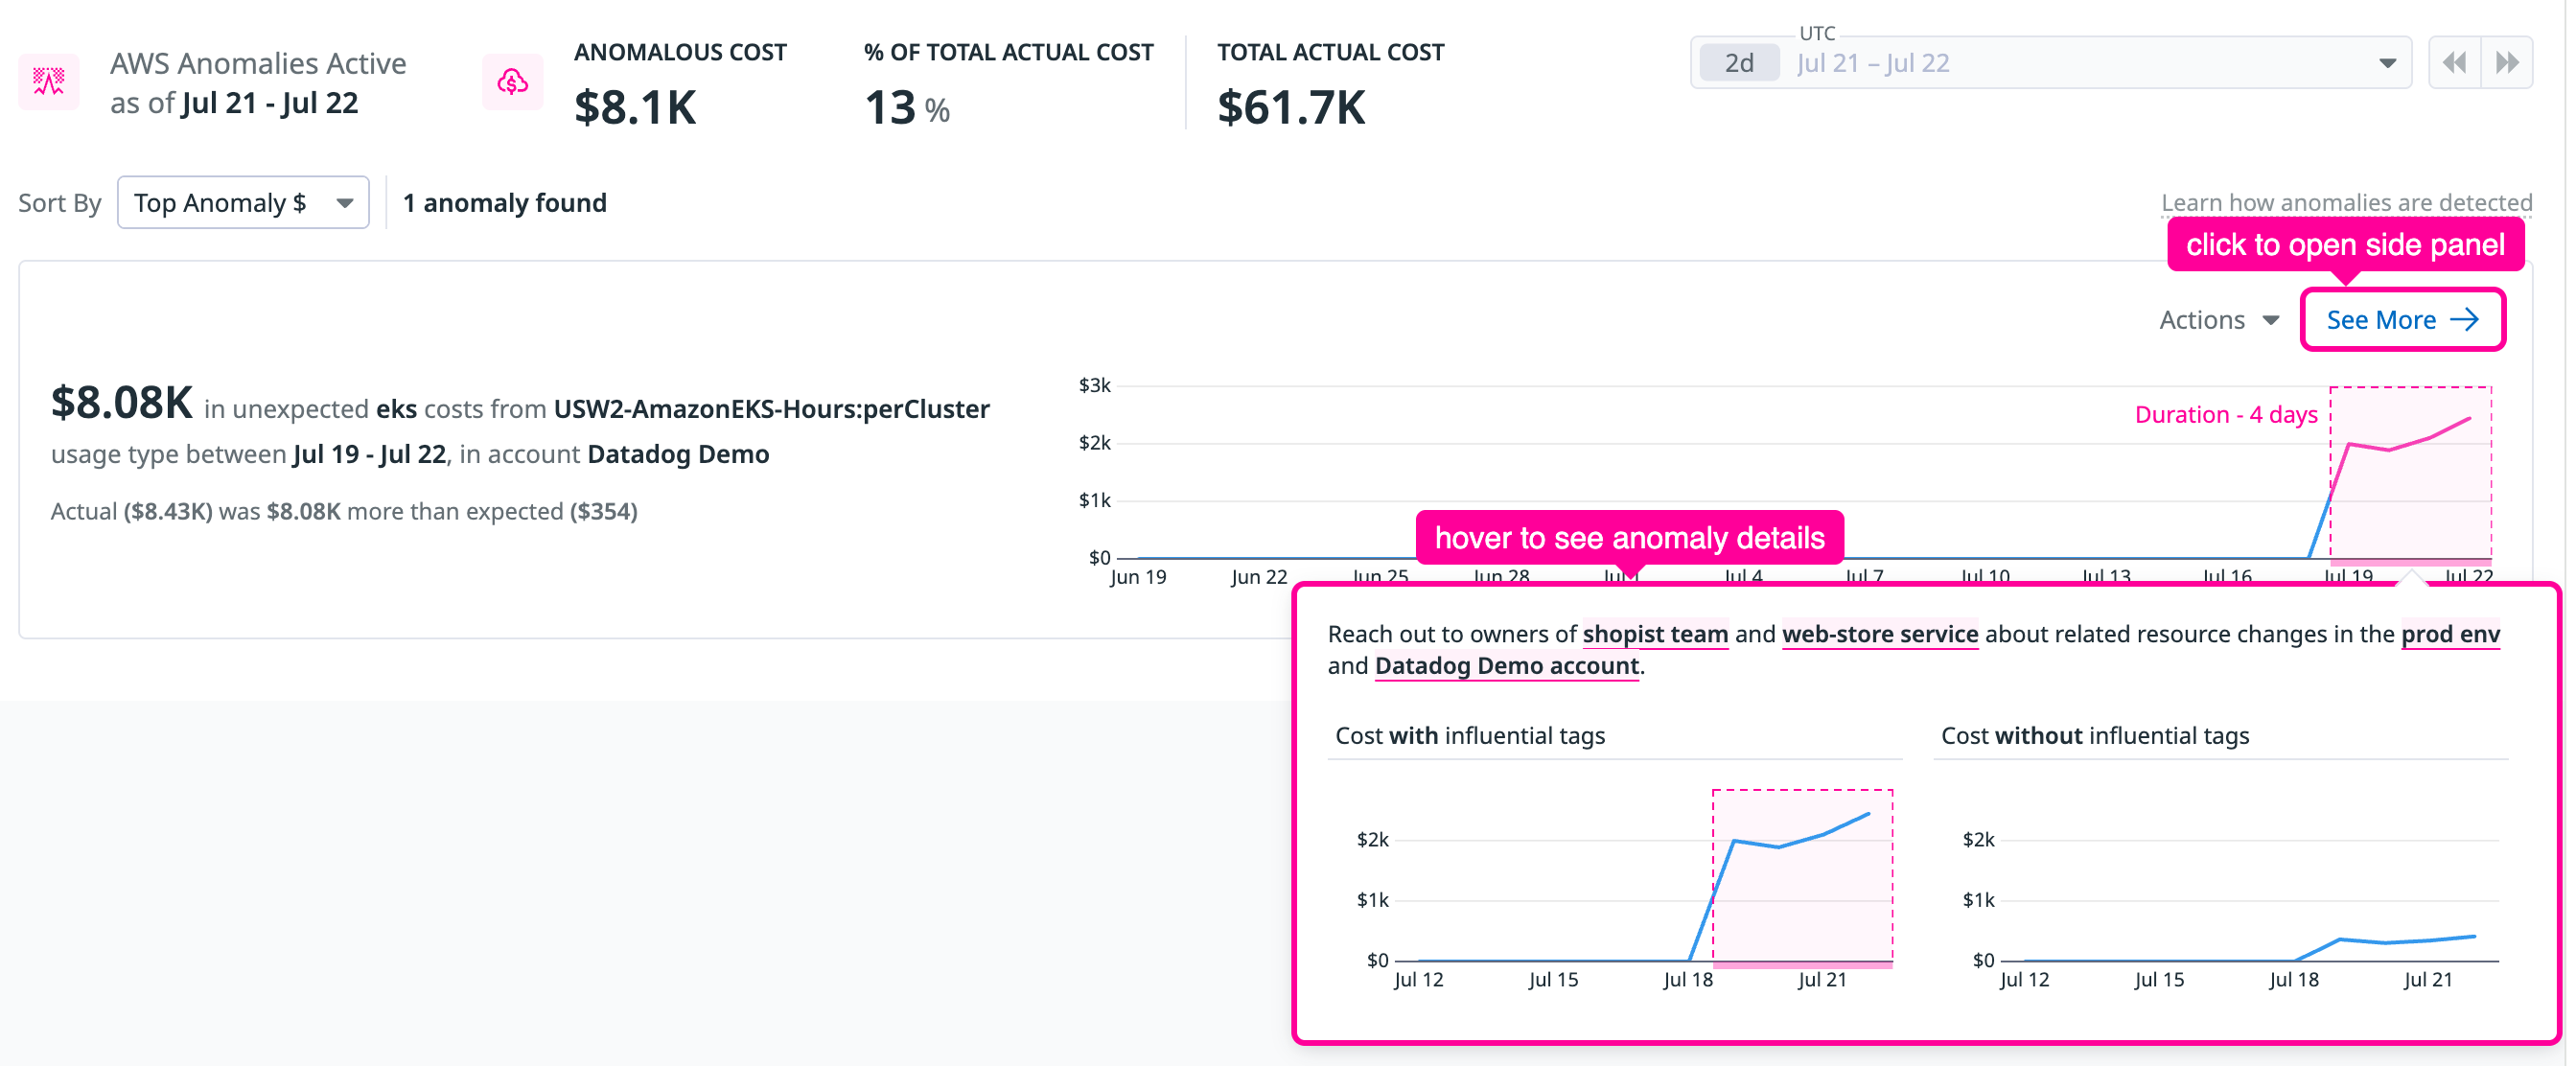
where the anomaly happened, reducing manual investigation steps. When hovering over the anomaly graph, you can see two graphs: one with and one without the tags identified by Watchdog Explains. This shows how removing specific tags flattens the spike, confirming the impact on the cost.
Take action on anomalies
Follow these steps to investigate and resolve anomalies:
Hover over an anomaly to see anomaly drivers or click See more to open the side panel.
Review the details for services affected, teams involved, environments impacted, resource IDs, or how usage and unit price may be driving the cost anomaly.
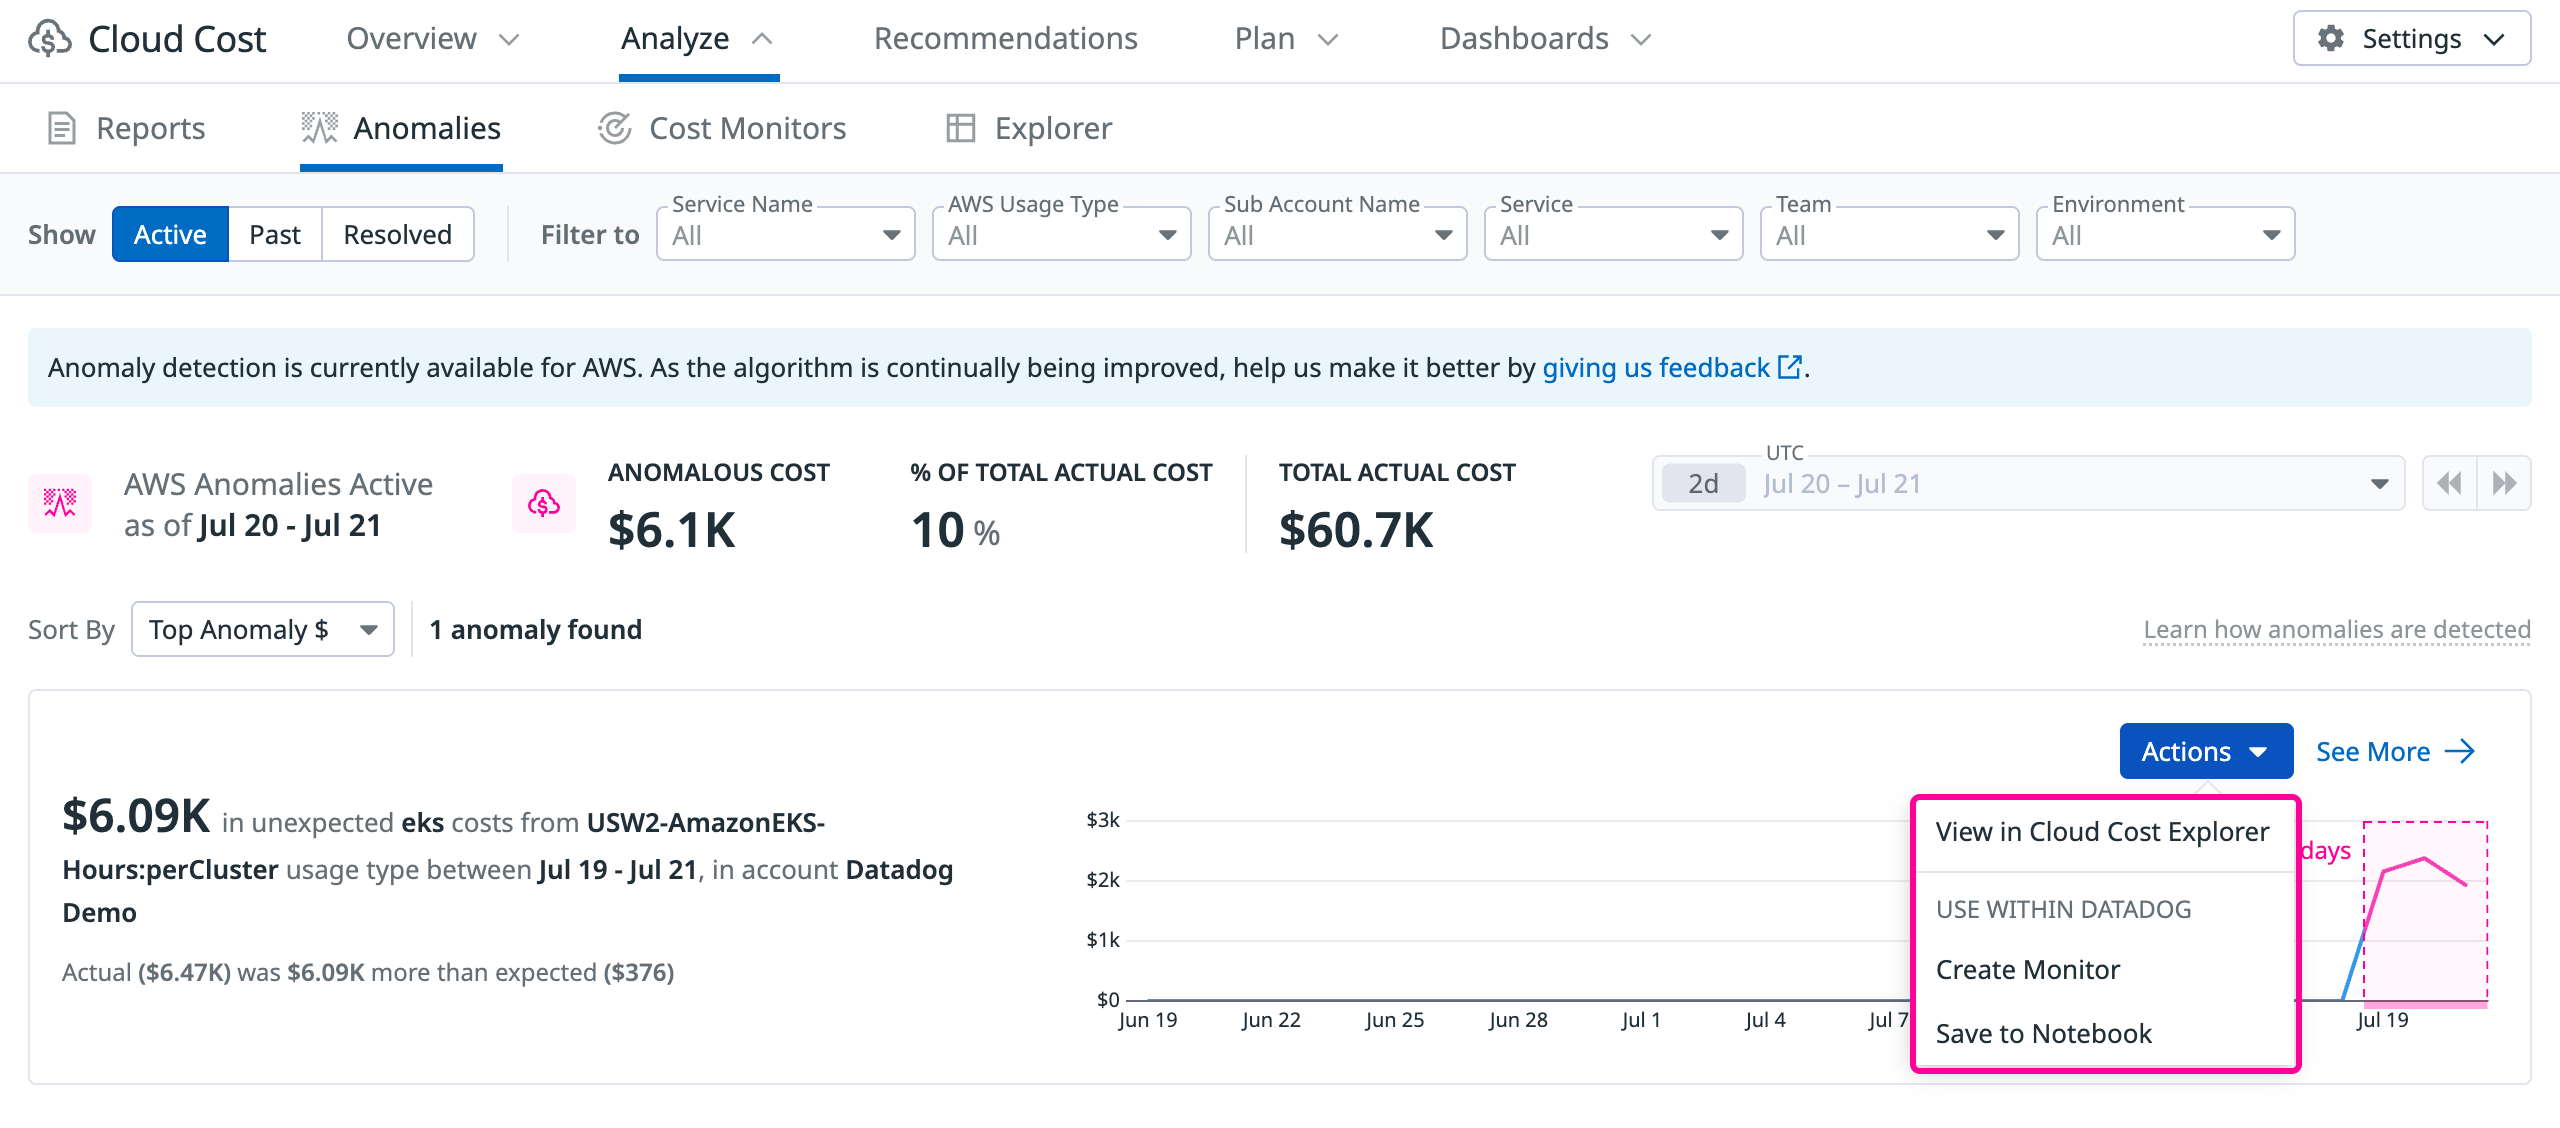
Investigate further: View the anomaly in Cost Explorer or a Datadog Notebook to further investigate anomalies by using additional dimensions. You can then send the anomaly, Explorer link, or Notebook to the service owners or teams identified by Watchdog Explains. This enables teams to resolve anomalies with context for why the anomaly occurred and whether it’s expected.
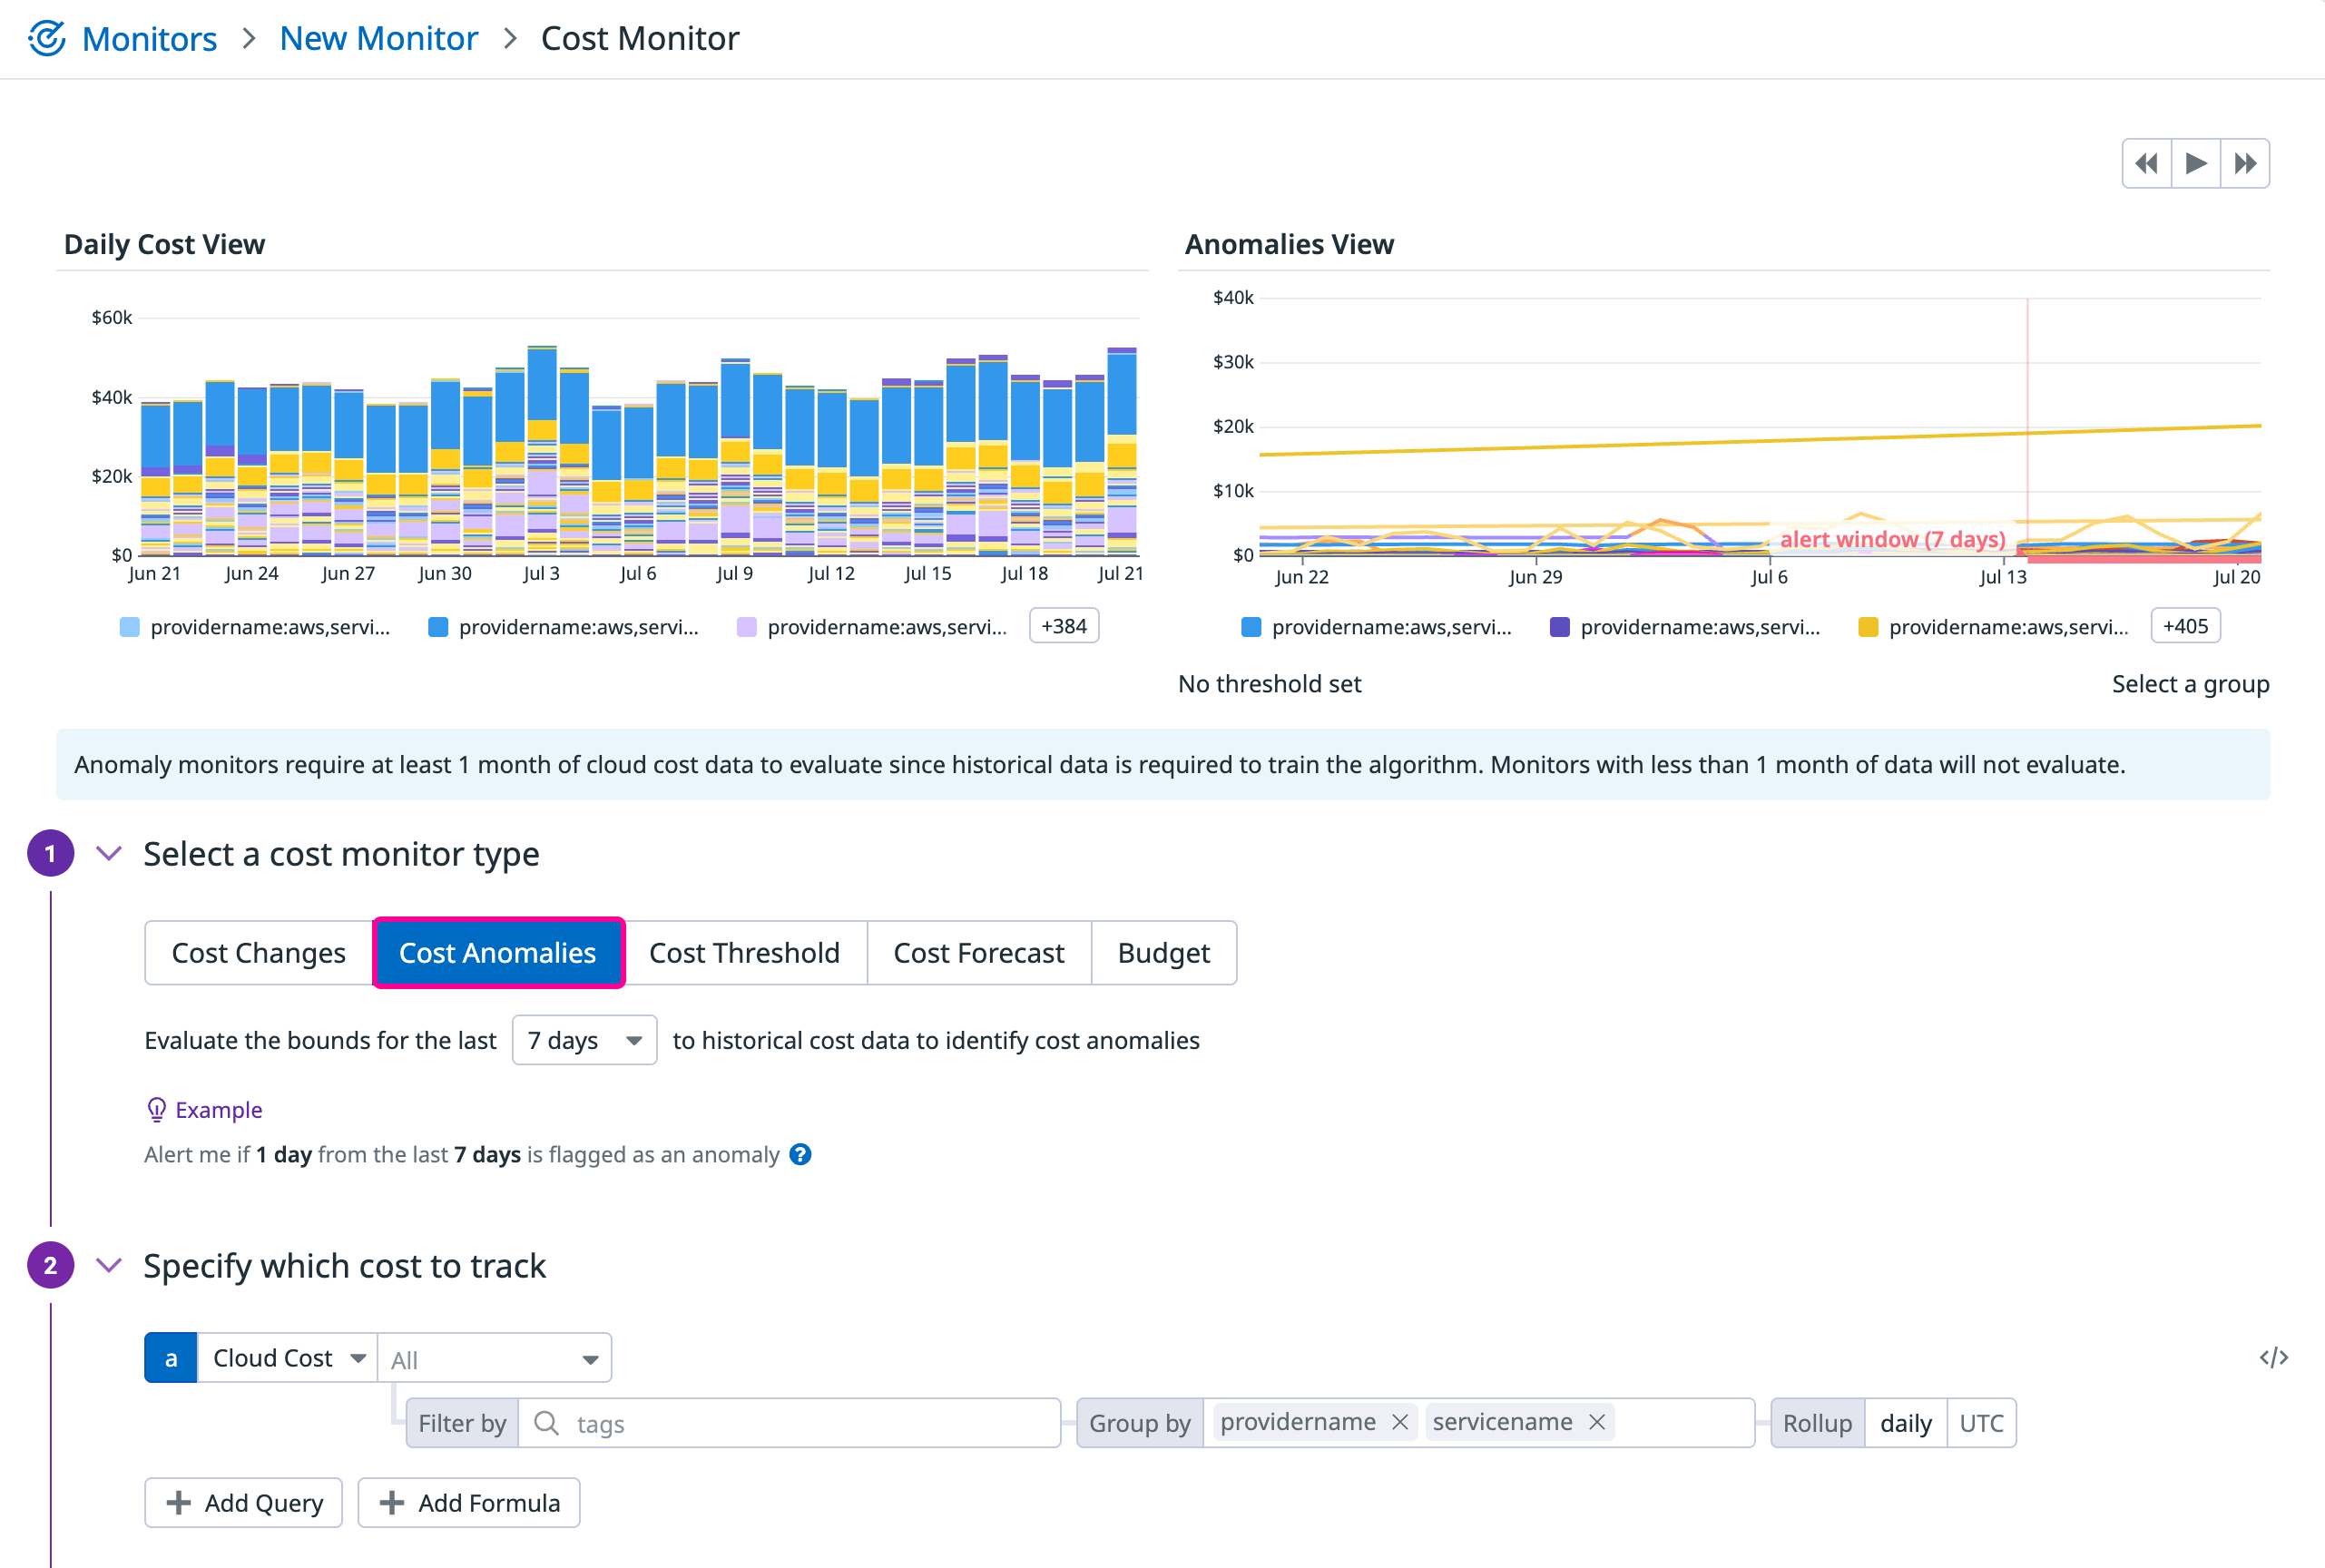
Set up monitoring: Create a cost anomaly monitor for similar patterns or configure alerts for future anomalies.
Resolve anomalies
As you investigate anomalies, you may find some that are not significant, were actually expected costs, or are otherwise not considered anomalies.
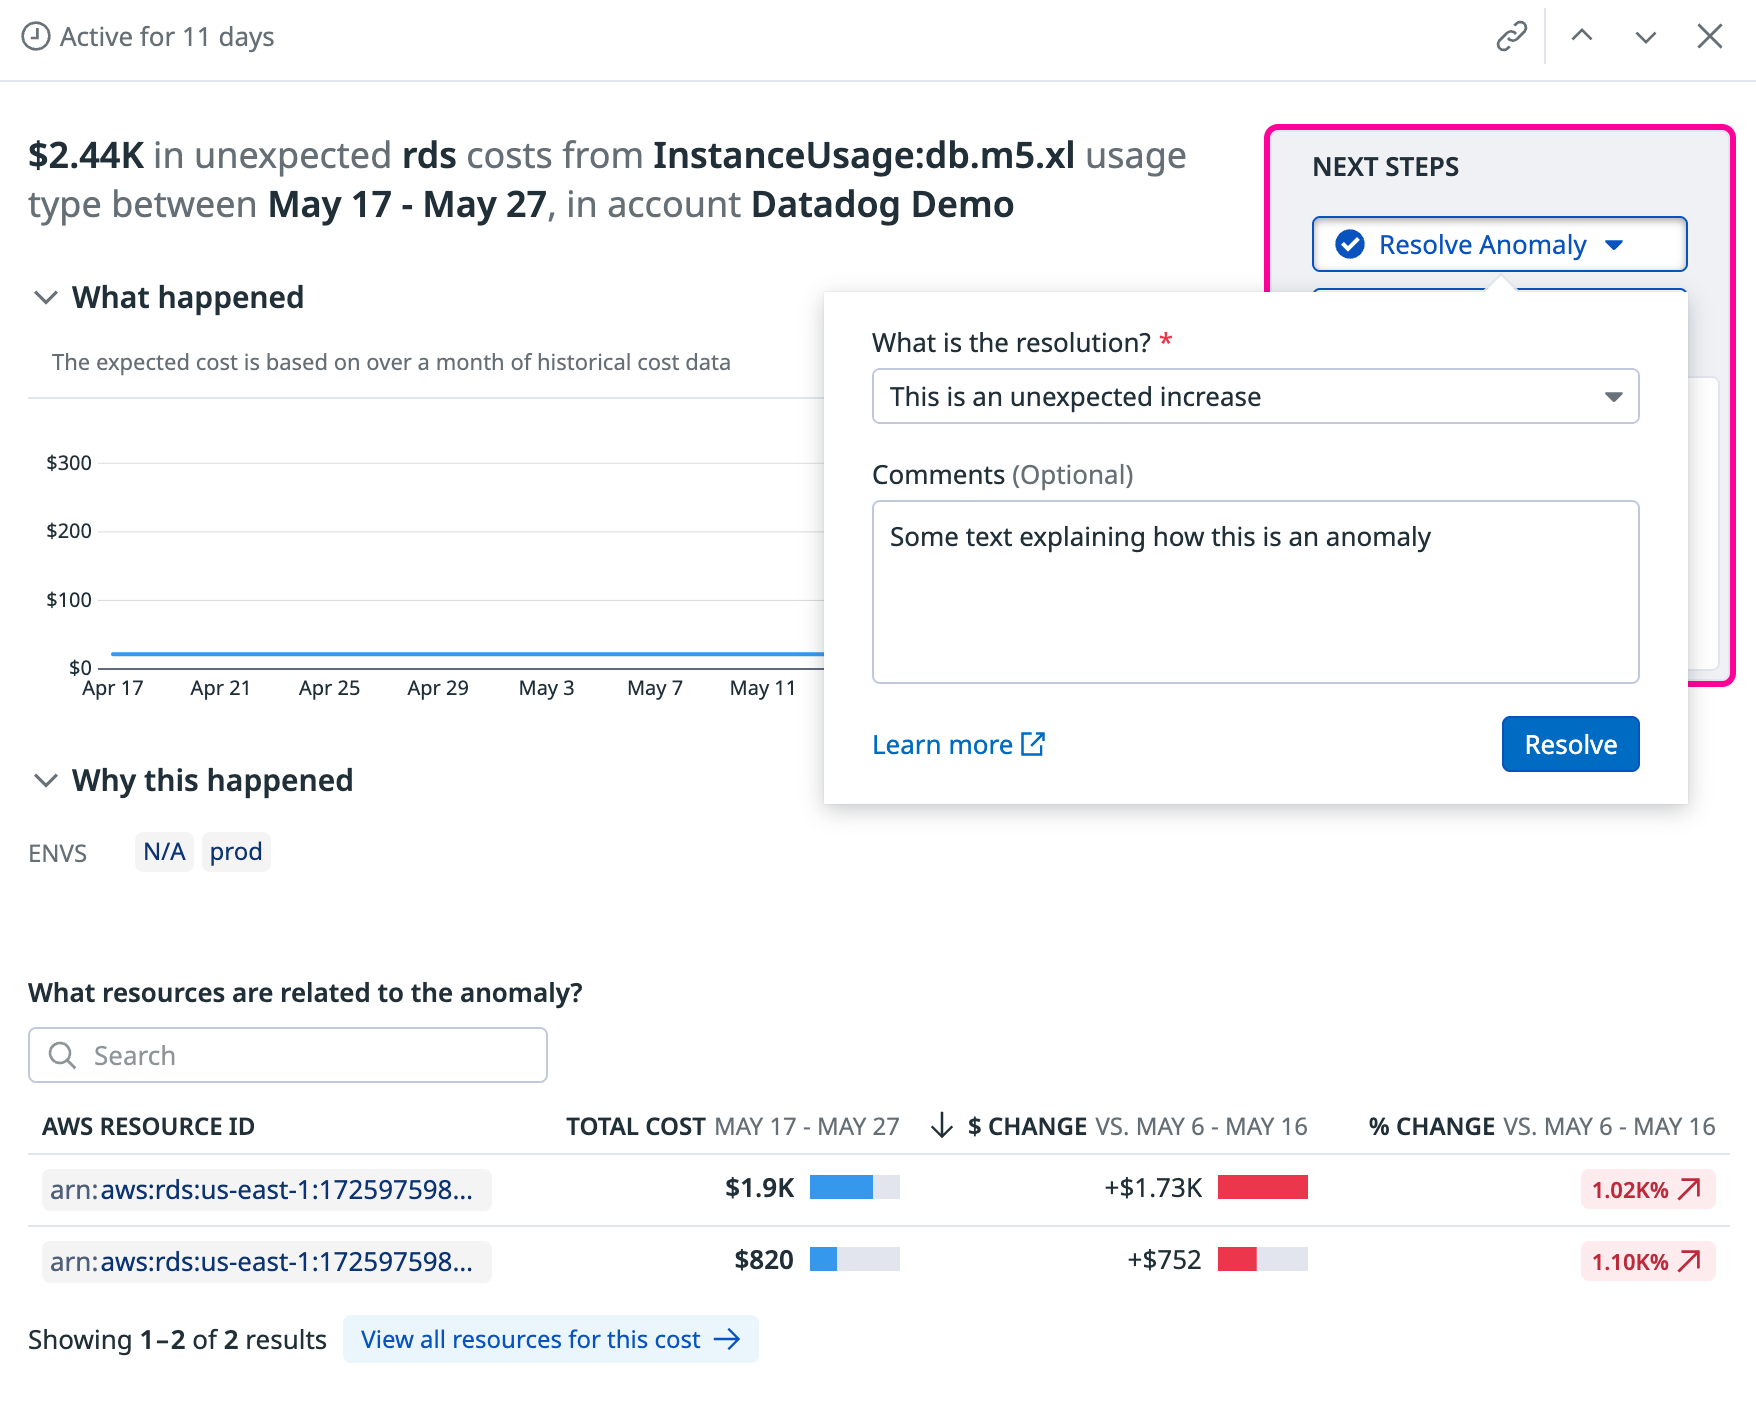
To resolve an anomaly:
- Click Resolve Anomaly to open the resolution popup.
- Select one of the following resolutions to help improve the algorithm:
- The anomaly amount was too small
- This is an unexpected increase
- This is an expected increase
- Add context about why it is or is not an anomaly.
- Click Resolve to move it to the Resolved tab.
This is an example of how to mark a cost anomaly as significant and explain why it’s an anomaly:
Troubleshooting
If you’re not seeing expected anomalies:
- Verify that CCM is properly set up
- Check that you have the necessary permissions for AWS, Azure, Google Cloud, or Oracle Cloud
- Review the time range of your anomaly view
For more help, contact Datadog Support.
Further reading
Additional helpful documentation, links, and articles:
