- Essentials
- Getting Started
- Agent
- API
- APM Tracing
- Containers
- Dashboards
- Database Monitoring
- Datadog
- Datadog Site
- DevSecOps
- Incident Management
- Integrations
- Internal Developer Portal
- Logs
- Monitors
- OpenTelemetry
- Profiler
- Session Replay
- Security
- Serverless for AWS Lambda
- Software Delivery
- Synthetic Monitoring and Testing
- Tags
- Workflow Automation
- Learning Center
- Support
- Glossary
- Standard Attributes
- Guides
- Agent
- Integrations
- Developers
- Authorization
- DogStatsD
- Custom Checks
- Integrations
- Create an Agent-based Integration
- Create an API Integration
- Create a Log Pipeline
- Integration Assets Reference
- Build a Marketplace Offering
- Create a Tile
- Create an Integration Dashboard
- Create a Monitor Template
- Create a Cloud SIEM Detection Rule
- OAuth for Integrations
- Install Agent Integration Developer Tool
- Service Checks
- IDE Plugins
- Community
- Guides
- OpenTelemetry
- Administrator's Guide
- API
- Partners
- Datadog Mobile App
- DDSQL Reference
- CoScreen
- CoTerm
- Cloudcraft (Standalone)
- In The App
- Dashboards
- Notebooks
- DDSQL Editor
- Reference Tables
- Sheets
- Monitors and Alerting
- Metrics
- Watchdog
- Bits AI
- Internal Developer Portal
- Error Tracking
- Change Tracking
- Service Management
- Actions & Remediations
- Infrastructure
- Cloudcraft
- Resource Catalog
- Universal Service Monitoring
- Hosts
- Containers
- Processes
- Serverless
- Network Monitoring
- Cloud Cost
- Application Performance
- APM
- APM Terms and Concepts
- Application Instrumentation
- APM Metrics Collection
- Trace Pipeline Configuration
- Correlate Traces with Other Telemetry
- Trace Explorer
- Recommendations
- Code Origins for Spans
- Service Observability
- Endpoint Observability
- Dynamic Instrumentation
- Live Debugger
- Error Tracking
- Data Security
- Guides
- Troubleshooting
- Continuous Profiler
- Database Monitoring
- Agent Integration Overhead
- Setup Architectures
- Setting Up Postgres
- Setting Up MySQL
- Setting Up SQL Server
- Setting Up Oracle
- Setting Up Amazon DocumentDB
- Setting Up MongoDB
- Connecting DBM and Traces
- Data Collected
- Exploring Database Hosts
- Exploring Query Metrics
- Exploring Query Samples
- Exploring Database Schemas
- Exploring Recommendations
- Troubleshooting
- Guides
- Data Streams Monitoring
- Data Jobs Monitoring
- Data Observability
- Digital Experience
- Real User Monitoring
- Synthetic Testing and Monitoring
- Continuous Testing
- Product Analytics
- Software Delivery
- CI Visibility
- CD Visibility
- Deployment Gates
- Test Optimization
- Quality Gates
- DORA Metrics
- Security
- Security Overview
- Cloud SIEM
- Code Security
- Cloud Security
- App and API Protection
- Workload Protection
- Sensitive Data Scanner
- AI Observability
- Log Management
- Observability Pipelines
- Log Management
- Administration
Troubleshooting Software Catalog
If you experience unexpected behavior with Datadog Software Catalog, this guide may help you resolve the issue. If you continue to have trouble, contact Datadog Support for further assistance.
Services
APM-instrumented services not appearing
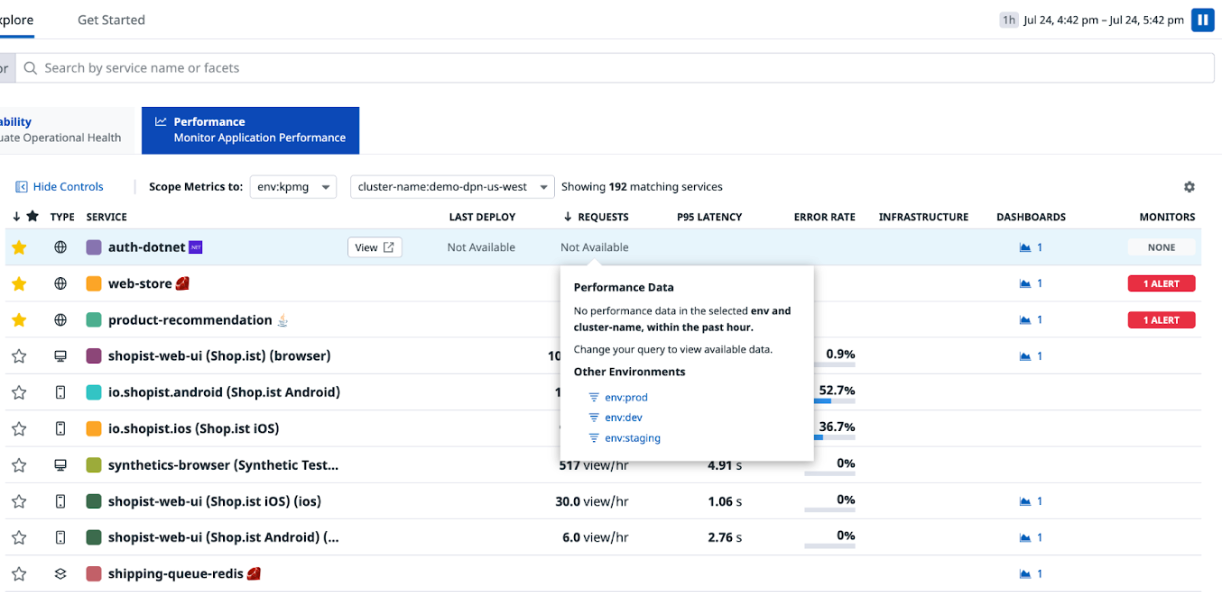
If services that you know are instrumented for APM are not appearing in the Software Catalog list, it’s likely because they have not been emitting performance data in the past hour for the selected env (or any primary tag values of your choosing) or additional primary tags. To confirm, on the Performance tab, hover over the columns where you expect the performance metrics to appear and see information on which environments the services are active.
SLOs not listed in Setup Guidance section
The count in the Software Catalog Setup Guidance section reflects the number of SLOs with service tags. If your SLOs are not listed, verify that they have service tag values specified and that they match with the service names in other products such as APM and USM.
Additional telemetry is available to a service but it’s not listed
Software Catalog relies on the DD_SERVICE tag in all telemetry types (infrastructure metrics, logs, Cloud Network Monitoring) to gather information about a given service. If you don’t see a telemetry type that you expect in the Software Catalog, ensure that you have configured the DD_SERVICE tag according to the instructions in Unified Service Tagging.
Can’t add metadata for RUM services
Adding metadata for RUM services is not supported.
Multiple services share the same metadata
If you have many services that share the same metadata, you do not need separate service.datadog.yaml files for each one. You can define multiple services in a single service.datadog.yaml file by separating each service with a --- separator. Copy and paste the shared metadata for the relevant dd-service entities.
Associated monitors not displayed in the Setup Guidance section
The Software Catalog associates monitors to services when they are tagged, scoped, or grouped with service or APM primary tags.
The total monitor count displayed on the Setup Guidance tab for a single service does not include muted monitors and groups.
Endpoints
Missing endpoints
The Endpoints list is based on APM tracing, so make sure your services are instrumented.
Definition matches too many services
By default, the Endpoints list matches a definition to all instances that fit the defined path. You can scope the definition to a specific service by adding the service parameter to the API definition.
No telemetry data for OpenAPI file
The Endpoints list is derived from APM tracing, so traffic information is displayed only if traces are available for the endpoint. After uploading an OpenAPI file, deployment data becomes visible after Datadog ingests a span for the endpoint.
No data for new monitor
The Endpoints list relies on APM tracing, so traffic information is displayed only when traces are available for the endpoint. If no data appears in the monitor graph, one of the following may apply:
- The endpoint has not been accessed since it was registered and uploaded via OpenAPI.
- Traces are sampled on the Agent side. For more details, see Ingestion Controls.
Further reading
Additional helpful documentation, links, and articles:

