- Agents
- Essentials
- Getting Started
- Agent
- API
- APM Tracing
- Containers
- Dashboards
- Database Monitoring
- Datadog
- Datadog Site
- DevSecOps
- Incident Management
- Integrations
- Internal Developer Portal
- Logs
- Monitors
- Notebooks
- OpenTelemetry
- Profiler
- Search
- Session Replay
- Security
- Serverless for AWS Lambda
- Software Delivery
- Synthetic Monitoring and Testing
- Tags
- Workflow Automation
- Learning Center
- Support
- Glossary
- Standard Attributes
- Guides
- Agent
- Integrations
- Extend Datadog
- Authorization
- DogStatsD
- Custom Checks
- Integrations
- Build an Integration with Datadog
- Create an Agent-based Integration
- Create an API-based Integration
- Create a Log Pipeline
- Integration Assets Reference
- Build a Marketplace Offering
- Create an Integration Dashboard
- Create a Monitor Template
- Create a Cloud SIEM Detection Rule
- Install Agent Integration Developer Tool
- Service Checks
- Community
- Guides
- OpenTelemetry
- Administrator's Guide
- API
- Partners
- Datadog Mobile App
- DDSQL Reference
- CoScreen
- CoTerm
- Remote Configuration
- Cloudcraft (Standalone)
- In The App
- Dashboards
- Notebooks
- DDSQL Editor
- Reference Tables
- Sheets
- Monitors and Alerting
- Service Level Objectives
- Metrics
- Watchdog
- Bits AI
- Internal Developer Portal
- Error Tracking
- Change Tracking
- Event Management
- Incident Response
- Actions & Remediations
- Infrastructure
- Cloudcraft
- Resource Catalog
- Universal Service Monitoring
- End User Device Monitoring
- Hosts
- Containers
- Processes
- Serverless
- Network Monitoring
- Storage Management
- Cloud Cost
- Application Performance
- APM
- Continuous Profiler
- Database Monitoring
- Agent Integration Overhead
- Setup Architectures
- Setting Up Postgres
- Setting Up MySQL
- Setting Up SQL Server
- Setting Up Oracle
- Setting Up Amazon DocumentDB
- Setting Up MongoDB
- Setting Up ClickHouse
- Connecting DBM and Traces
- Data Collected
- Exploring Database Hosts
- Exploring Query Metrics
- Exploring Query Samples
- Exploring Database Schemas
- Exploring Recommendations
- Troubleshooting
- Guides
- Data Streams Monitoring
- Data Observability
- Digital Experience
- Real User Monitoring
- Synthetic Testing and Monitoring
- Continuous Testing
- Experiments
- Product Analytics
- Session Replay
- Software Delivery
- CI Visibility
- CD Visibility
- Deployment Gates
- Test Optimization
- Code Coverage
- PR Gates
- DORA Metrics
- Feature Flags
- Developer Integrations
- Security
- Security Overview
- Cloud SIEM
- Code Security
- Cloud Security
- App and API Protection
- AI Guard
- Workload Protection
- Sensitive Data Scanner
- AI Observability
- Log Management
- Observability Pipelines
- Configuration
- Sources
- Processors
- Destinations
- Packs
- Akamai CDN
- Amazon CloudFront
- Amazon VPC Flow Logs
- AWS Application Load Balancer Logs
- AWS CloudTrail
- AWS Elastic Load Balancer Logs
- AWS Network Load Balancer Logs
- Cisco ASA
- Cloudflare
- F5
- Fastly
- Fortinet Firewall
- HAProxy Ingress
- Istio Proxy
- Juniper SRX Firewall Traffic Logs
- Netskope
- NGINX
- Okta
- Palo Alto Firewall
- Windows XML
- ZScaler ZIA DNS
- Zscaler ZIA Firewall
- Zscaler ZIA Tunnel
- Zscaler ZIA Web Logs
- Search Syntax
- Scaling and Performance
- Monitoring and Troubleshooting
- Guides and Resources
- Log Management
- CloudPrem
- Administration
Agent
Agent v7 is available. Upgrade to the newest version to benefit from all new functionality.
Overview
The Datadog Agent is software that runs on your hosts. It collects events and metrics from hosts and sends them to Datadog, where you can analyze your monitoring and performance data. The Datadog Agent is open source and its source code is available on GitHub at DataDog/datadog-agent.
Datadog recommends you update Datadog Agent with every minor and patch release, or, at a minimum, monthly.
Upgrading to a major Datadog Agent version and keeping it updated is the only supported way to get the latest Agent functionality and fixes.
It is recommended to fully install the Agent. However, a standalone DogStatsD package is available for Amazon Linux, CentOS, Debian, Fedora, Red Hat, SUSE, and Ubuntu. This package is used in containerized environments where DogStatsD runs as a sidecar or environments running a DogStatsD server without full Agent functionality.
Managing the Agent
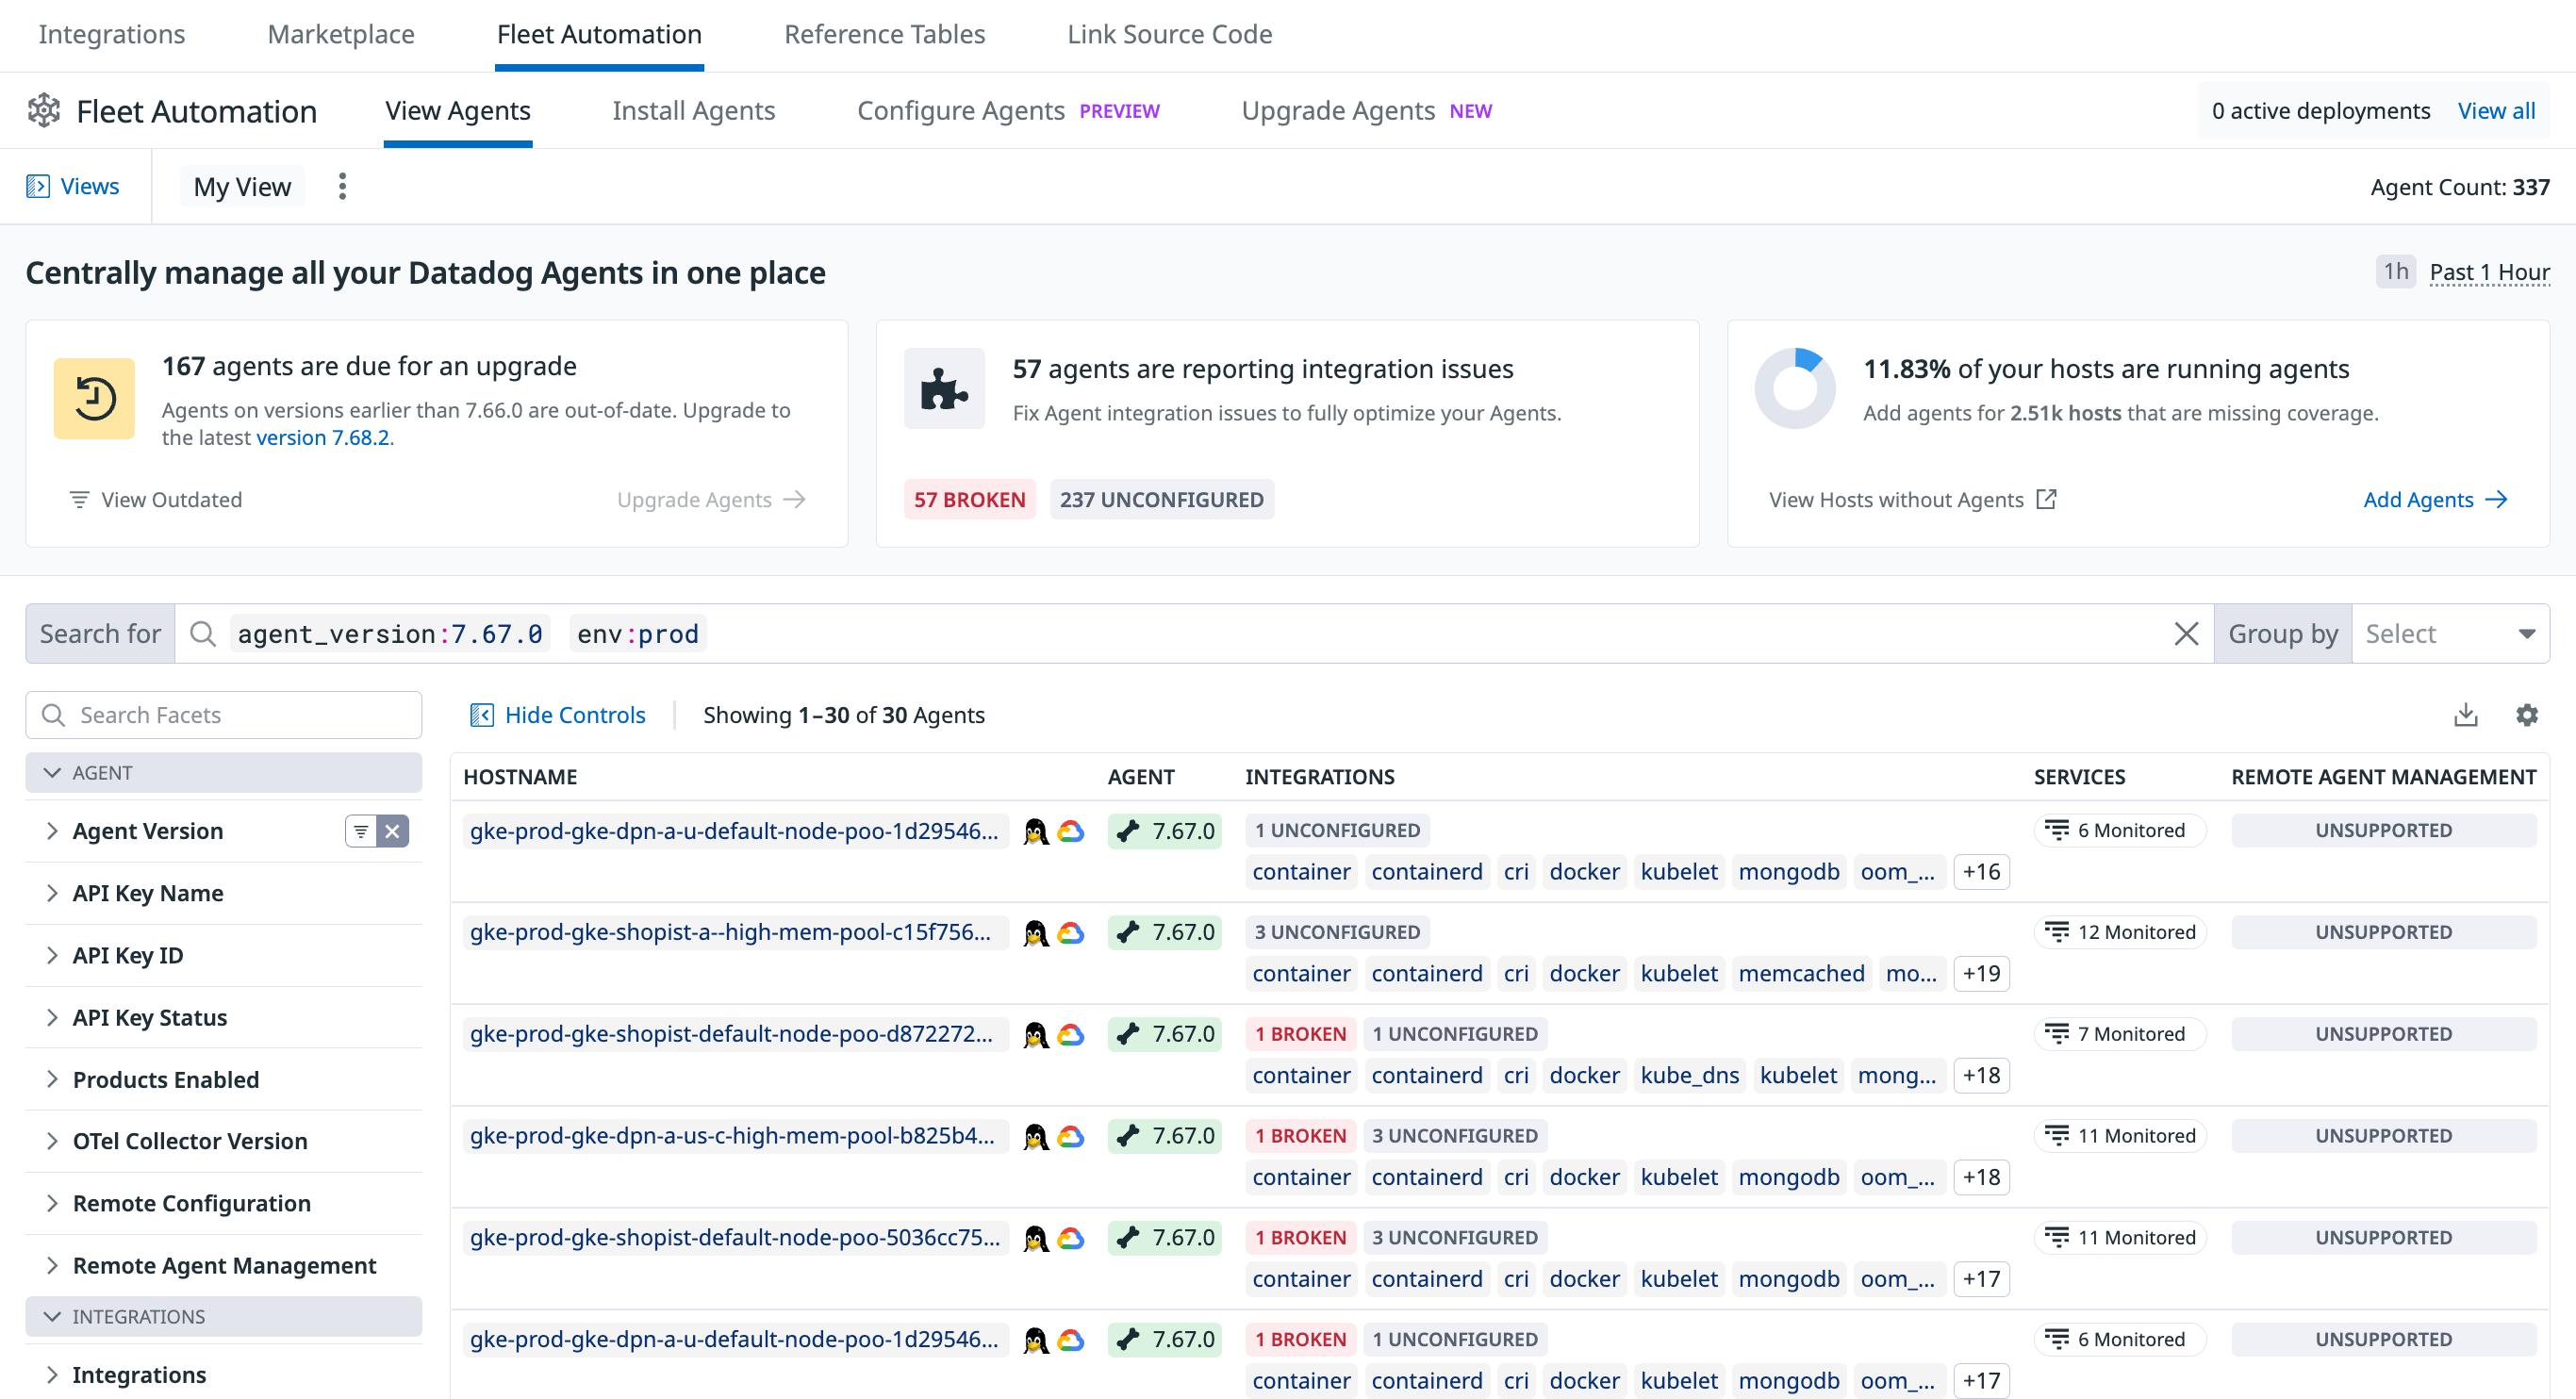
Managing the Agent with Fleet Automation (recommended)
Fleet Automation is the primary, in-app workflow for installing, upgrading, configuring, and troubleshooting the Datadog Agent at scale.
- View configuration & history: View every Agent in your fleet, its version, enabled products, configuration files, and historical changes from a single page.
- Upgrade outdated Agents: Trigger remote upgrades for your Agents to keep your fleet updated in a few clicks.
- Send a flare for support: From the Support tab of a host, generate a flare and attach it to an existing or new Support case without having to use the command line.
- Audit API-key usage: Identify which Agents are using a specific API key and rotate keys safely.
Datadog Agent Manager GUI
The Agent GUI is not supported on 32-bit Windows platforms.
Use the Datadog Agent Manager GUI to:
- View the status information for your Agent
- View all running checks
- View the Agent log
- Edit the Agent configuration file (
datadog.yaml) - Add or edit Agent checks
- Send flares
The Datadog Agent Manager GUI is enabled by default on Windows and macOS, and runs on port 5002. Use the datadog-agent launch-gui command to open the GUI in your default web browser.
You can change the GUI’s default port in your datadog.yaml configuration file. To disable the GUI, set the port’s value to -1. On Linux, the GUI is disabled by default.
GUI requirements:
- Cookies must be enabled in your browser. The GUI generates and saves a token in your browser, which is used for authenticating all communications with the GUI server.
- To start the GUI, the user must have the required permissions. If you are able to open
datadog.yaml, you are able to use the GUI. - For security reasons, the GUI can only be accessed from the local network interface (
localhost/127.0.0.1), therefore you must be on the host where the Agent is running. You can’t run the Agent on a VM or a container and access it from the host machine.
Command-line interface
From Agent 6 and later, the Agent command-line interface is based on subcommands. For a full list of Agent subcommands, see Agent Commands.
Getting further with the Datadog Agent
Update the Agent
To manually update the Datadog Agent core between two minor versions on a given host, run the corresponding installation command for your platform.
Note: If you want to manually update one specific Agent integration, see the Integration Management guide.
Configuration files
See the Agent configuration files documentation.
Datadog site
Edit the Agent’s main configuration file, datadog.yaml, to set the site parameter (defaults to datadoghq.com).
site:
Note: See the Getting Started with Datadog Sites documentation for further details on the site parameter.
Log location
See the Agent log files documentation.
Agent overhead
An example of the Datadog Agent resource consumption is below. Tests were made on an Amazon EC2 machine c5.xlarge instance (4 VCPU/ 8GB RAM) and comparable performance was seen for ARM64-based instances with similar resourcing. The vanilla datadog-agent was running with a process check to monitor the Agent itself. Enabling more integrations may increase Agent resource consumption.
Enabling JMX Checks forces the Agent to use more memory depending on the number of beans exposed by the monitored JVMs. Enabling the trace and process Agents increases the resource consumption as well.
- Agent Test version: 7.34.0
- CPU: ~ 0.08% of the CPU used on average
- Memory: ~ 130MB of RAM used (RSS memory)
- Network bandwidth: ~ 140 B/s ▼ | 800 B/s ▲
- Disk:
- Linux 830MB to 880MB depending on the distribution
- Windows: 870MB
Log Collection:
The results below are obtained from a collection of 110KB of logs per seconds from a file with the HTTP forwarder enabled. It shows the evolution of resource usage for the different compression levels available.
- Agent Test version: 6.15.0
- CPU: ~ 1.5% of the CPU used on average
- Memory: ~ 95MB of RAM used.
- Network bandwidth: ~ 14 KB/s ▲
- Agent Test version: 6.15.0
- CPU: ~ 1% of the CPU used on average
- Memory: ~ 95MB of RAM used.
- Network bandwidth: ~ 20 KB/s ▲
- Agent Test version: 6.15.0
- CPU: ~ 0.7% of the CPU used on average
- Memory: ~ 90MB of RAM used (RSS memory)
- Network bandwidth: ~ 200 KB/s ▲
Additional resources
This section includes the following topics:
- Kubernetes: Install and configure the Datadog Agent on Kubernetes.
Further Reading
Additional helpful documentation, links, and articles:


