- Essentials
- Getting Started
- Agent
- API
- APM Tracing
- Containers
- Dashboards
- Database Monitoring
- Datadog
- Datadog Site
- DevSecOps
- Incident Management
- Integrations
- Internal Developer Portal
- Logs
- Monitors
- Notebooks
- OpenTelemetry
- Profiler
- Search
- Session Replay
- Security
- Serverless for AWS Lambda
- Software Delivery
- Synthetic Monitoring and Testing
- Tags
- Workflow Automation
- Learning Center
- Support
- Glossary
- Standard Attributes
- Guides
- Agent
- Integrations
- Developers
- Authorization
- DogStatsD
- Custom Checks
- Integrations
- Build an Integration with Datadog
- Create an Agent-based Integration
- Create an API-based Integration
- Create a Log Pipeline
- Integration Assets Reference
- Build a Marketplace Offering
- Create an Integration Dashboard
- Create a Monitor Template
- Create a Cloud SIEM Detection Rule
- Install Agent Integration Developer Tool
- Service Checks
- IDE Plugins
- Community
- Guides
- OpenTelemetry
- Administrator's Guide
- API
- Partners
- Datadog Mobile App
- DDSQL Reference
- CoScreen
- CoTerm
- Remote Configuration
- Cloudcraft (Standalone)
- In The App
- Dashboards
- Notebooks
- DDSQL Editor
- Reference Tables
- Sheets
- Monitors and Alerting
- Service Level Objectives
- Metrics
- Watchdog
- Bits AI
- Internal Developer Portal
- Error Tracking
- Change Tracking
- Event Management
- Incident Response
- Actions & Remediations
- Infrastructure
- Cloudcraft
- Resource Catalog
- Universal Service Monitoring
- End User Device Monitoring
- Hosts
- Containers
- Processes
- Serverless
- Network Monitoring
- Storage Management
- Cloud Cost
- Application Performance
- APM
- Continuous Profiler
- Database Monitoring
- Agent Integration Overhead
- Setup Architectures
- Setting Up Postgres
- Setting Up MySQL
- Setting Up SQL Server
- Setting Up Oracle
- Setting Up Amazon DocumentDB
- Setting Up MongoDB
- Connecting DBM and Traces
- Data Collected
- Exploring Database Hosts
- Exploring Query Metrics
- Exploring Query Samples
- Exploring Database Schemas
- Exploring Recommendations
- Troubleshooting
- Guides
- Data Streams Monitoring
- Data Observability
- Digital Experience
- Real User Monitoring
- Synthetic Testing and Monitoring
- Continuous Testing
- Product Analytics
- Session Replay
- Software Delivery
- CI Visibility
- CD Visibility
- Deployment Gates
- Test Optimization
- Code Coverage
- PR Gates
- DORA Metrics
- Feature Flags
- Security
- Security Overview
- Cloud SIEM
- Code Security
- Cloud Security
- App and API Protection
- Workload Protection
- Sensitive Data Scanner
- AI Observability
- Log Management
- Observability Pipelines
- Configuration
- Sources
- Processors
- Destinations
- Packs
- Akamai CDN
- Amazon CloudFront
- Amazon VPC Flow Logs
- AWS Application Load Balancer Logs
- AWS CloudTrail
- AWS Elastic Load Balancer Logs
- AWS Network Load Balancer Logs
- Cisco ASA
- Cloudflare
- F5
- Fastly
- Fortinet Firewall
- HAProxy Ingress
- Istio Proxy
- Juniper SRX Firewall Traffic Logs
- Netskope
- NGINX
- Okta
- Palo Alto Firewall
- Windows XML
- ZScaler ZIA DNS
- Zscaler ZIA Firewall
- Zscaler ZIA Tunnel
- Zscaler ZIA Web Logs
- Search Syntax
- Scaling and Performance
- Monitoring and Troubleshooting
- Guides and Resources
- Log Management
- CloudPrem
- Administration
Cost Details
Overview
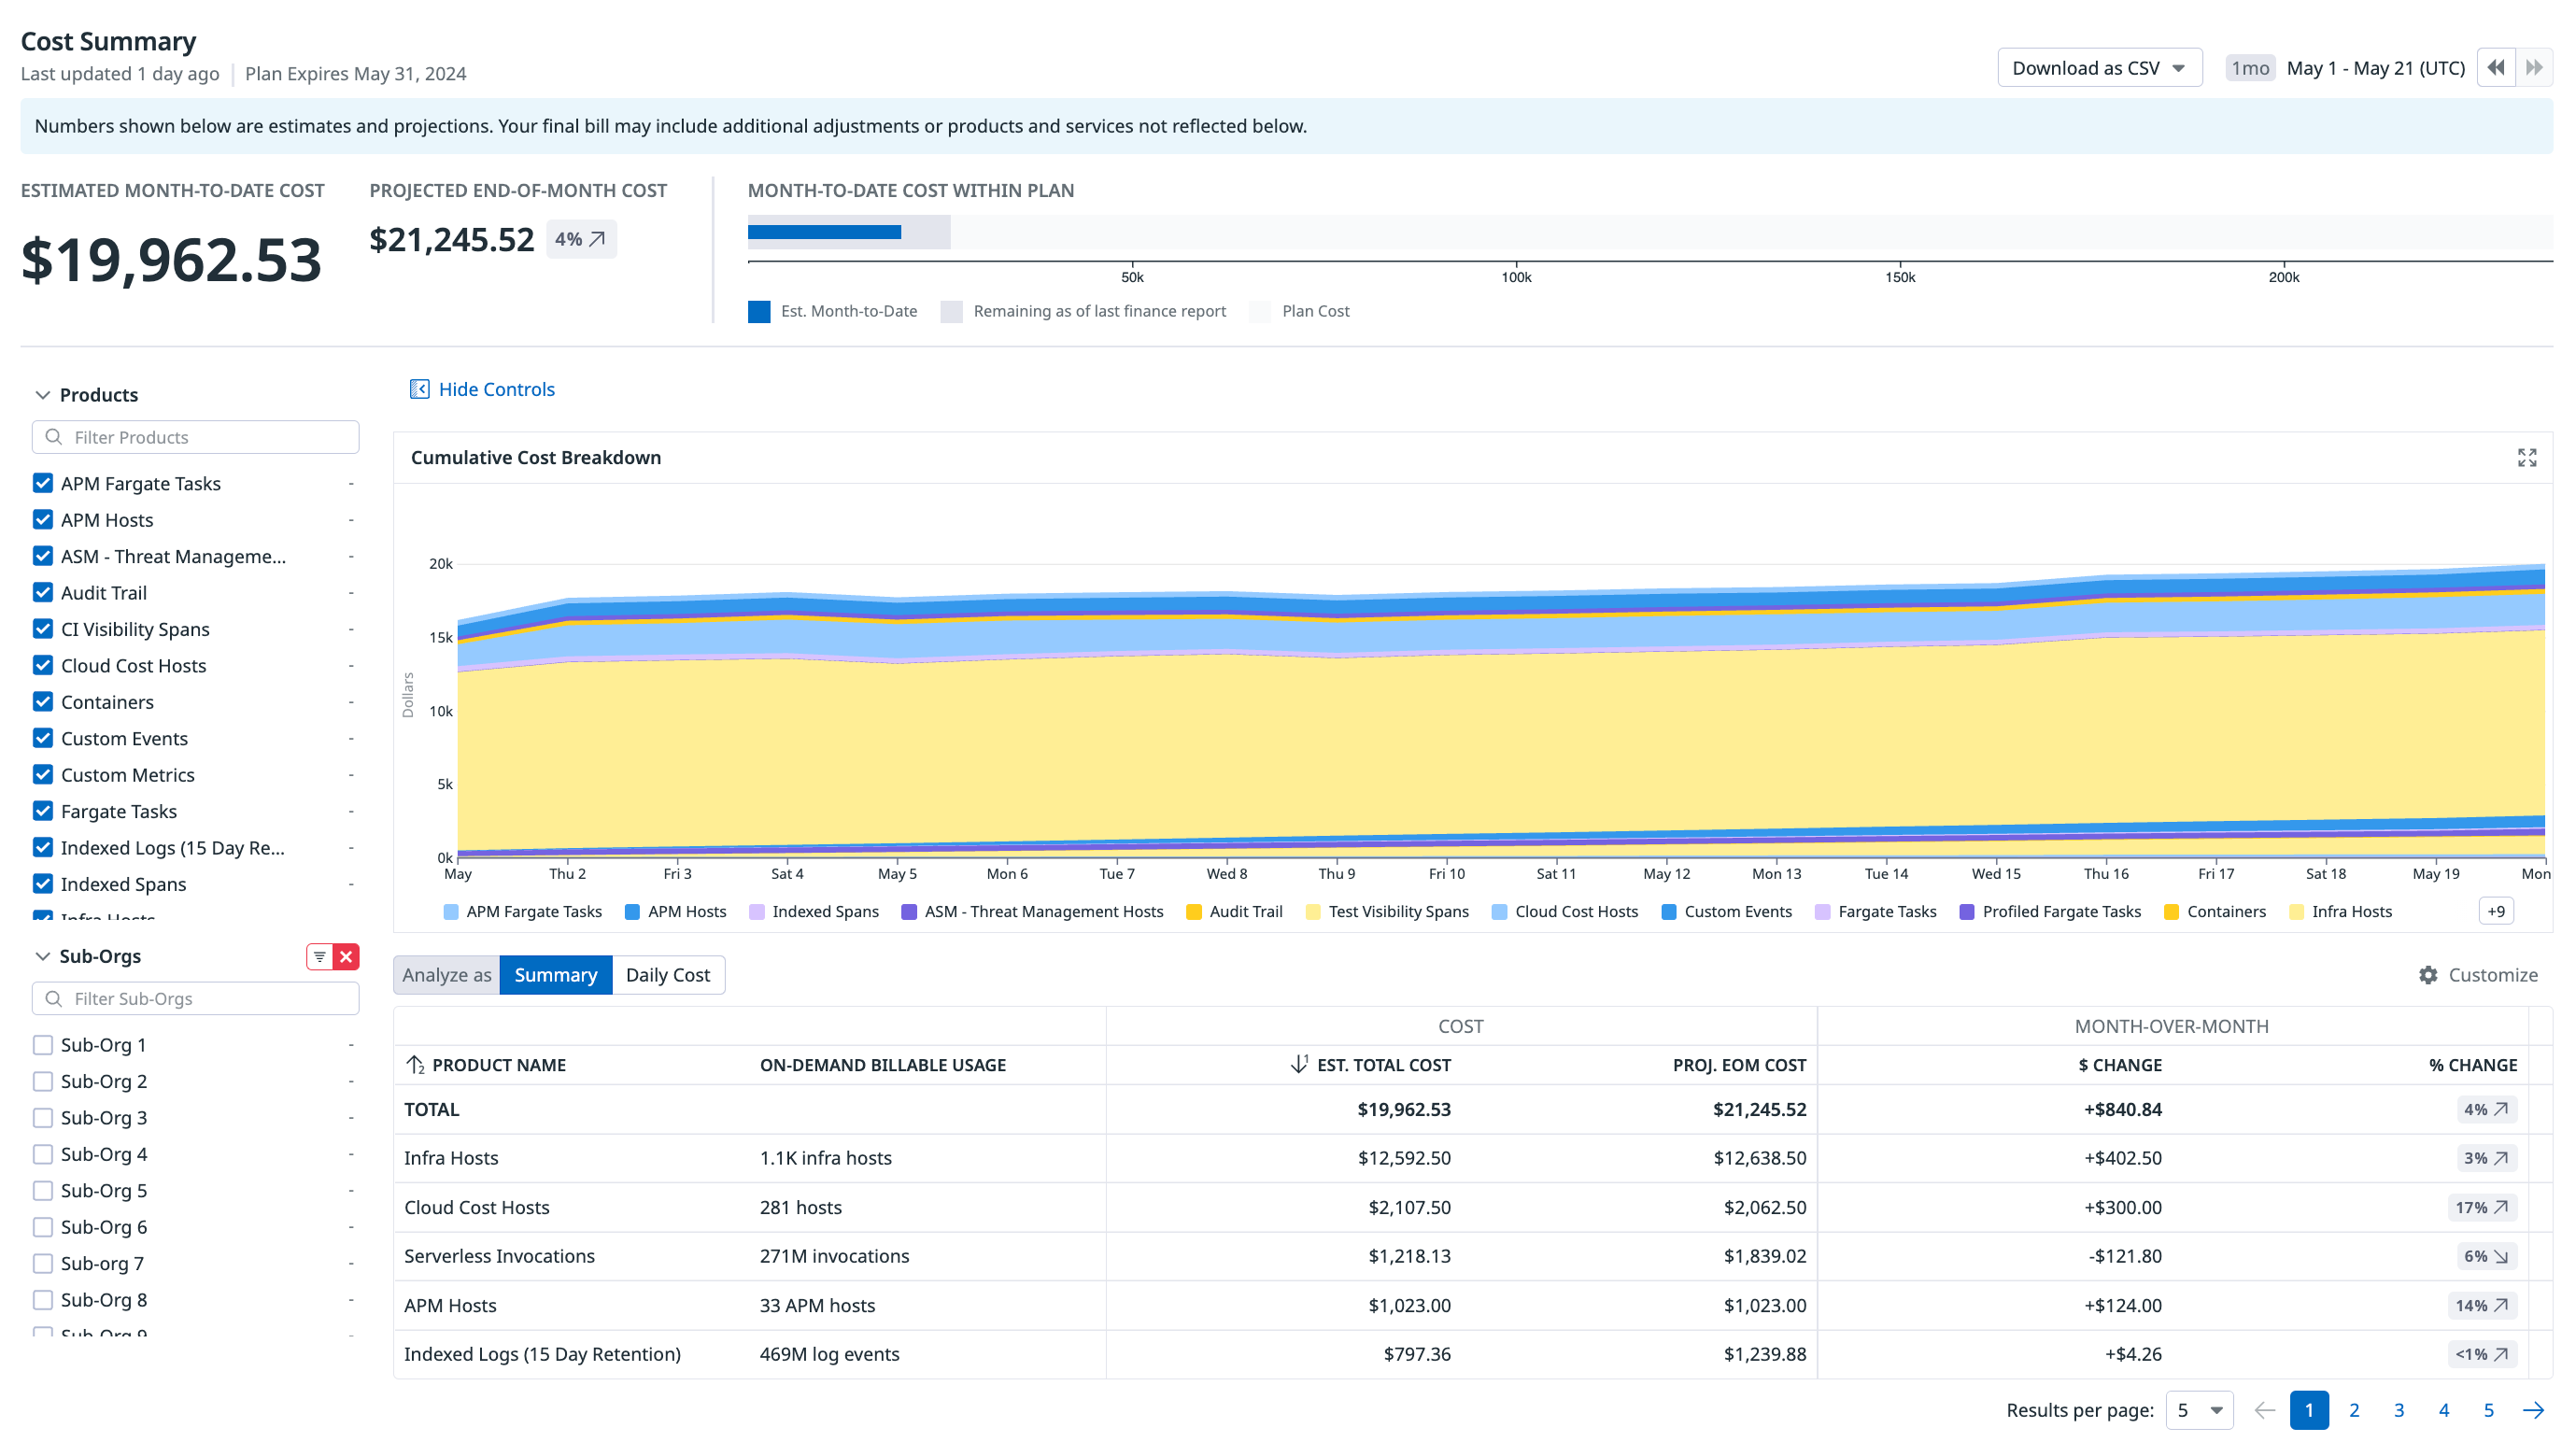
Cost Summary and Cost Chargebacks help you understand your estimated month-to-date, projected end-of-month, and historical Datadog costs. Cost data is available for the past 15 months.
You can break down your costs by sub-organization and by product to:
- Allocate costs according to their source
- Gain insight into how costs are tracking
For visibility into daily Datadog spending in Cloud Cost Explorer, dashboards, and cost monitors, see Datadog Costs under Cloud Cost Management.
Permissions
Roles with Billing Read (billing_read) and Usage Read (usage_read) permissions can view the Cost Summary and Cost Chargebacks data. Users with the Datadog Admin role have these permissions by default.
Cost summary
Use the cost summary to:
- View estimated month-to-date and projected end-of-month costs
- View historical costs
- Filter and group costs by product or sub-organization
- View month-over-month % and $ cost changes
- View cost trends within the month
- View cumulative day-over-day costs
Projected Costs (parent organization)
Projected end-of-month costs are calculated by applying the prior and current month’s projected usage data against your contracted rates. Projected end-of-month costs are updated daily and may change over time, depending on your usage throughout the month. Because the costs are a prediction, the amount may differ from your finalized monthly cost.
Cost Summary (parent organization)
The cost summary functionality changes according to your Datadog usage as a single organization or a multi-organization. As a multi-organization, you can view estimated, projected, and historical costs for the parent organization and each sub-organization.
View historical costs by toggling back to previous months, or use the date dropdown to view costs over 1, 3, 6 or 12 months.
- While logged in to the parent organization, navigate to Plan & Usage.
- Click the Usage tab.
- For a multi-organization, ensure the Overall tab is selected.
View and filter
Use the search facets at the left to filter the cost by Products, Sub-Orgs or Cost Breakdown. Use the Daily Cost tab to see how the cumulative day-over-day costs have changed within the current month.
Download
To download the data as a comma separated value file, click Download as CSV. Data is available for the current month and pre-defined prior months. Use the Cost Type field to distinguish between the records:
- Projected: Data is available for the current month.
- Estimated MTD: Data is available from the first of the month to the current date. If historical cost data is not yet available for the prior month, estimated cost data also displays for the prior month.
- Historical: Data is available after month close, which is approximately 16 days after the end of the month.
To query estimated cost data through the API, see Get estimated cost across your account. To query projected cost data through the API, see Get projected cost across your account.
Cost Summary (sub-organization)
This feature is in limited availability. To request access and confirm your organization meets the feature criteria, contact your account representative or Customer Support.
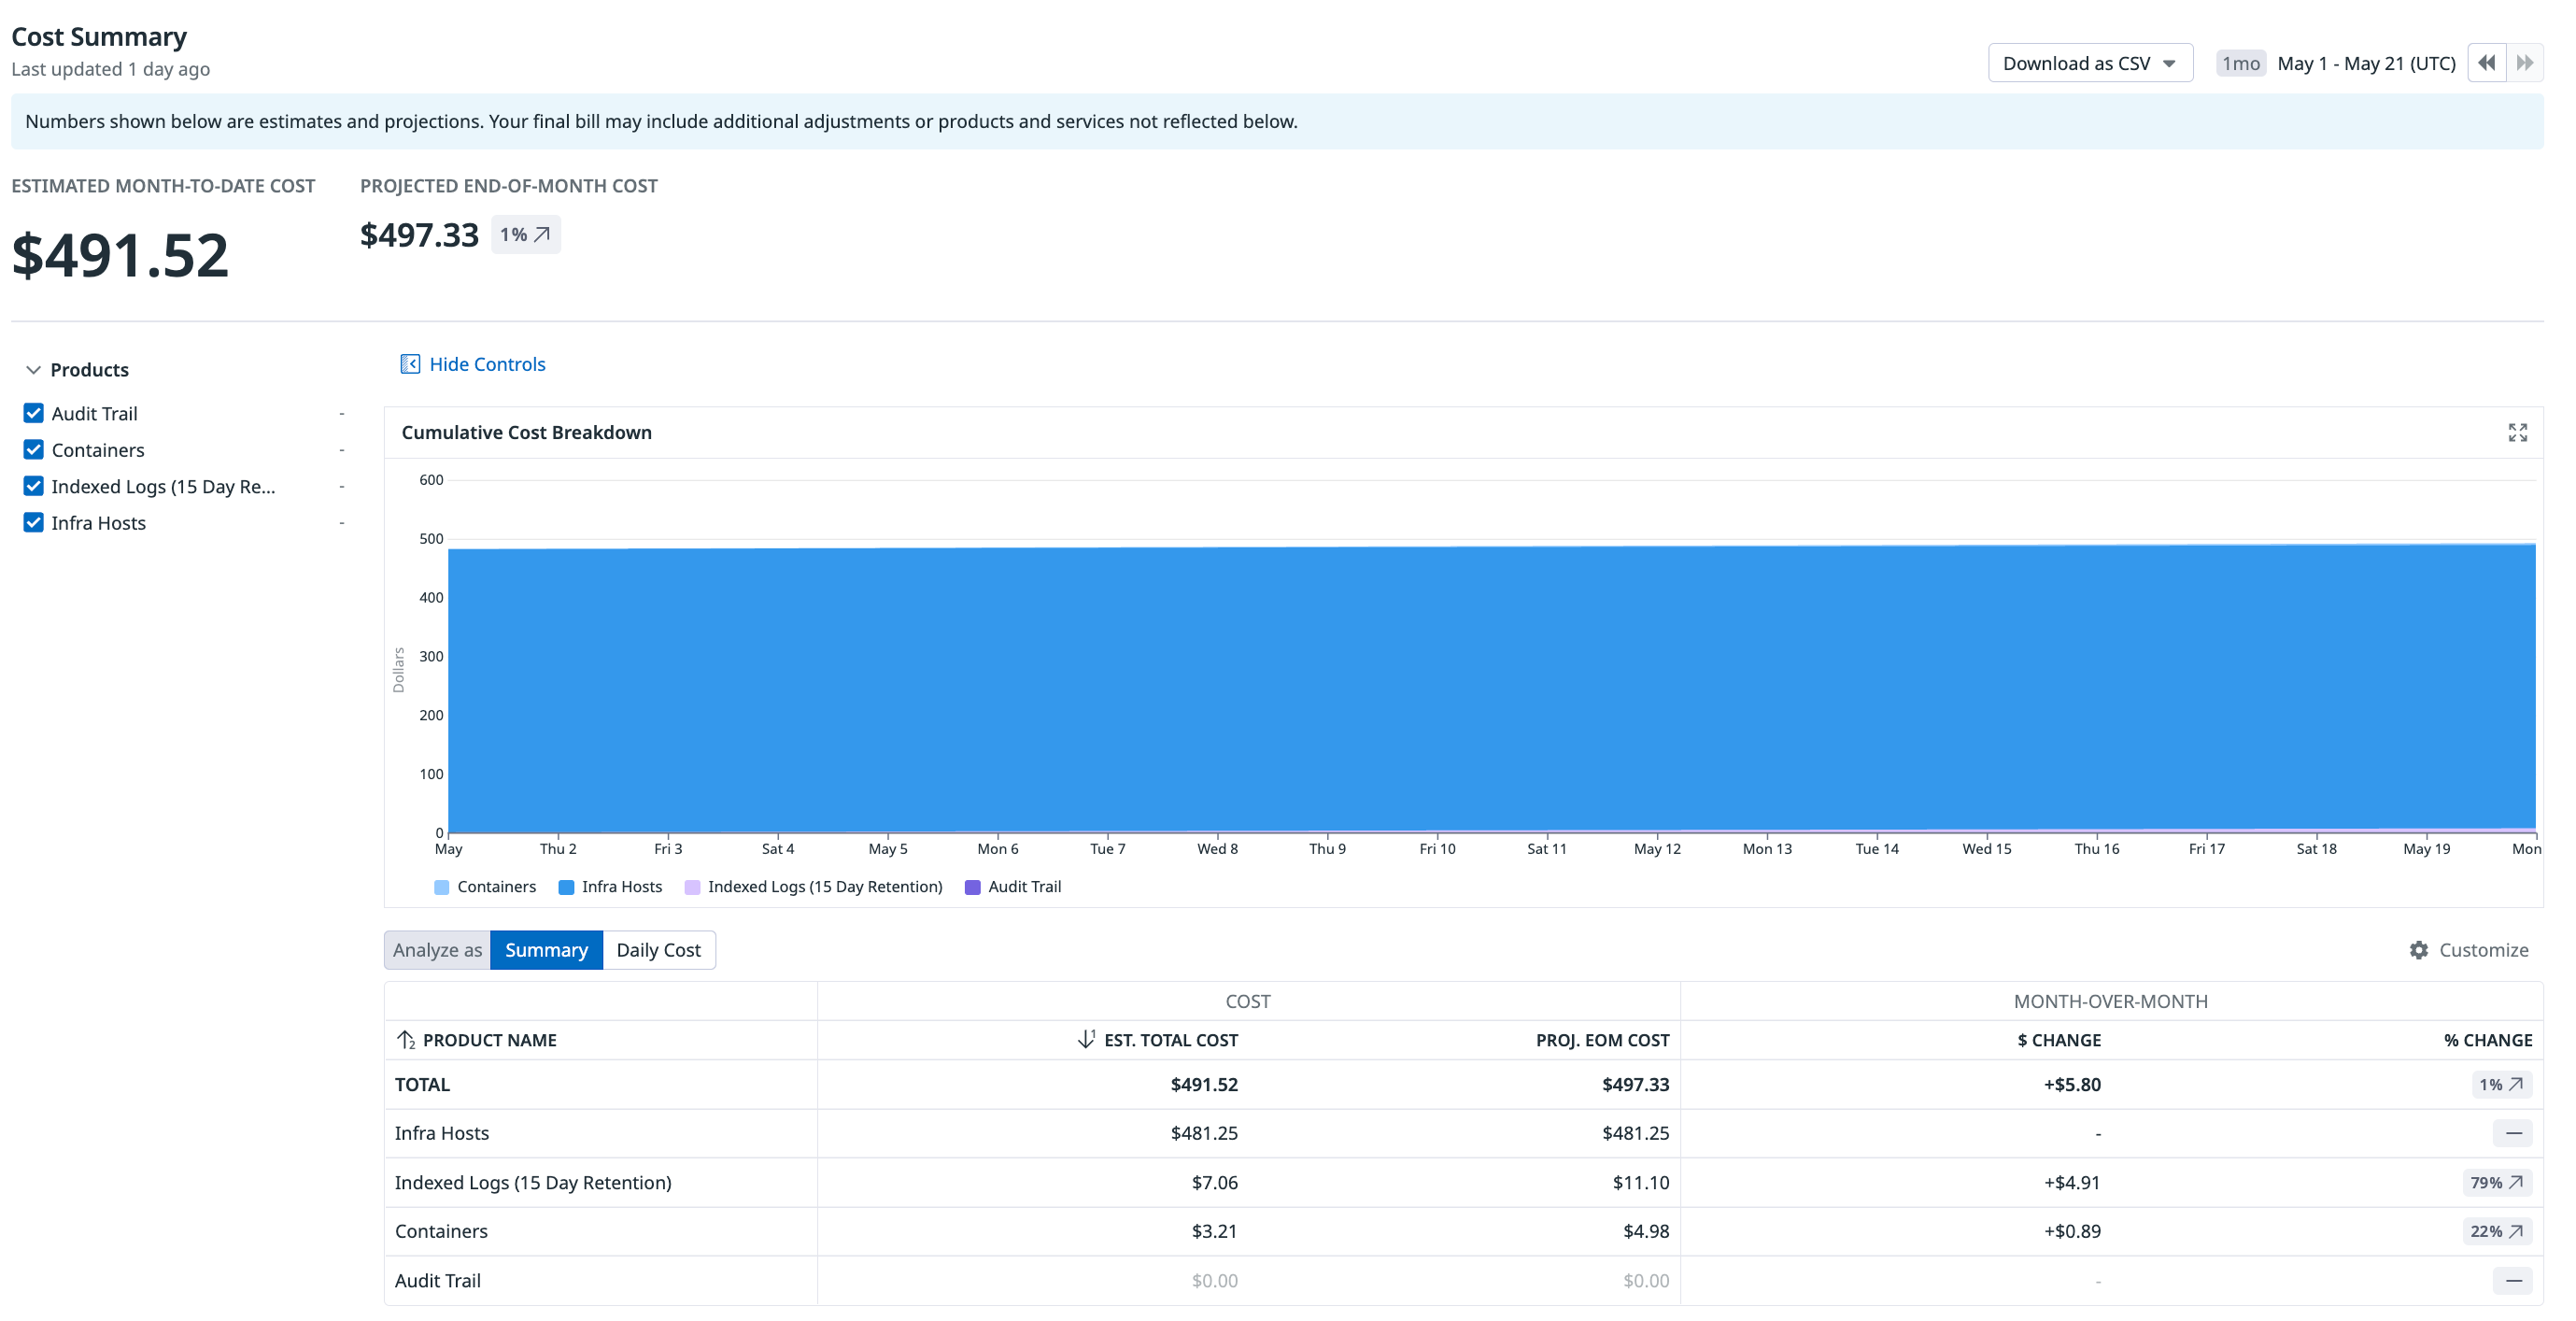
As a sub-organization, you can view the costs for your organization only. This restriction allows for more distributed ownership and removes the need to grant broader Admin permissions to the parent organization.
View historical costs by toggling back to previous months, or use the date dropdown to view costs over 1,3, 6 or 12 months.
- While logged in to the sub-organization, navigate to Plan & Usage.
- Click the Usage tab.
- Ensure the Overall tab is selected.
View and filter
Use the search facets at the left to filter the cost by Products or Cost Breakdown. Use the Daily Cost tab to see how the cumulative day-over-day costs have changed within the current month.
Download
To download the data as a comma separated value file, click Download as CSV.
Cost chargebacks
Use the cost chargebacks to:
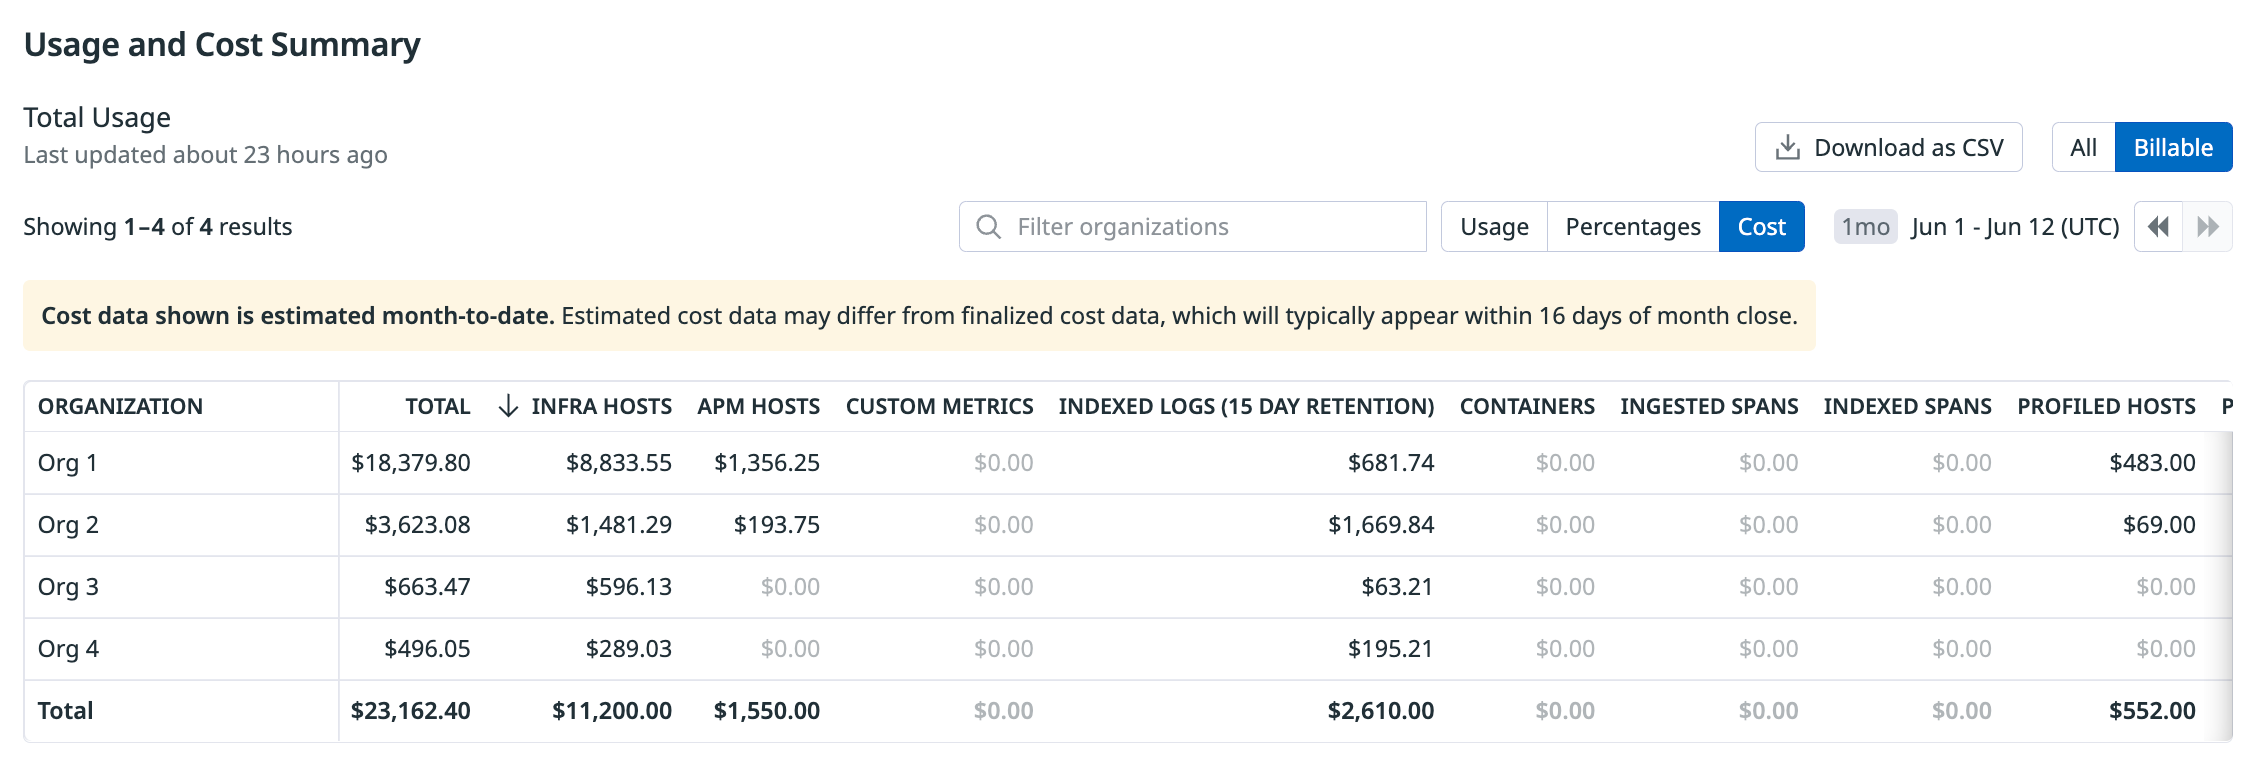
- View estimated month-to-date and historical costs for multi-organizations
- Attribute costs to each sub-organization
Cost chargebacks are derived by:
- Calculating the sub-organization usage ratio. This is done by dividing usage per sub-organization by the total parent organization usage.
- Applying the sub-organization usage ratio against the parent organization costs, providing the cost chargebacks per sub-organization.
Historical cost chargebacks
From a parent organization, view finalized historical costs aggregated by product and sub-organization.
- While logged in to the parent organization, navigate to Plan & Usage.
- Select the Usage tab.
- Click Individual Organizations.
- Ensure the Billable and Cost toggles are selected.
- Use the date selector to view a prior month for which billing has completed.
Note: Data is available after month close, which is approximately 16 days after the end of the month.
Estimated cost chargebacks
From a parent organization, view estimated costs aggregated by product and sub-organization.
Estimated cost data is available for the current month. If historical cost data is not yet available for the prior month, estimated cost data also displays for the prior month.
- While logged in to the parent organization, navigate to Plan & Usage.
- Select the Usage tab.
- Click Individual Organizations.
- Ensure the Billable and Cost toggles are selected.
- Ensure the date selector shows the current or prior month.
Download
- To download historical or estimated cost chargeback data as a comma separated value file, click Download as CSV.
- See Get historical cost across your account to query historical cost chargeback data through the API.
- See Get estimated cost across your account to query estimated cost chargeback data through the API.
How billing aggregations affect cost changes
Your estimated month-to-date Datadog bill varies throughout the month. The type of aggregation used to bill each product determines how the costs are impacted. For the best visualization, see the cost summary feature chart. Each Products filter includes the relevant billing aggregation method next to the product name.
Percentile and average usage billing
Products billed by the maximum count (high-water mark) of the lower 99 percent of usage for the month include infrastructure hosts and APM hosts. Products billed by the average over the month include custom metrics and Fargate tasks. For these two types of products, expect their costs to remain relatively stable throughout the month. However, they are still subject to cost changes if there is a significant spike or drop in usage.
Sum of usage billing
Products billed by the sum of usage throughout the month include indexed logs and ingested logs. For these types of products, expect their costs to increase or decrease based on changes to usage volume.
Further reading
Additional helpful documentation, links, and articles:


