- Agents
- Essentials
- Getting Started
- Agent
- API
- APM Tracing
- Containers
- Dashboards
- Database Monitoring
- Datadog
- Datadog Site
- DevSecOps
- Incident Management
- Integrations
- Internal Developer Portal
- Logs
- Monitors
- Notebooks
- OpenTelemetry
- Profiler
- Search
- Session Replay
- Security
- Serverless for AWS Lambda
- Software Delivery
- Synthetic Monitoring and Testing
- Tags
- Workflow Automation
- Learning Center
- Support
- Glossary
- Standard Attributes
- Guides
- Agent
- Integrations
- Extend Datadog
- Authorization
- DogStatsD
- Custom Checks
- Integrations
- Build an Integration with Datadog
- Create an Agent-based Integration
- Create an API-based Integration
- Create a Log Pipeline
- Integration Assets Reference
- Build a Marketplace Offering
- Create an Integration Dashboard
- Create a Monitor Template
- Create a Cloud SIEM Detection Rule
- Install Agent Integration Developer Tool
- Service Checks
- Community
- Guides
- OpenTelemetry
- Administrator's Guide
- API
- Partners
- Datadog Mobile App
- DDSQL Reference
- CoScreen
- CoTerm
- Remote Configuration
- Cloudcraft (Standalone)
- In The App
- Dashboards
- Notebooks
- DDSQL Editor
- Reference Tables
- Sheets
- Monitors and Alerting
- Service Level Objectives
- Metrics
- Watchdog
- Bits AI
- Internal Developer Portal
- Error Tracking
- Change Tracking
- Event Management
- Incident Response
- Actions & Remediations
- Infrastructure
- Cloudcraft
- Resource Catalog
- Universal Service Monitoring
- End User Device Monitoring
- Hosts
- Containers
- Processes
- Serverless
- Network Monitoring
- Storage Management
- Cloud Cost
- Application Performance
- APM
- Continuous Profiler
- Database Monitoring
- Agent Integration Overhead
- Setup Architectures
- Setting Up Postgres
- Setting Up MySQL
- Setting Up SQL Server
- Setting Up Oracle
- Setting Up Amazon DocumentDB
- Setting Up MongoDB
- Setting Up ClickHouse
- Connecting DBM and Traces
- Data Collected
- Exploring Database Hosts
- Exploring Query Metrics
- Exploring Query Samples
- Exploring Database Schemas
- Exploring Recommendations
- Troubleshooting
- Guides
- Data Streams Monitoring
- Data Observability
- Digital Experience
- Real User Monitoring
- Synthetic Testing and Monitoring
- Continuous Testing
- Experiments
- Product Analytics
- Session Replay
- Software Delivery
- CI Visibility
- CD Visibility
- Deployment Gates
- Test Optimization
- Code Coverage
- PR Gates
- DORA Metrics
- Feature Flags
- Developer Integrations
- Security
- Security Overview
- Cloud SIEM
- Code Security
- Cloud Security
- App and API Protection
- AI Guard
- Workload Protection
- Sensitive Data Scanner
- AI Observability
- Log Management
- Observability Pipelines
- Configuration
- Sources
- Processors
- Destinations
- Packs
- Akamai CDN
- Amazon CloudFront
- Amazon VPC Flow Logs
- AWS Application Load Balancer Logs
- AWS CloudTrail
- AWS Elastic Load Balancer Logs
- AWS Network Load Balancer Logs
- Cisco ASA
- Cloudflare
- F5
- Fastly
- Fortinet Firewall
- HAProxy Ingress
- Istio Proxy
- Juniper SRX Firewall Traffic Logs
- Netskope
- NGINX
- Okta
- Palo Alto Firewall
- Windows XML
- ZScaler ZIA DNS
- Zscaler ZIA Firewall
- Zscaler ZIA Tunnel
- Zscaler ZIA Web Logs
- Search Syntax
- Scaling and Performance
- Monitoring and Troubleshooting
- Guides and Resources
- Log Management
- CloudPrem
- Administration
Datadog Audit Trail
Overview
As an administrator or security team member, you can use Datadog Audit Trail to see who is using Datadog within your organization and the context in which they are using Datadog. As an individual, you can see a stream of your own actions, too.
There are two types of events that can occur within an audit trail: request events, which translate all requests made to Datadog’s API into customer records, or product-specific events.
For example, track request events so you can see what API calls led up to the event. Or, if you’re an enterprise or billing admin, use audit trail events to track user events that change the state of your infrastructure.
In this circumstance, audit events are helpful when you want to know product-specific events such as:
When someone changed the retention of an index because the log volume changed and, therefore, the monthly bill has changed.
Who modified processors or pipelines, and when they were modified, as a dashboard or monitor is now broken and needs to be fixed.
Who modified an exclusion filter because the indexing volume has increased or decreased and logs are unable to be found or your bill went up.
For security admins or InfoSec teams, audit trail events help with compliance checks and maintaining audit trails of who did what, and when, for your Datadog resources. For example, maintaining an audit trail:
Of anytime someone updates or deletes critical dashboard, monitors, and other Datadog resources.
For user logins, account, or role changes in your organization.
You can also analyze Audit Trail events with Cloud SIEM to detect threats and generate security signals. See Getting Started with Cloud SIEM for more information.
Note: Datadog’s tools and policies comply with PCI v4.0. For more information, see PCI DSS Compliance.
Setup
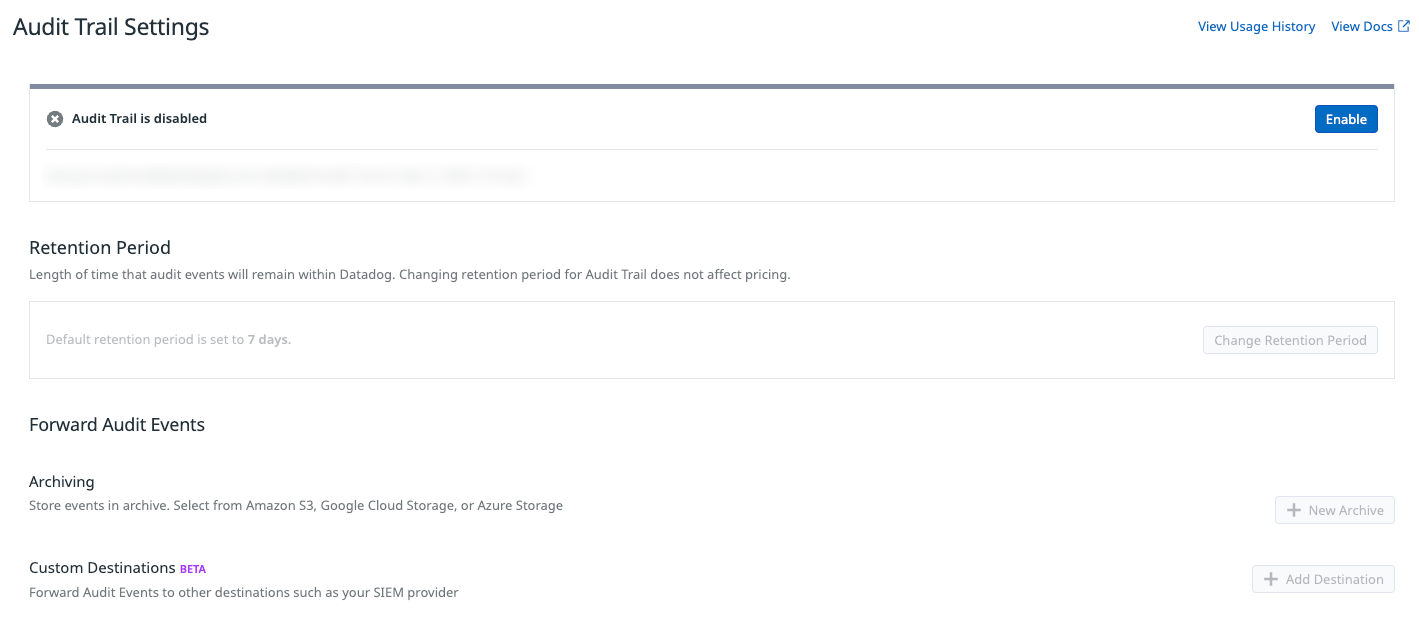
To enable Datadog Audit Trail, navigate to your Organization Settings and select Audit Trail Settings under COMPLIANCE. Click the Enable button.
To see who enabled Audit Trail:
- Navigate to Events Explorer.
- Enter
Datadog Audit Trail was enabled byin the search bar. You may have to select a wider time range to capture the event. - The most recent event with the title “A user enabled Datadog Audit Trail” shows who last enabled Audit Trail.
Configuration
Permissions
Only users with Audit Trail Write permission can enable or disable Audit Trail. Additionally, users need Audit Trail Read permission to view audit events using Audit Explorer.
Archiving
Archiving is an optional feature for Audit Trail. You can use archiving to write to Amazon S3, Google Cloud Storage, or Azure Storage and have your SIEM system read events from it. After creating or updating your archive configurations, it can take several minutes before the next archive upload is attempted. Events are uploaded to the archive every 15 minutes, so check back on your storage bucket in 15 minutes to make sure the archives are successfully being uploaded from your Datadog account.
To enable archiving for Audit Trail, navigate to your Organization Settings and select Audit Trail Settings under Compliance. Scroll down to Archiving and click the Store Events toggle to enable.
Retention
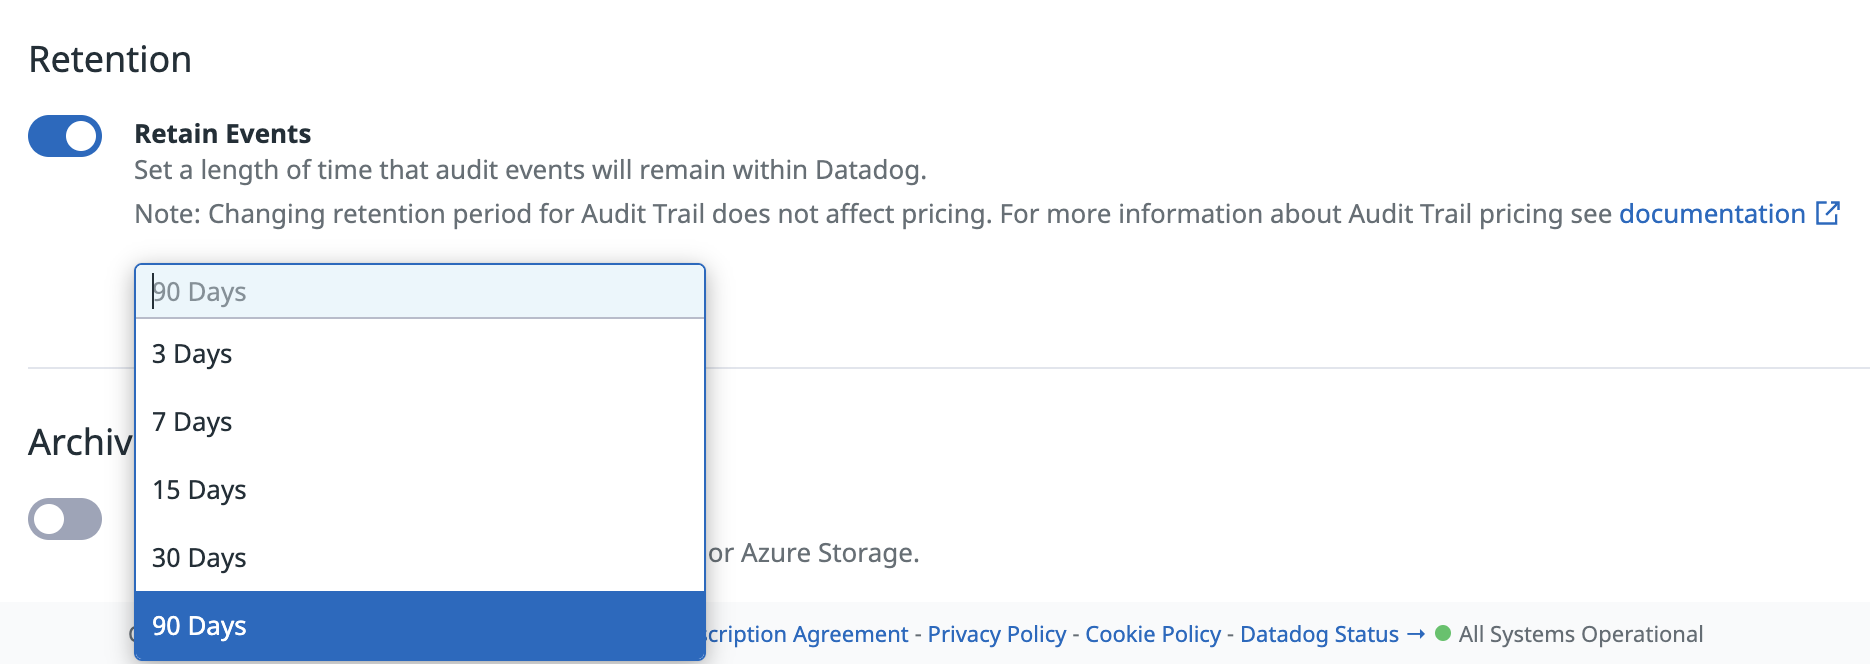
Retaining events is an optional feature for Audit Trail. In the Retention Period section, click the Change retention period to select a retention length appropriate for your use case.
When Audit Trail is enabled, the default retention period for an audit trail event is 90 days. You can set the retention period to: 3, 7, 15, 30, or 90 days.
When Audit Trail is disabled, the retention period is reset back to the default 7 days.
Explore audit events
To explore an audit event, navigate to the Audit Trail section, also accessible from your Organization Settings in Datadog.
Audit Trail events have the same functionality as logs within the Log Explorer:
Filter to inspect audit trail events by Event Names (Dashboards, Monitors, Authentication, and more), Authentication Attributes (Actor, API Key ID, User email, and more),
Status(Error,Warn,Info), Method (POST,GET,DELETE), and other facets.Inspect related audit trail events by selecting an event and navigating to the event attributes tab. Select a specific attribute to filter by or exclude from your search, such as
http.method,usr.email,client.ip, and more.
Natural language queries
This feature is not supported for your selected Datadog site ().
Use Natural Language Queries (NLQ) to describe what you’re looking for in plain English. Datadog automatically translates your request into a structured audit trail query, making it easier to explore audit events without needing to write complex syntax.
The system translates natural language input into Datadog queries and understands context such as users, actions, resources, and time ranges. It also detects relevant fields automatically, for example, “Who modified the payment dashboard last week” or “Show all role changes in the past 24 hours.”
Saved views
Efficient troubleshooting requires your data to be in the proper scope to permit exploration, have access to visualization options to surface meaningful information, and have relevant facets listed to enable analysis. Troubleshooting is contextual, and Saved Views make it easier for you and your teammates to switch between different troubleshooting contexts. You can access Saved Views in the upper left corner of the Audit Trail explorer.
All saved views, that are not your default view, are shared across your organization:
- Integration saved views come out-of-the-box with Audit Trail. These views are read-only, and identified by the Datadog logo.
- Custom saved views are created by users. They are editable by any user in your organization (except read only users), and identified with the avatar of the user who created them Click the Save button to create a new custom saved view from the current content of your explorer.
At any moment, from the saved view entry in the Views panel:
- Load or reload a saved view.
- Update a saved view with the configuration of the current view.
- Rename or delete a saved view.
- Share a saved view through a short-link.
- Star (turn into a favorite) a saved view so that it appears on top of your saved view list, and is accessible directly from the navigation menu.
Note: Update, rename, and delete actions are disabled for integration saved views and read only users.
Default view
The default view feature allows you to set a default set of queries or filters that you always see when you first open the Audit Trail explorer. You can come back to your default view by opening the Views panel and clicking the reload button.
Your existing Audit Trail explorer view is your default saved view. This configuration is only accessible and viewable to you, and updating this configuration does not have any impact on your organization. You can temporarily override your default saved view by completing any action in the UI or by opening links to the Audit Trail explorer that embed a different configuration.
At any moment, from the default view entry in the Views panel:
- Reload your default view by clicking on the entry.
- Update your default view with the current parameters.
- Reset your default view to Datadog’s defaults for a fresh restart.
Notable Events
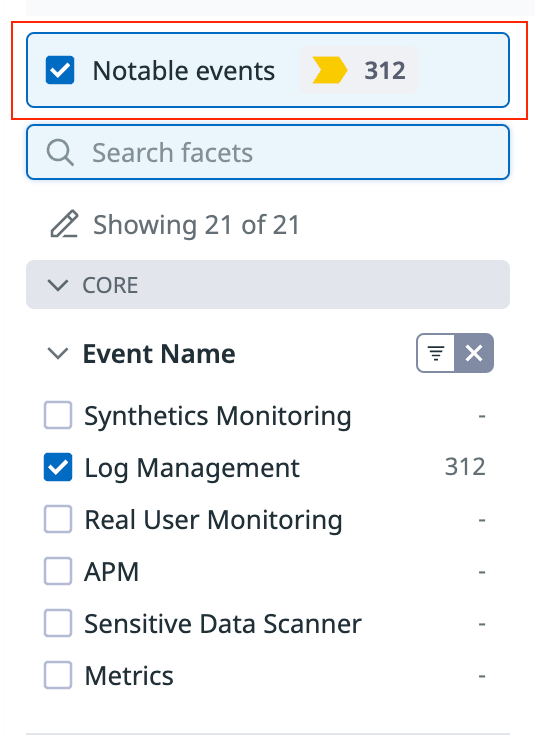
Notable events are a subset of audit events that show potential critical configuration changes that could impact billing or have security implications as identified by Datadog. This allows org admins to hone in on the most important events out of the many events generated, and without having to learn about all available events and their properties.
Events that match the following queries are marked as notable. You can also retrieve all notable events using the query is_notable_event:true.
| Description of audit event | Query in audit explorer |
|---|---|
| Changes to log-based metrics | @evt.name:"Log Management" @asset.type:"custom_metrics" |
| Changes to Log Management index exclusion filters | @evt.name:"Log Management" @asset.type:"exclusion_filter" |
| Changes to Log Management indexes | @evt.name:"Log Management" @asset.type:index |
| Changes to APM retention filters | @evt.name:APM @asset.type:retention_filter |
| Changes to APM custom metrics | @evt.name:APM @asset.type:custom_metrics |
| Changes to metrics tags | @evt.name:Metrics @asset.type:metric @action:(created OR modified) |
| Creations and deletion of RUM applications | @evt.name:"Real User Monitoring" @asset.type:real_user_monitoring_application @action:(created OR deleted) |
| Changes to Sensitive Data Scanner scanning groups | @evt.name:"Sensitive Data Scanner" @asset.type:sensitive_data_scanner_scanning_group |
| Creation or deletion of Synthetic tests | @evt.name:"Synthetics Monitoring" @asset.type:synthetics_test @action:(created OR deleted) |
| Activation, deactivation, and modification of Product Analytics for applications | @evt.name:"Product Analytics" @asset.type:product_analytics @action:(enabled OR disabled OR modified) |
Inspect Changes (Diff)
The Inspect Changes (Diff) tab in the audit event details panel compares the configuration changes that were made to what was previously set. It shows the changes made to dashboard, notebook, and monitor configurations, which are represented as JSON objects.
Filter audit events based on Reference Tables
Reference Tables containing over 1,000,000 rows cannot be used to filter events. See Add Custom Metadata with Reference Tables for more information on how to create and manage Reference Tables.
Reference Tables allow you to combine metadata with audit events, providing more information to investigate Datadog user behavior. Add a query filter based on a Reference Table to perform lookup queries. For more information on activating and managing this feature, see the Reference Tables guide.
To apply a query filter with Reference Tables, click on the + Add button next to the query editor and select Join with Reference Table. In the following example, the Reference Table query filter is used to search for dashboards modified by users who are accessing Datadog from non-authorized IP addresses:
API key auditing
Log management users can audit API key usage with Audit Trail. For API key auditing, logs have a datadog.api_key_uuid tag that contains the UUID of the API key used for collecting those logs. Use this information to determine:
- How API keys are used across your organization and telemetry sources.
- API key rotation and management.
Create a monitor
To create a monitor on a type of audit trail event or by specific Audit Trail attributes, see the Audit Trail Monitor documentation. For example, set a monitor that triggers when a specific user logs in, or set a monitor for anytime a dashboard is deleted.
Create a dashboard or a graph
Give more visual context to your audit trail events with dashboards. To create an audit dashboard:
- Create a New Dashboard in Datadog.
- Select your visualization. You can visualize Audit events as top lists, timeseries, and lists.
- Graph your data: Under edit, select Audit Events as the data source, and create a query. Audit events are filtered by count and can be grouped by different facets. Select a facet and limit.
- Set your display preferences and give your graph a title. Click the Save button to create the dashboard.
Send out a scheduled report
You can save your Audit Trail query as a dashboard and send out a scheduled report. These reports can be useful for regular monitoring of the Datadog platform usage. For example, you can send out a weekly email of the number of unique Datadog user logins by country. This query allows you to monitor anomalous login activity or receive automated insight on usage.
To create a scheduled report:
- Navigate to Audit Trail, enter your query to filter your audit events.
- Click More and select Save to dashboard.
- You can either save to an existing dashboard or create a new dashboard.
- On your dashboard, click Share and select Schedule report.
- Follow the instructions in Schedule a Report to set up your report.
Download Audit Events as CSV
Datadog Audit Trail allows you to download up to 100K audit events as a CSV file locally. These events can then be analyzed locally, uploaded to a different tool for further analytics, or shared with appropriate team members as part of a security and compliance exercise.
To export audit events as CSV:
- Run the appropriate search query that captures the events you are interested in
- Add event fields as columns in the view that you want as part of CSV
- Click on Download as CSV
- Select the number of events to export and export as CSV
Out-of-the-box dashboard
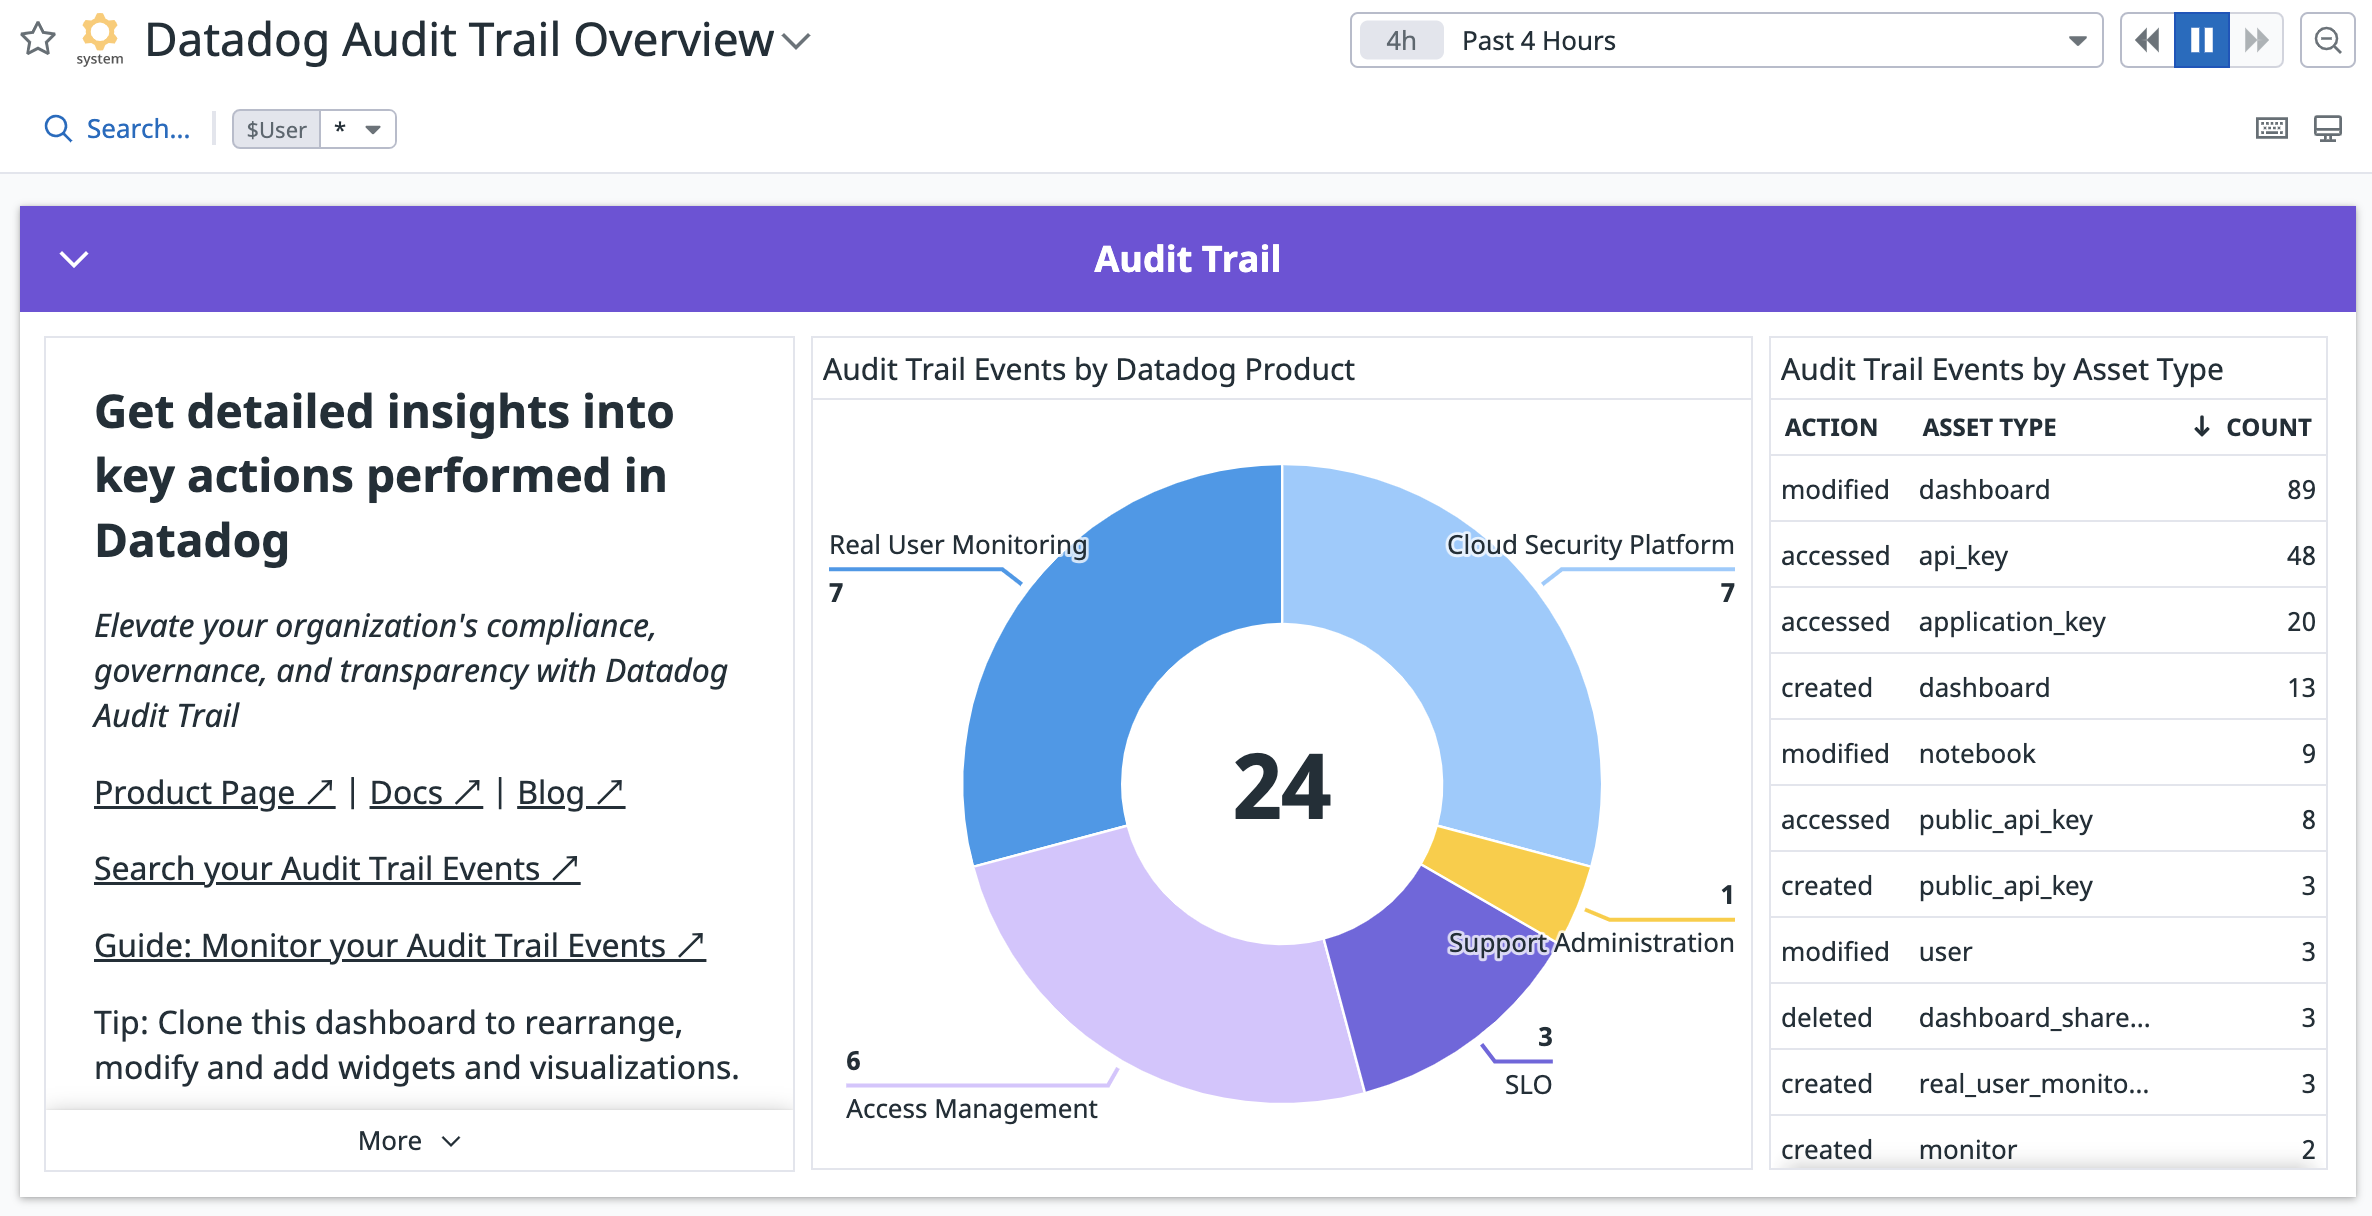
Datadog Audit Trail comes with an out-of-the-box dashboard that shows various audit events, such as index retention changes, log pipeline changes, dashboard changes, and more. Clone this dashboard to customize queries and visualizations for your auditing needs.
Audit terminal commands with CoTerm
CoTerm allows you to record terminal sessions for analysis in Datadog. You can use CoTerm to audit sensitive system changes done through terminals. You can then review these commands and their output as logs and events in Datadog.
Further Reading
Additional helpful documentation, links, and articles:


